Rice Science ›› 2025, Vol. 32 ›› Issue (1): 52-66.DOI: 10.1016/j.rsci.2024.10.002
收稿日期:2024-06-19
接受日期:2024-10-14
出版日期:2025-01-28
发布日期:2025-02-20
. [J]. Rice Science, 2025, 32(1): 52-66.
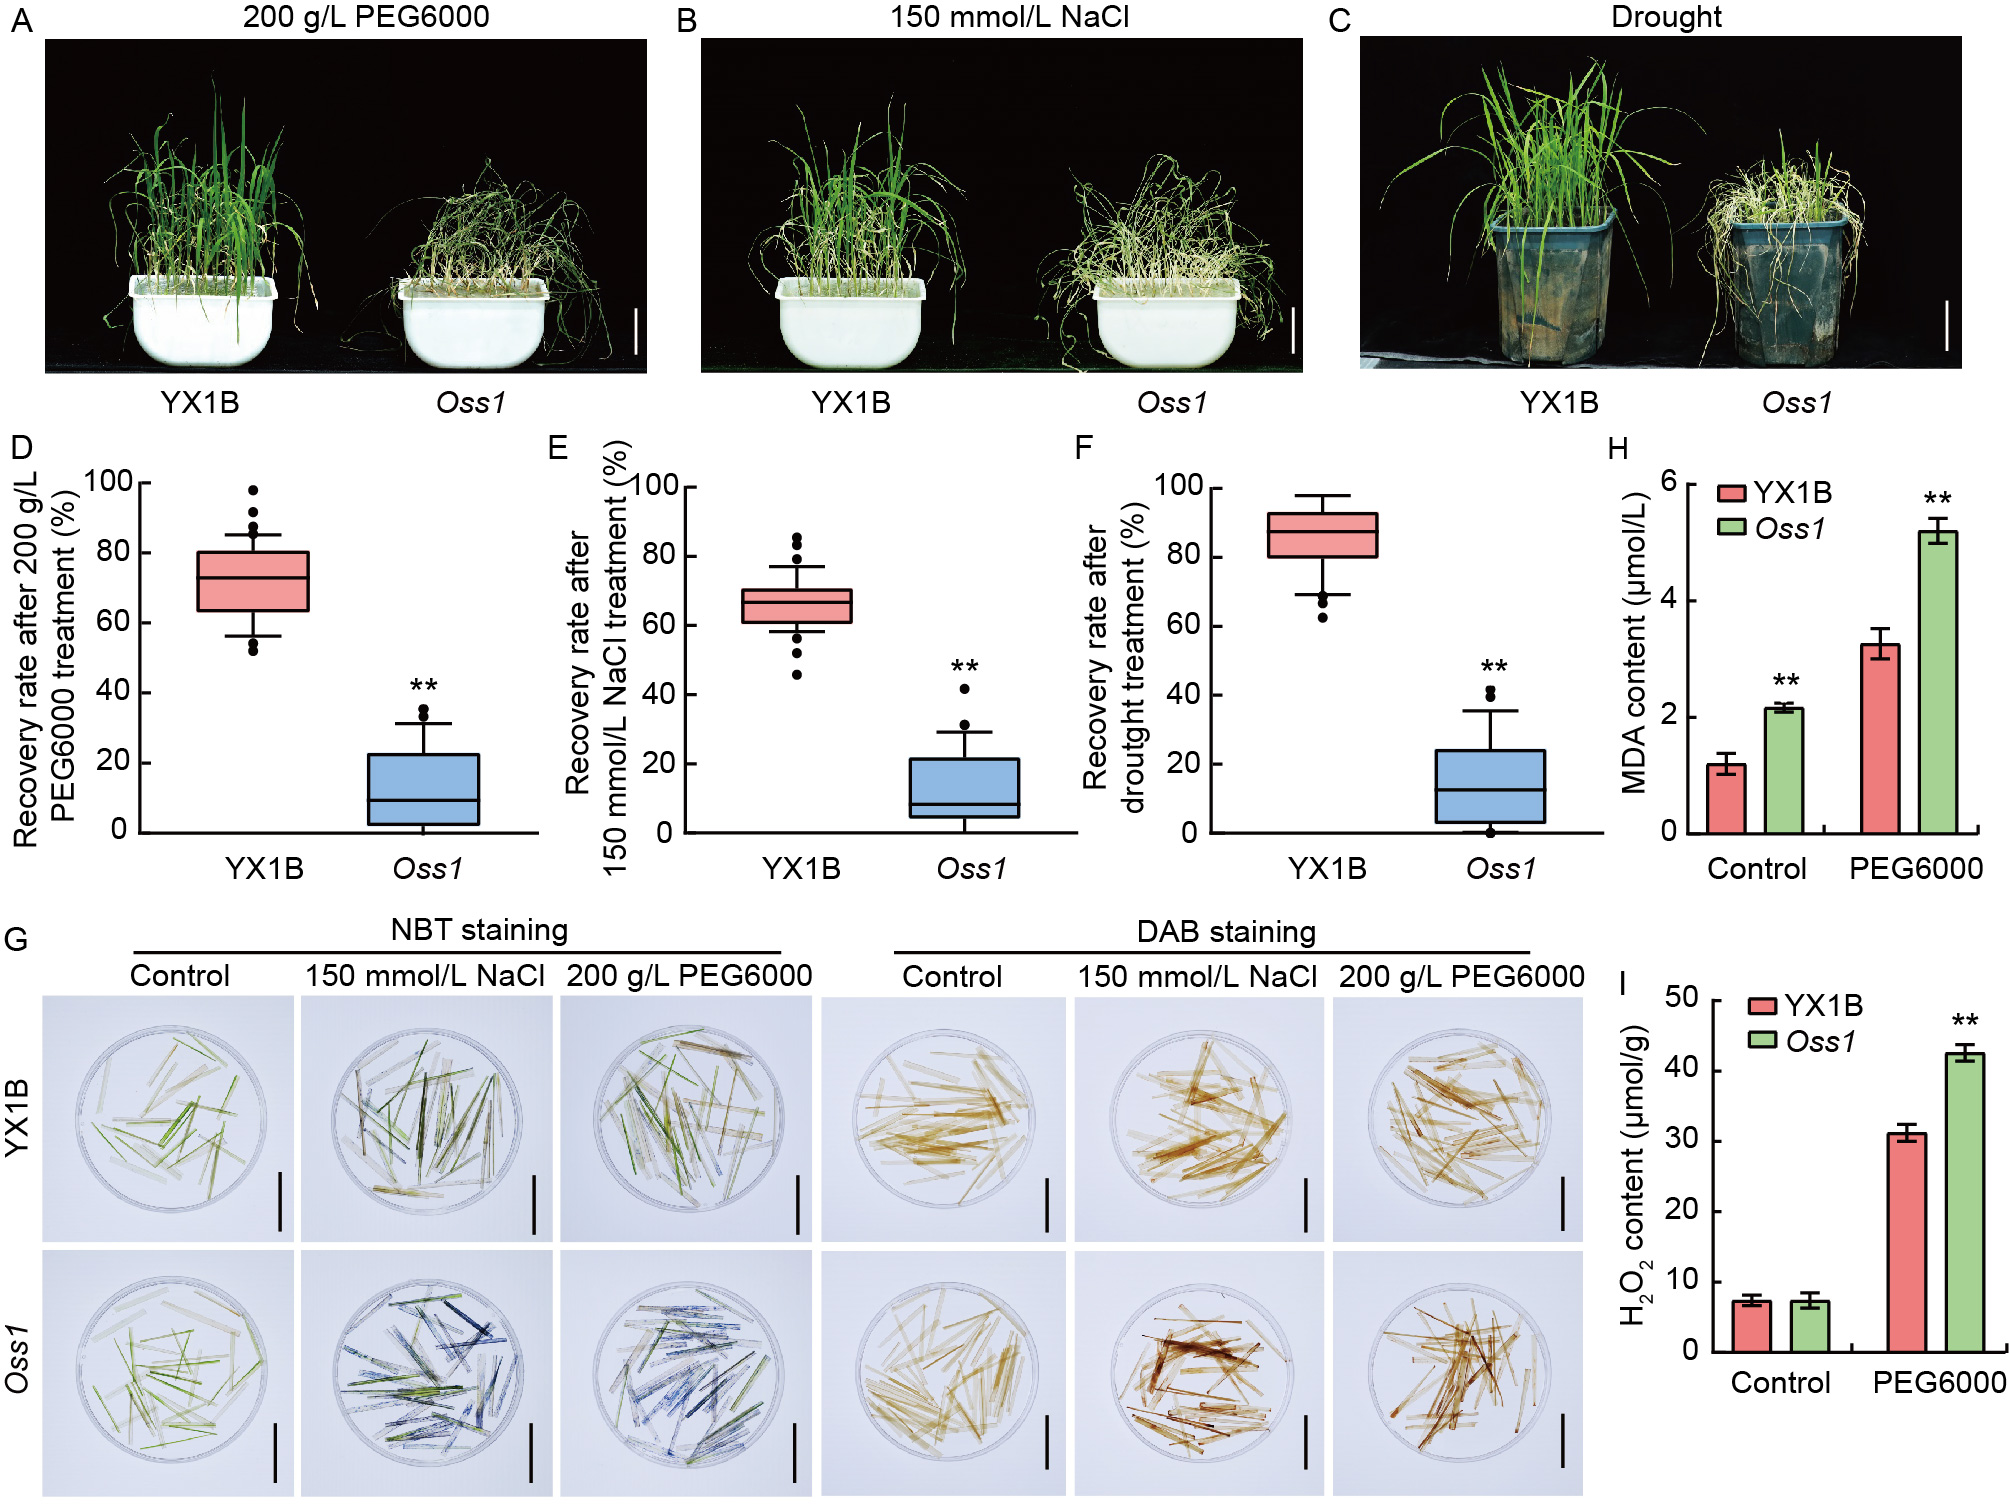
Fig. 1. Drought and osmotic sensitivity phenotypes of wild type Yixiang 1B (YX1B) and Oss1 mutant. A-C, Phenotypes of YX1B and Oss1 after treatment with 200 g/L PEG6000 (A), 150 mmol/L NaCl (B), and drought for 5 d with sandy moisture at 8% (C). Scale bars, 5 cm. D-F, Recovery rates of YX1B and Oss1 after treatment with 200 g/L PEG6000 (D), 150 mmol/L NaCl (E), and drought for 5 d with sandy moisture at 8% (F). G, Nitroblue tetrazolium (NBT) and 3,3′-diaminobenzidine (DAB) staining of YX1B and Oss1 to visualize reactive oxygen species (ROS) accumulation. Blue spots originate from the reaction of superoxide anions with NBT, indicating ROS accumulation. Brown spots result from peroxidase breaking down hydrogen peroxide (H2O2), oxidizing DAB to produce a brown precipitate. Scale bars, 5 cm. H and I, Malondialdehyde (MDA) and H2O2 contents in YX1B and Oss1 after treatment with 200 g/L PEG6000 for 24 h. In D-F, H, and I, data are Mean ± SD (n = 3). **, P < 0.01 by the Student’s t-test.

Fig. 2. Mapping and cloning of CTR4 by MutMap sequencing and its expression levels under different treatments. A, Distribution of ∆index of single nucleotide polymorphisms (SNPs) across the 12 chromosomes. ∆SNP-index means the absolute value of the difference in SNP index between the phenotypic bulks of wild type Yixiang 1B (YX1B) and the Oss1 mutant. B, Mutation sites in the Oss1 alleles within the genome. ATG and TGA represent the translation start and stop codons, respectively. Black lines indicate introns, black boxes represent exons, and white boxes denote the 5′ untranslated region (5′-UTR) and 3′ untranslated region (3′-UTR). C, Relative expression levels of CTR4 in Dongjin and Yixiang 1B after treatment with 200 g/L PEG6000 and 150 mmol/L NaCl. OsActin (LOC_Os03g50885) was used as the internal reference, and the expression level of CTR4 in untreated seedlings at 0 h was used as the normalized reference value. Data are Mean ± SE (n = 3).
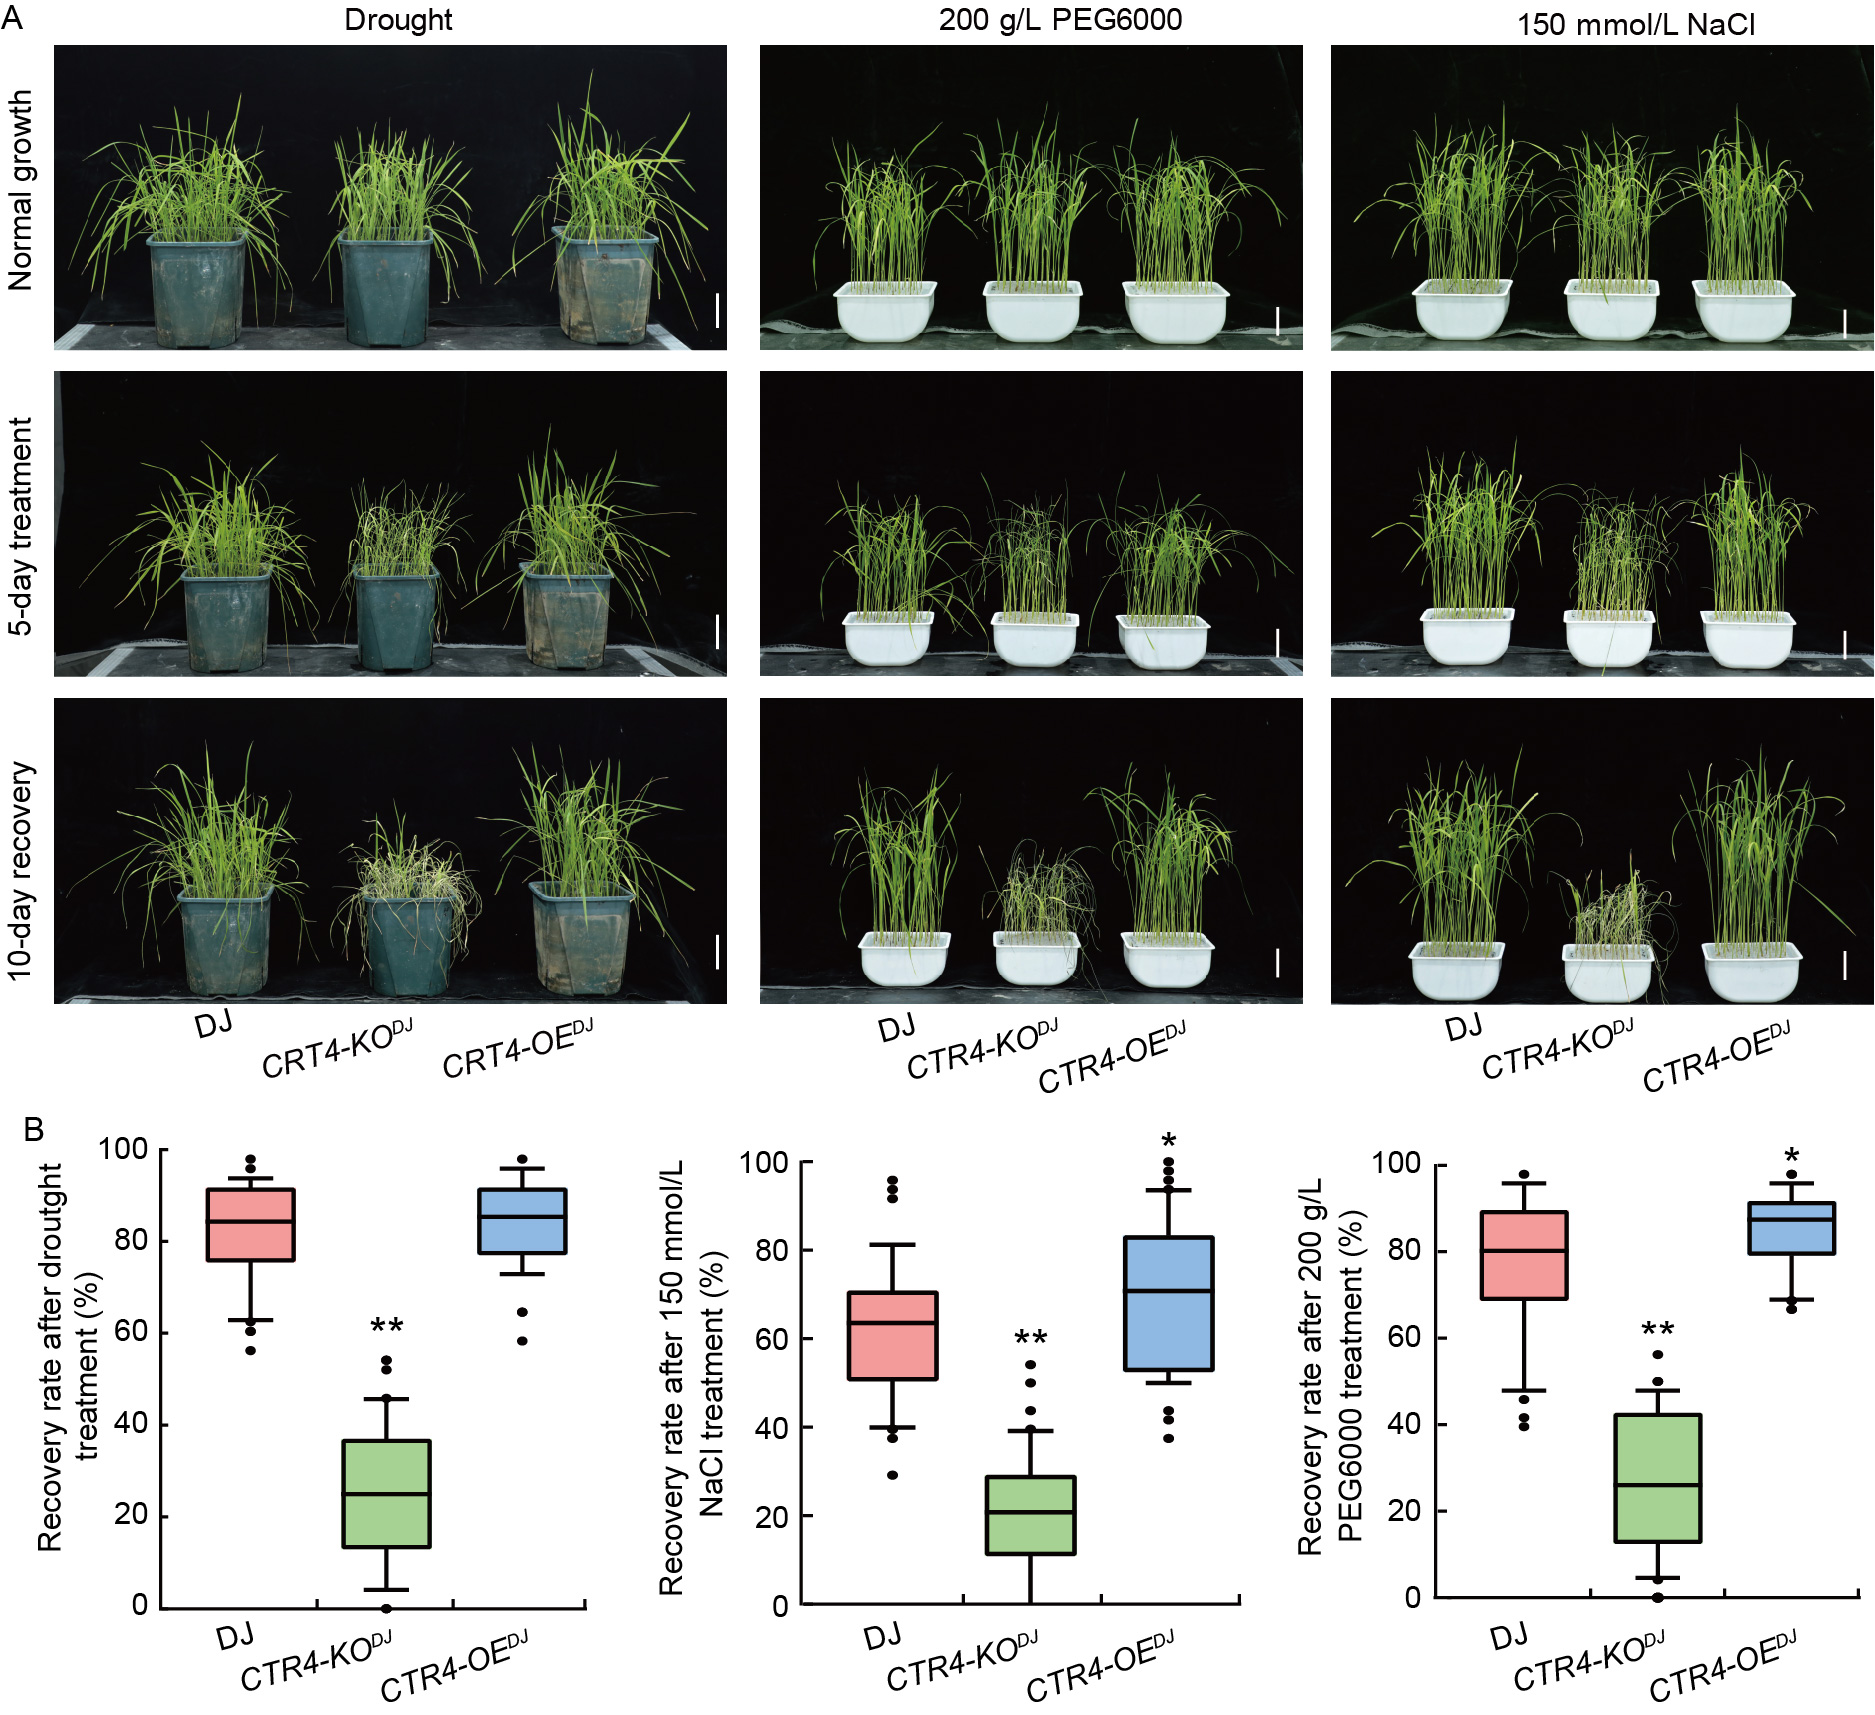
Fig. 3. Drought and saline sensitivity phenotype of CTR4. A, Phenotypes of wild type Dongjin (DJ), knockout mutant line CTR4-KODJ, and overexpression line CTR4-OEDJ after treatment with drought (8% moisture content in the sandy soil), 200 g/L PEG600, and 150 mmol/L NaCl for 0 and 5 d, followed by 10 d of recovery. Scale bars, 5 cm. B, Recovery rates of DJ, CTR4-KODJ, and CTR4-OEDJ after treatment with drought (D), 200 g/L PEG6000 (E), and 150 mmol/L NaCl (F). Data are Mean ± SE (n = 3). * and **, P < 0.05 and P < 0.01, respectively, by the Student’s t-test.
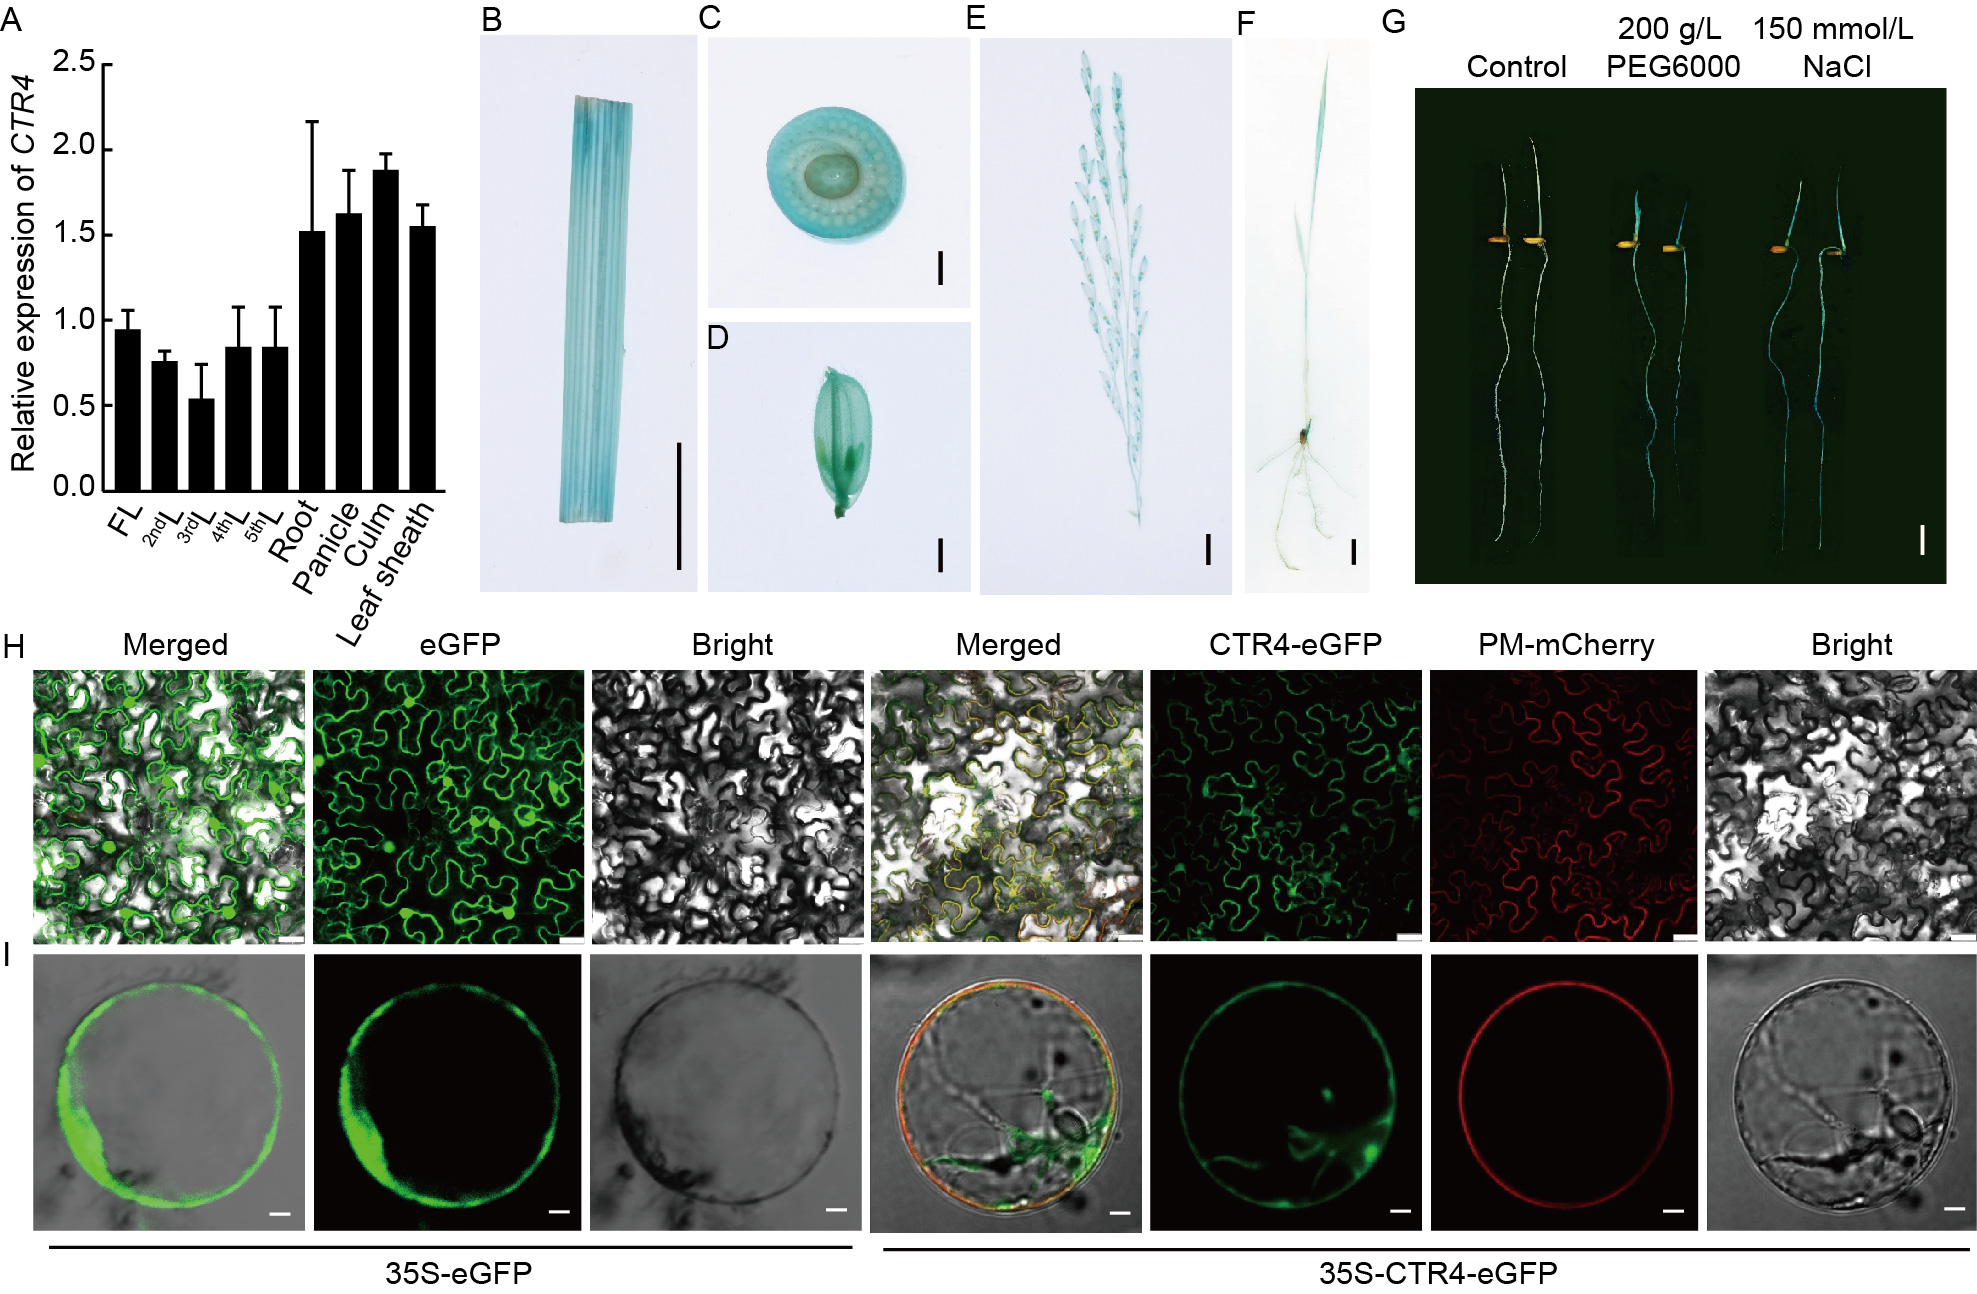
Fig. 4. CTR4 was constitutively expressed in rice tissues and induced by abiotic stress. A, Relative expression levels of CTR4 in different tissues, including flag leaf (FL), second leaf from the top (2ndL), third leaf from the top (3ndL), fourth leaf from the top (4thL), fifth leaf from the top (5thL), root, panicle, culm, and leaf sheath, of wild type Yixiang 1B (YX1B). Actin1 was used as the internal reference gene. Data are Mean ± SD (n = 3). B-F, CTR4PRO-GUS plant staining in young leaf (B), node (C), spikelet (D), panicle (E), and seedlings (F). Scale bars in B-F, 1 cm, 2 mm, 2 mm, 1 cm, and 1 cm, respectively. G, Staining of GUS transgenic plants after 24 h of 200 g/L PEG6000 and 150 mmol/L NaCl treatments. Scale bar, 2 cm. H-I, Subcellular localization of CTR4 in tobacco leaves (H) and rice protoplasts (I) with eGFP used for subcellular localization control. Green represents the fluorescence signal from the green fluorescent protein (GFP), red represents the fluorescence signal from the plasma membrane (PM) protein, and yellow indicates where the signals overlap in the combined image. Scale bars in H and I, 25 μm and 10 μm, respectively.
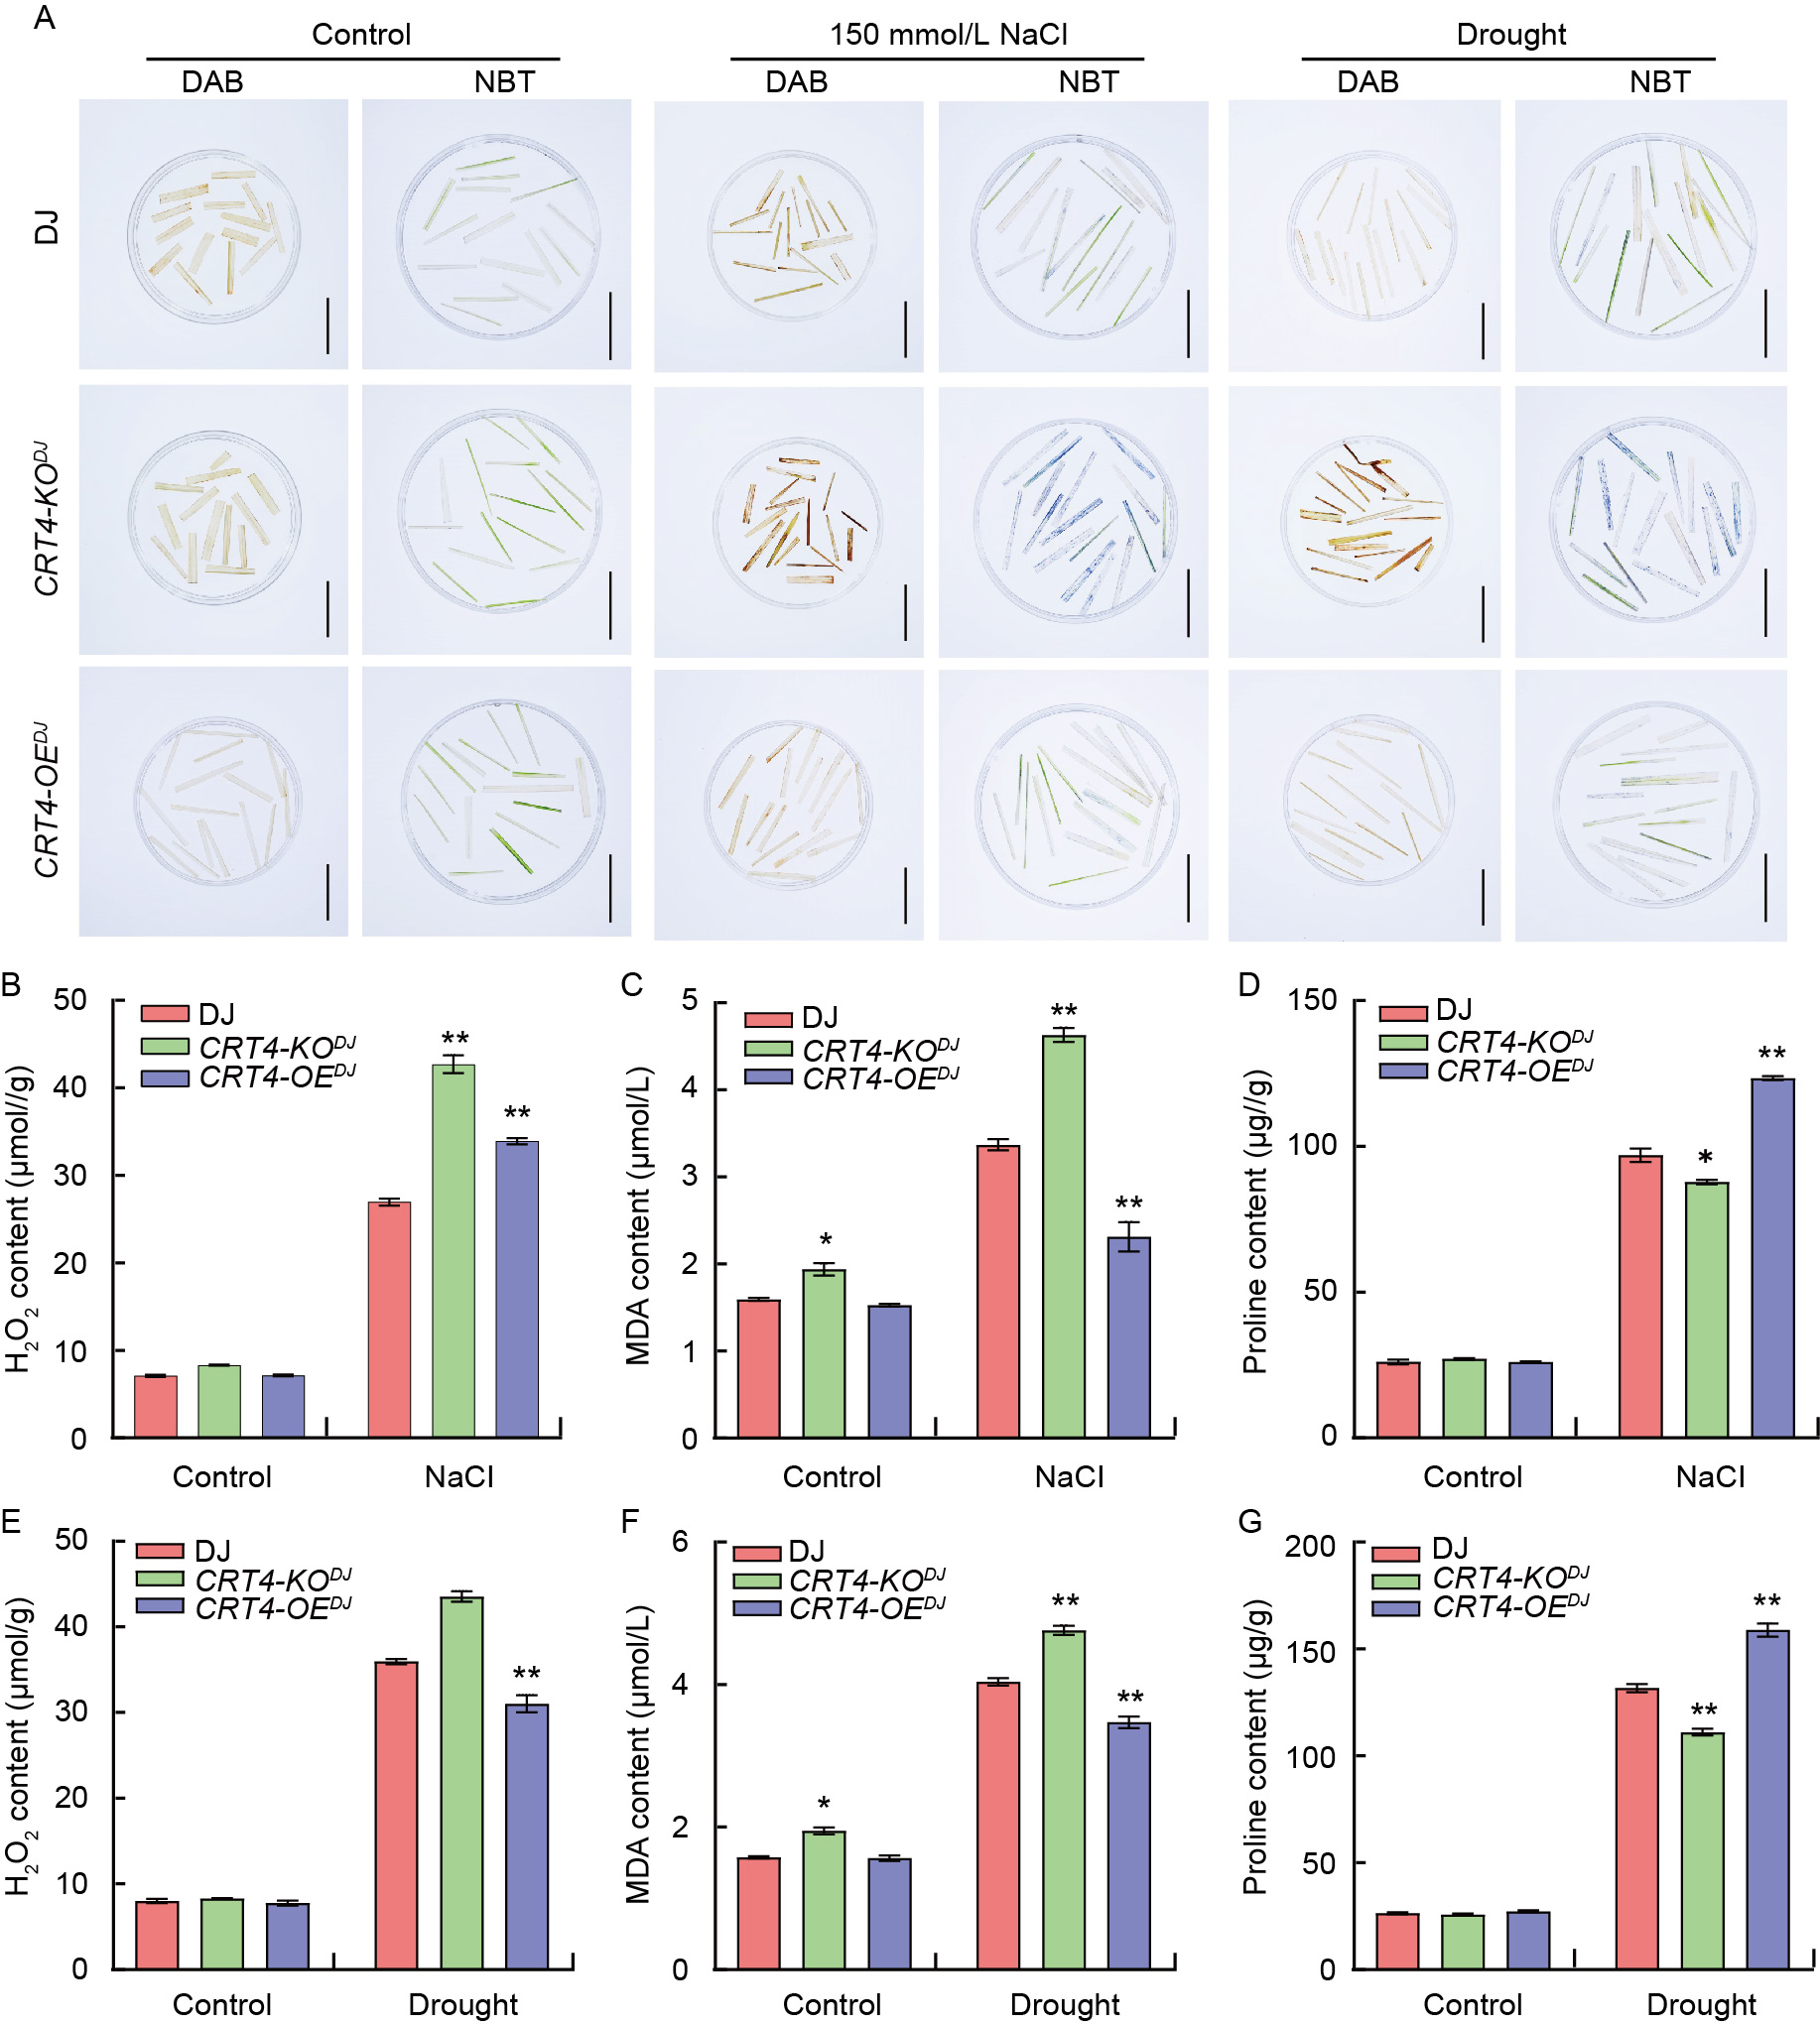
Fig. 5. Accumulation of reactive oxygen species (ROS) in rice leaves of wild type Dongjin (DJ), knockout mutant line CTR4-KODJ, and overexpression line CTR4-OEDJ. A, 3,3′-Diaminobenzidine (DAB) and nitroblue tetrazolium (NBT) staining for ROS accumulation. Brown spots result from peroxidase breaking down H2O2, oxidizing DAB to produce a brown precipitate. Blue spots originate from the reaction of superoxide anions with NBT, generating a blue precipitate used to label ROS accumulation. Scale bars, 5 cm. B-G, H2O2 contents after NaCl (B) and drought (E) treatments, malondialdehyde (MDA) contents after NaCl (C) and drought (F) treatments, and proline contents after NaCl (D) and drought (G) treatments. Data are Mean ± SE (n = 3). * and **, P < 0.05 and P < 0.01, respectively, by the Student’s t-test.
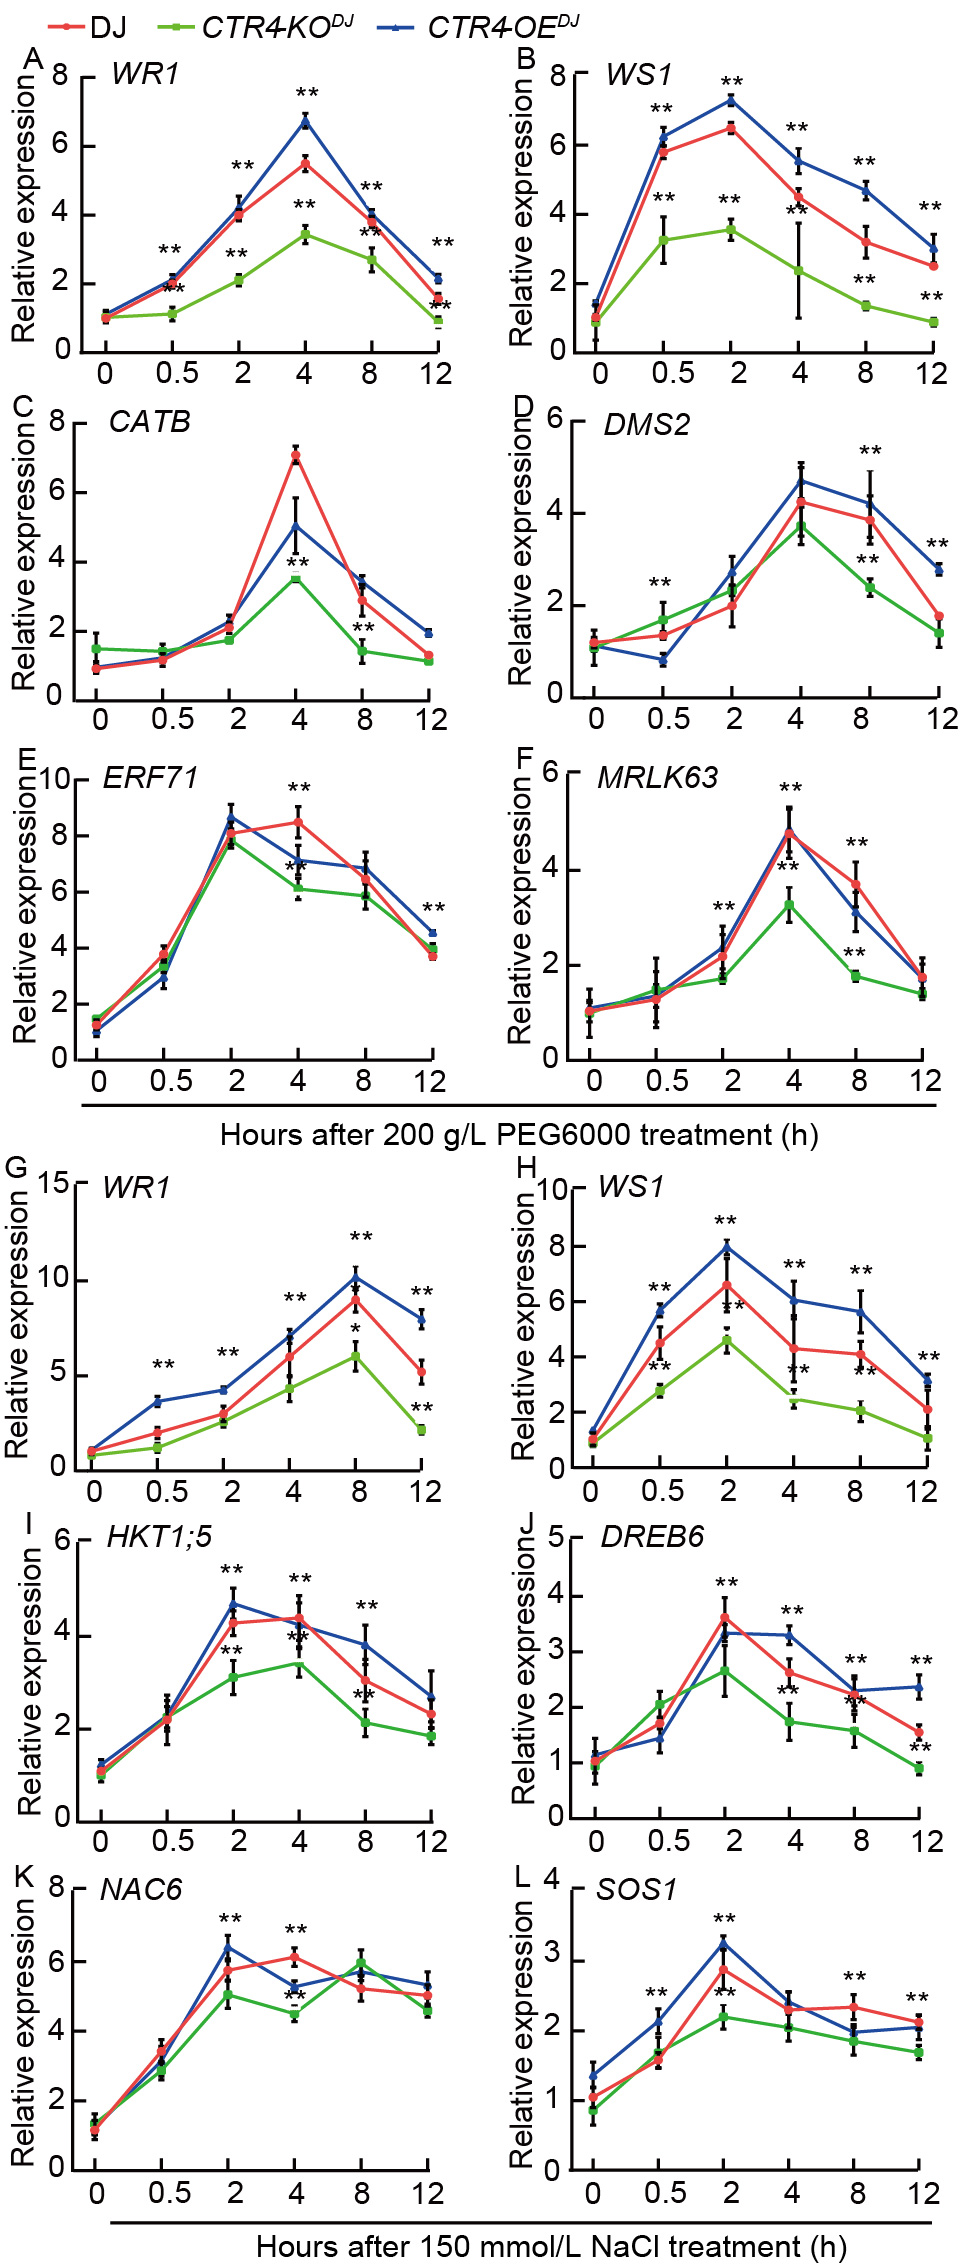
Fig. 6. Transcriptional analysis of genes regulated in drought and saline tolerance in roots of wild type Dongjin (DJ) and knockout mutant line (CTR4-KODJ) and overexpression line (CTR4-OEDJ). A-F, Relative expression of WR1 (A), WS1 (B), CATB (C), DMS2 (D), ERF71 (E), MRLK63 (F) under 200 g/L PEG6000 at 0.5, 1, 2, 4, 8, and 12 h after treatment. G-L, Relative expression of WR1 (G), WS1 (H), HKT1;5 (I), DREB6 (J), NAC6 (K), and SOS1 (L) under NaCl stress at 0.5, 1, 2, 4, 8, and 12 h after treatment. Actin1 was used as the internal reference gene. Data are Mean ± SE (n = 3). **, P < 0.01 by the Student’s t-test.
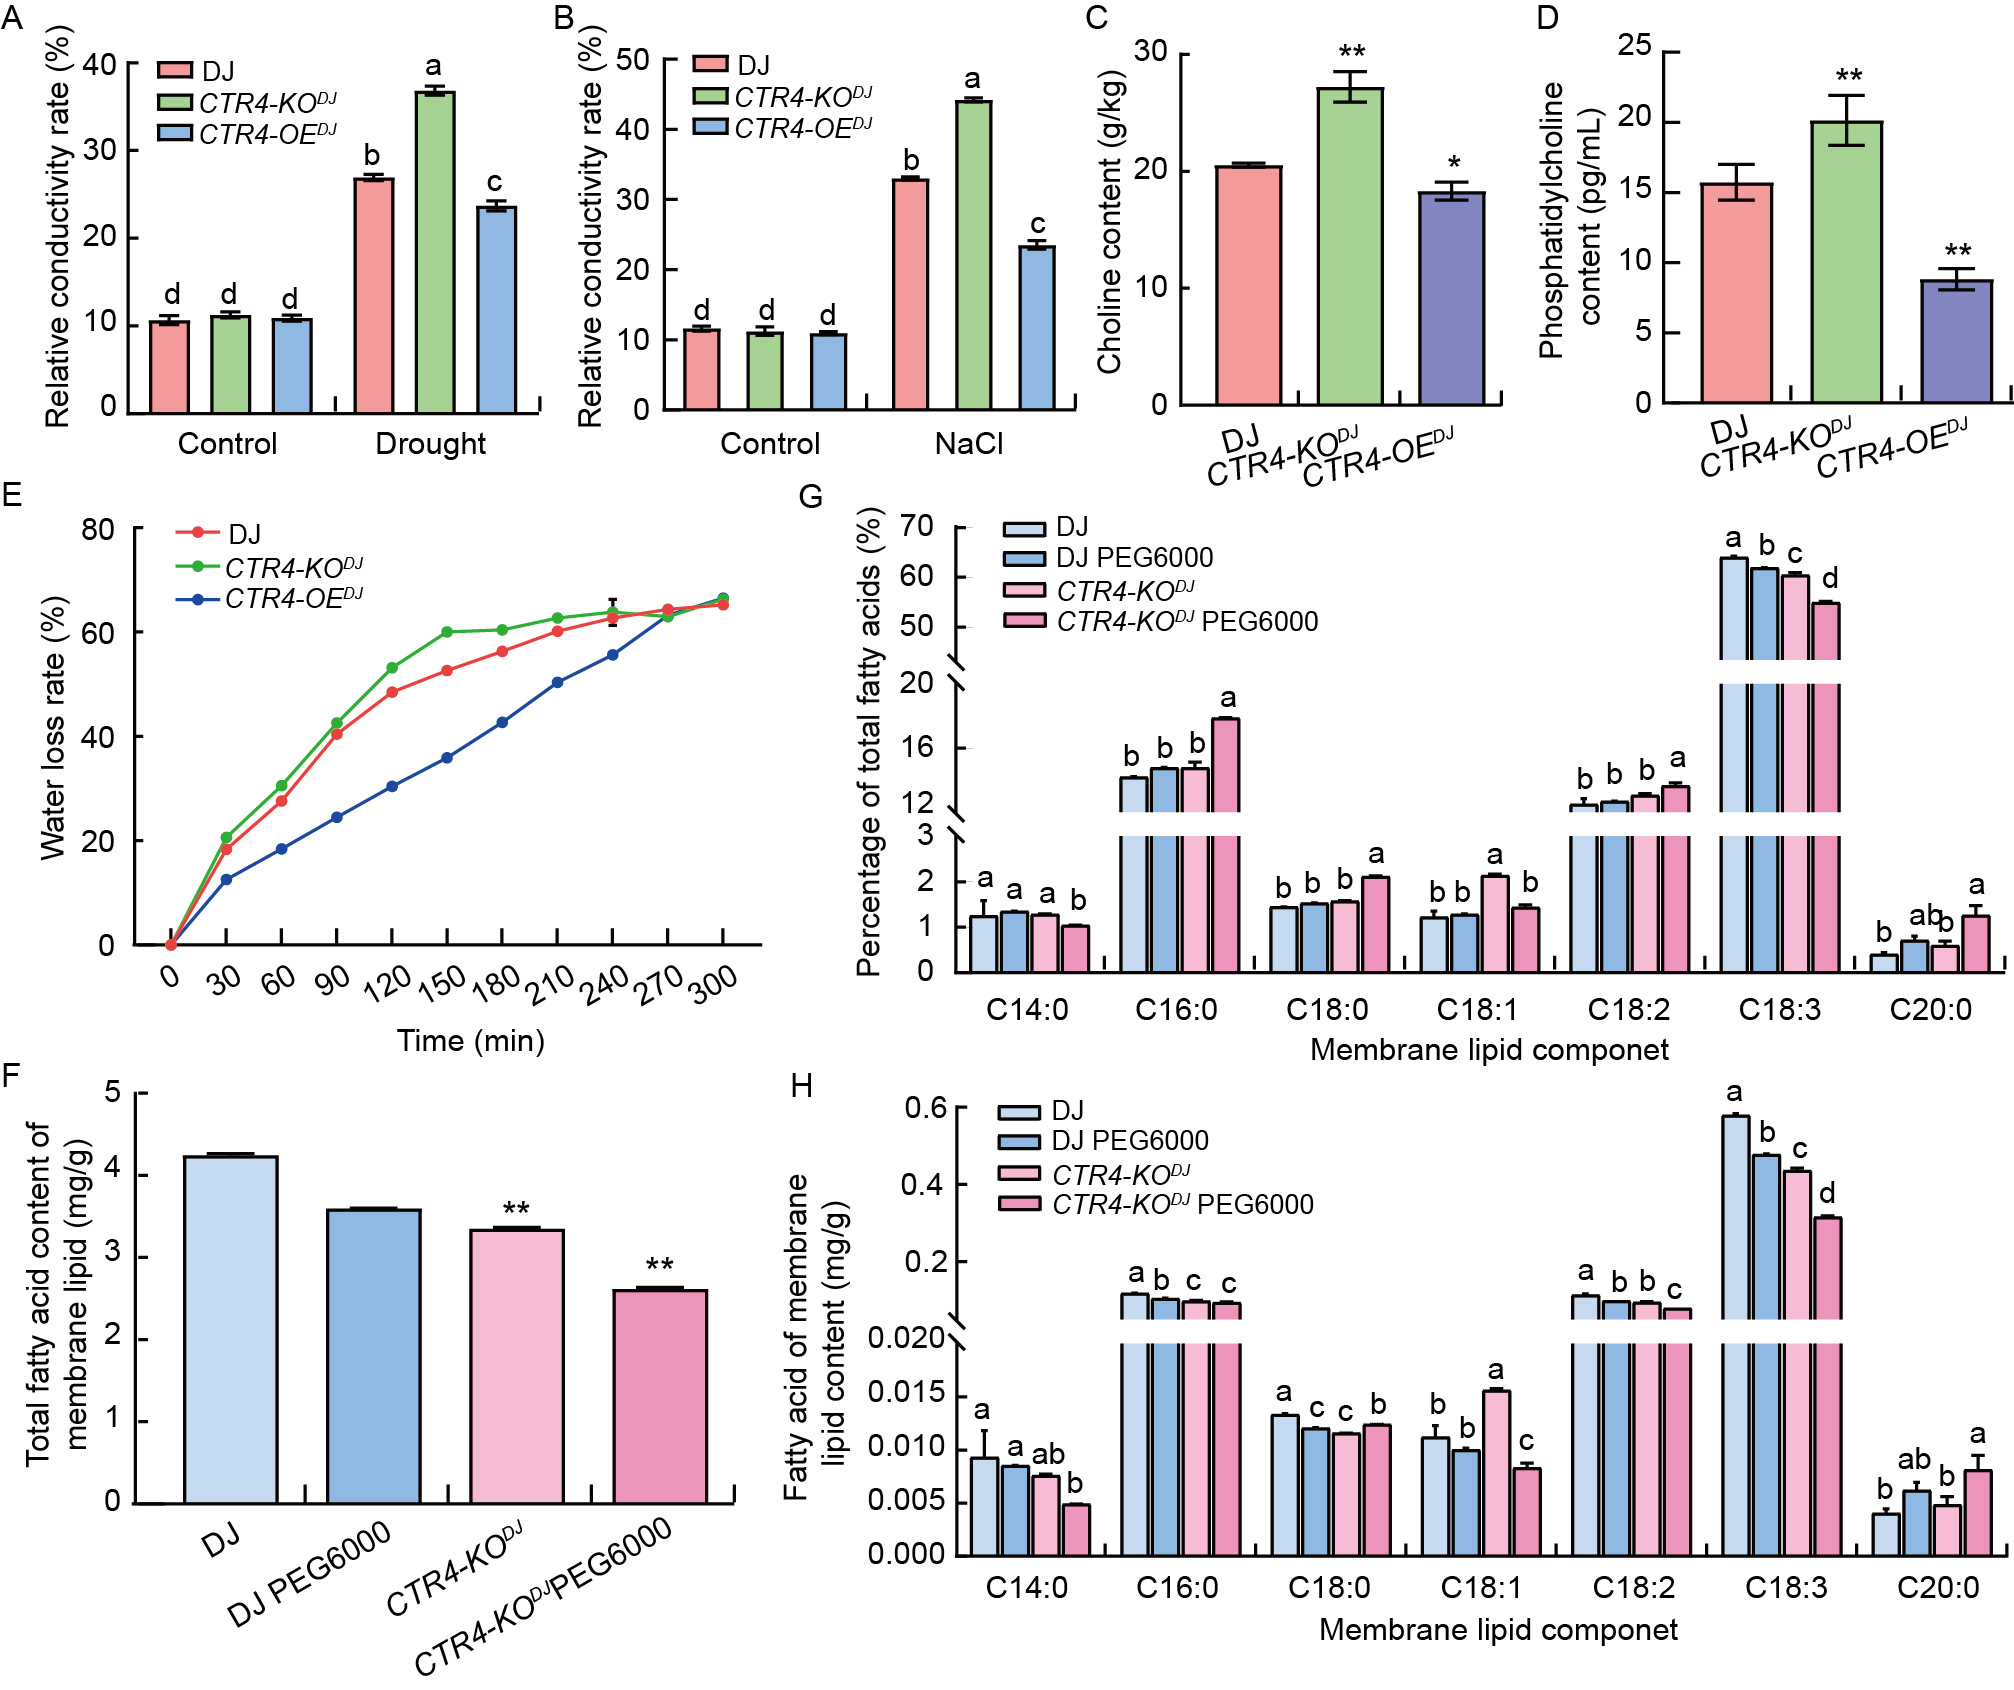
Fig. 7. CTR4 is involved in regulation of rice cell membrane homeostasis. A and B, Relative conductivity rates of wild type Dongjin (DJ), knockout mutant line (CTR4-KODJ), and over expression lines (CTR4-OEDJ under drought (A) and 150 mmol/L NaCl (B) treatments. Data are Mean ± SE (n = 3). The different lowercase letters on the bars denote the significant difference at P < 0.05. C and D, Choline (C) and phosphatidylcholine (D) contents in leaves of untreated DJ, CTR4-KODJ, and CTR4-OEDJ. Data are Mean ± SE (n = 3). * and **, P < 0.05 and P < 0.01, respectively, by the Student’s t-test between wide-type and mutants. E, Water loss rates of DJ, CTR4-KODJ, and CTR4-OEDJ at 25 ºC. F, Total fatty acid content of membrane lipids in DJ and CTR4-KODJ seedlings after 5 d of 200 g/L PEG6000 treatment. Data are Mean ± SE (n = 3). The different lowercase letters on the bars denote the significant difference at P < 0.05. G and H, Percentage of total fatty acids content of membrane lipids (G) and fatty acid content of membrane lipids (H) in DJ and CTR4-KODJ seedlings after 5 d of 200 g/L PEG6000 treatment. Data are Mean ± SE (n = 3). The different lowercase letters on the bars denote the significant difference at P < 0.05 within each fatty acid group.
| [1] | Apel K, Hirt H. 2004. Reactive oxygen species: Metabolism, oxidative stress, and signal transduction. Annu Rev Plant Biol, 55: 373-399. |
| [2] | Aroca A, Zhang J, Xie Y J, et al. 2021. Hydrogen sulfide signaling in plant adaptations to adverse conditions: Molecular mechanisms. J Exp Bot, 72(16): 5893-5904. |
| [3] | Black S A G, Rylett R J. 2012. Choline transporter CHT regulation and function in cholinergic neurons. Cent Nerv Syst Agents Med Chem, 12(2): 114-121. |
| [4] | Blumwald E, Aharon G S, Apse M P. 2000. Sodium transport in plant cells. Biochim Biophys Acta-Biomembr, 1465(1/2): 140-151. |
| [5] | Botella C, Jouhet J, Block M A. 2017. Importance of phosphatidylcholine on the chloroplast surface. Prog Lipid Res, 65: 12-23. |
| [6] | Chanda B, Xia Y, Mandal M K, et al. 2011. Glycerol-3-phosphate is a critical mobile inducer of systemic immunity in plants. Nat Genet, 43: 421-427. |
| [7] | Chen H X, Li P M, Gao H Y. 2007. Alleviation of photoinhibition by calcium supplement in salt-treated Rumex leaves. Physiol Plant, 129(2): 386-396. |
| [8] | Dettmer J, Ursache R, Campilho A, et al. 2014. CHOLINE TRANSPORTER-LIKE1 is required for sieve plate development to mediate long-distance cell-to-cell communication. Nat Commun, 5: 4276. |
| [9] | Doblas V G, Geldner N, Barberon M. 2017. The endodermis, a tightly controlled barrier for nutrients. Curr Opin Plant Biol, 39: 136-143. |
| [10] | Fu S N, Yang L, Li P, et al. 2011. Aberrant lipid metabolism disrupts calcium homeostasis causing liver endoplasmic reticulum stress in obesity. Nature, 473: 528-531. |
| [11] | Garciadeblás B, Senn M E, Bañuelos M A, et al. 2003. Sodium transport and HKT transporters: The rice model. Plant J, 34(6): 788-801. |
| [12] | Guo R, Yang Z Z, Li F, et al. 2015. Comparative metabolic responses and adaptive strategies of wheat (Triticum aestivum) to salt and alkali stress. BMC Plant Biol, 15: 170. |
| [13] | Hasegawa P M, Bressan R A, Zhu J K, et al. 2000. Plant cellular and molecular responses to high salinity. Annu Rev Plant Physiol Plant Mol Biol, 51: 463-499. |
| [14] | Hong Y Y, Zhao J, Guo L, et al. 2016. Plant phospholipases D and C and their diverse functions in stress responses. Prog Lipid Res, 62: 55-74. |
| [15] | Hu M J, Zhao H M, Yang B, et al. 2021. ZmCTLP1 is required for the maintenance of lipid homeostasis and the basal endosperm transfer layer in maize kernels. New Phytol, 232(6): 2384-2399. |
| [16] | Huang S B, Spielmeyer W, Lagudah E S, et al. 2008. Comparative mapping of HKT genes in wheat, barley, and rice, key determinants of Na+ transport, and salt tolerance. J Exp Bot, 59(4): 927-937. |
| [17] | Jiang Z H, Zhou X P, Tao M, et al. 2019. Plant cell-surface GIPC sphingolipids sense salt to trigger Ca2+ influx. Nature, 572: 341-346. |
| [18] | Kachroo P, Kachroo A. 2020. Lipid-modulated trafficking in plants. Mol Plant, 13(3): 351-353. |
| [19] | Katz-Brull R, Koudinov A R, Degani H. 2002. Choline in the aging brain. Brain Res, 951(2): 158-165. |
| [20] | Kester M, Simonson M S, Mené P, et al. 1989. Interleukin-1 generates transmembrane signals from phospholipids through novel pathways in cultured rat mesangial cells. J Clin Invest, 83(2): 718-723. |
| [21] | Lin C C, Kao C H. 2001. Relative importance of Na+, Cl-, and abscisic acid in NaCl induced inhibition of root growth of rice seedlings. Plant Soil, 237(1): 165-171. |
| [22] | Lin Y C, Kanehara K, Nakamura Y. 2019. Arabidopsis CHOLINE/ ETHANOLAMINE KINASE 1 (CEK1) is a primary choline kinase localized at the endoplasmic reticulum (ER) and involved in ER stress tolerance. New Phytol, 223(4): 1904-1917. |
| [23] | Liu X X, Ma D K, Zhang Z Y, et al. 2019. Plant lipid remodeling in response to abiotic stresses. Environ Exp Bot, 165: 174-184. |
| [24] | Livak K J, Schmittgen T D. 2001. Analysis of relative gene expression data using real-time quantitative PCR and the 2-ΔΔCT method. Methods, 25(4): 402-408. |
| [25] | Martínez-Atienza J, Jiang X Y, Garciadeblas B, et al. 2007. Conservation of the salt overly sensitive pathway in rice. Plant Physiol, 143(2): 1001-1012. |
| [26] | Martinière A, Shvedunova M, Thomson A J W, et al. 2011. Homeostasis of plasma membrane viscosity in fluctuating temperatures. New Phytol, 192(2): 328-337. |
| [27] | Michaelson L V, Napier J A, Molino D, et al. 2016. Plant sphingolipids: Their importance in cellular organization and adaption. Biochim Biophys Acta, 1861: 1329-1335. |
| [28] | Michel V, Bakovic M. 2009. The solute carrier 44A1 is a mitochondrial protein and mediates choline transport. FASEB J, 23(8): 2749-2758. |
| [29] | Mittler R. 2002. Oxidative stress, antioxidants and stress tolerance. Trends Plant Sci, 7(9): 405-410. |
| [30] | Mittler R, Vanderauwera S, Gollery M, et al. 2004. Reactive oxygen gene network of plants. Trends Plant Sci, 9(10): 490-498. |
| [31] | Moon S, Kim Y J, Park H E, et al. 2022. OsSNDP3 functions for the polar tip growth in rice pollen together with OsSNDP2, a paralog of OsSNDP3. Rice, 15( 1): 39. |
| [32] | Moradi P, Mahdavi A, Khoshkam M, et al. 2017. Lipidomics unravels the role of leaf lipids in thyme plant response to drought stress. Int J Mol Sci, 18(10): 2067. |
| [33] | Munné-Bosch S, Alegre L. 2002. Interplay between ascorbic acid and lipophilic antioxidant defences in chloroplasts of water- stressed Arabidopsis plants. FEBS Lett, 524: 145-148. |
| [34] | Murphy M P, Holmgren A, Larsson N G, et al. 2011. Unraveling the biological roles of reactive oxygen species. Cell Metab, 13(4): 361-366. |
| [35] | Nakamura T, Fujiwara R, Ishiguro N, et al. 2010. Involvement of choline transporter-like proteins, CTL1 and CTL2, in glucocorticoid- induced acceleration of phosphatidylcholine synthesis via increased choline uptake. Biol Pharm Bull, 33(4): 691-696. |
| [36] | Niewiadomska E, Karpinska B, Romanowska E, et al. 2004. A salinity-induced C3-CAM transition increases energy conservation in the halophyte Mesembryanthemum crystallinum L. Plant Cell Physiol, 45(6): 789-794. |
| [37] | Niu Y, Xiang Y. 2018. An overview of biomembrane functions in plant responses to high-temperature stress. Front Plant Sci, 9: 915. |
| [38] | Qiao K, Wang M, Takano T, et al. 2018. Overexpression of Acyl- CoA-binding protein 1 (ChACBP1) from saline-alkali-tolerant Chlorella sp. enhances stress tolerance in Arabidopsis. Front Plant Sci, 9: 1772. |
| [39] | Shehab G G, Ahmed O K, El-Beltagi H S. 2010. Effects of various chemical agents for alleviation of drought stress in rice plants (Oryza sativa L.). Not Bot Horti Agrobot Cluj-Na, 38(1): 139-148. |
| [40] | Silveira J A G, Viégas R D A, da Rocha I M, et al. 2003. Proline accumulation and glutamine synthetase activity are increased by salt-induced proteolysis in cashew leaves. J Plant Physiol, 160(2): 115-123. |
| [41] | Sofo A, Scopa A, Nuzzaci M, et al. 2015. Ascorbate peroxidase and catalase activities and their genetic regulation in plants subjected to drought and salinity stresses. Int J Mol Sci, 16(6): 13561-13578. |
| [42] | Testerink C, Munnik T. 2005. Phosphatidic acid: A multifunctional stress signaling lipid in plants. Trends Plant Sci, 10(8): 368-375. |
| [43] | Toyooka K, Goto Y, Asatsuma S, et al. 2009. A mobile secretory vesicle cluster involved in mass transport from the Golgi to the plant cell exterior. Plant Cell, 21(4): 1212-1229. |
| [44] | Tuteja N. 2007. Mechanisms of high salinity tolerance in plants. Methods Enzymol, 428: 419-438. |
| [45] | Ueland P M. 2011. Choline and betaine in health and disease. J Inherit Metab Dis, 34(1): 3-15. |
| [46] | van Zelm E, Zhang Y X, Testerink C. 2020. Salt tolerance mechanisms of plants. Annu Rev Plant Biol, 71(1): 403-433. |
| [47] | Wang H, Zhang M S, Guo R, et al. 2012. Effects of salt stress on ion balance and nitrogen metabolism of old and young leaves in rice (Oryza sativa L.). BMC Plant Biol, 12: 194. |
| [48] | Wang J, Nan N, Li N, et al. 2020. A DNA methylation reader- chaperone regulator-transcription factor complex activates OsHKT1;5 expression during salinity stress. Plant Cell, 32(11): 3535-3558. |
| [49] | Wang S M, Wan C G, Wang Y R, et al. 2004. The characteristics of Na+, K+ and free proline distribution in several drought-resistant plants of the Alxa Desert, China. J Arid Environ, 56(3): 525-539. |
| [50] | Wang X M. 2005. Regulatory functions of phospholipase D and phosphatidic acid in plant growth, development, and stress responses. Plant Physiol, 139(2): 566-573. |
| [51] | Wang Y H, Zhang L R, Zhang L L, et al. 2013. A novel stress- associated protein SbSAP14 from Sorghum bicolor confers tolerance to salt stress in transgenic rice. Mol Breed, 32(2): 437-449. |
| [52] | Wang Y J, Zhang X Y, Huang G R, et al. 2020. Dynamic changes in membrane lipid composition of leaves of winter wheat seedlings in response to PEG-induced water stress. BMC Plant Biol, 20(1): 84. |
| [53] | Xu X X, Zhang J J, Yan B W, et al. 2021. The adjustment of membrane lipid metabolism pathways in maize roots under saline-alkaline stress. Front Plant Sci, 12: 635327. |
| [54] | Yamauchi Y, Furutera A, Seki K, et al. 2008. Malondialdehyde generated from peroxidized linolenic acid causes protein modification in heat-stressed plants. Plant Physiol Biochem, 46(8/9): 786-793. |
| [55] | Yu L J, Nie J N, Cao C Y, et al. 2010. Phosphatidic acid mediates salt stress response by regulation of MPK6 in Arabidopsis thaliana. New Phytol, 188(3): 762-773. |
| [56] | Yu Y C, Wang A M, Li X, et al. 2018. Melatonin-stimulated triacylglycerol breakdown and energy turnover under salinity stress contributes to the maintenance of plasma membrane H+-ATPase activity and K+/Na+ homeostasis in sweet potato. Front Plant Sci, 9: 256. |
| [57] | Zhang Q, Liu Y Q, Jiang Y L, et al. 2022. OsASR6 enhances salt stress tolerance in rice. Int J Mol Sci, 23(16): 9340. |
| [58] | Zhu J K. 2016. Abiotic stress signaling and responses in plants. Cell, 167(2): 313-324. |
| No related articles found! |
| 阅读次数 | ||||||
|
全文 |
|
|||||
|
摘要 |
|
|||||