Rice Science ›› 2025, Vol. 32 ›› Issue (2): 228-242.DOI: 10.1016/j.rsci.2025.03.006
收稿日期:2024-05-16
接受日期:2024-11-29
出版日期:2025-03-28
发布日期:2025-04-14
. [J]. Rice Science, 2025, 32(2): 228-242.
| Rice landrace | Treatment | Cytological attribute | |||
|---|---|---|---|---|---|
| Total cell examined | No. of mitosis cell | Mitotic index (%) | Relative division rate (%) | ||
| Benapol | Control | 2 779 | 200 | 7.197 ± 0.572 | |
| 200 mmol/L NaCl | 2 751 | 143 | 5.144 ± 0.515** | -28.526 | |
| Charobalam | Control | 2 835 | 211 | 7.443 ± 0.569 | |
| 200 mmol/L NaCl | 2 759 | 105 | 3.806 ± 0.513** | -48.865 | |
| Jotaibalam | Control | 2 789 | 195 | 6.992 ± 0.490 | |
| 200 mmol/L NaCl | 2 319 | 92 | 3.967 ± 0.599** | -43.267 | |
| Kachra | Control | 2 821 | 218 | 7.728 ± 0.567 | |
| 200 mmol/L NaCl | 2 909 | 108 | 3.713 ± 0.502** | -51.954 | |
| Kajolshail | Control | 2 961 | 238 | 8.038 ± 0.571 | |
| 200 mmol/L NaCl | 2 936 | 151 | 5.143 ± 0.511** | -36.016 | |
| Kutepatnai | Control | 2 804 | 240 | 8.559 ± 0.569 | |
| 200 mmol/L NaCl | 2 853 | 211 | 7.396 ± 0.512* | -13.588 | |
| Lalmota | Control | 2 993 | 215 | 7.183 ± 0.570 | |
| 200 mmol/L NaCl | 2 999 | 114 | 3.800 ± 0.531** | -47.097 | |
| Nonakochi | Control | 2 947 | 209 | 7.098 ± 0.578 | |
| 200 mmol/L NaCl | 2 996 | 164 | 5.438 ± 0.512* | -23.387 | |
| Rajashail | Control | 2 966 | 225 | 7.586 ± 0.567 | |
| 200 mmol/L NaCl | 2 922 | 128 | 4.381 ± 0.509** | -42.249 | |
| Talmugur | Control | 2 988 | 235 | 7.865 ± 0.566 | |
| 200 mmol/L NaCl | 2 937 | 189 | 6.448 ± 0.512* | -18.017 | |
Table 1. Cytological attributes in the root tip of 10 rice landrace seedlings from Bangladesh, grown under post-imbibitional salinity stress for 7 d.
| Rice landrace | Treatment | Cytological attribute | |||
|---|---|---|---|---|---|
| Total cell examined | No. of mitosis cell | Mitotic index (%) | Relative division rate (%) | ||
| Benapol | Control | 2 779 | 200 | 7.197 ± 0.572 | |
| 200 mmol/L NaCl | 2 751 | 143 | 5.144 ± 0.515** | -28.526 | |
| Charobalam | Control | 2 835 | 211 | 7.443 ± 0.569 | |
| 200 mmol/L NaCl | 2 759 | 105 | 3.806 ± 0.513** | -48.865 | |
| Jotaibalam | Control | 2 789 | 195 | 6.992 ± 0.490 | |
| 200 mmol/L NaCl | 2 319 | 92 | 3.967 ± 0.599** | -43.267 | |
| Kachra | Control | 2 821 | 218 | 7.728 ± 0.567 | |
| 200 mmol/L NaCl | 2 909 | 108 | 3.713 ± 0.502** | -51.954 | |
| Kajolshail | Control | 2 961 | 238 | 8.038 ± 0.571 | |
| 200 mmol/L NaCl | 2 936 | 151 | 5.143 ± 0.511** | -36.016 | |
| Kutepatnai | Control | 2 804 | 240 | 8.559 ± 0.569 | |
| 200 mmol/L NaCl | 2 853 | 211 | 7.396 ± 0.512* | -13.588 | |
| Lalmota | Control | 2 993 | 215 | 7.183 ± 0.570 | |
| 200 mmol/L NaCl | 2 999 | 114 | 3.800 ± 0.531** | -47.097 | |
| Nonakochi | Control | 2 947 | 209 | 7.098 ± 0.578 | |
| 200 mmol/L NaCl | 2 996 | 164 | 5.438 ± 0.512* | -23.387 | |
| Rajashail | Control | 2 966 | 225 | 7.586 ± 0.567 | |
| 200 mmol/L NaCl | 2 922 | 128 | 4.381 ± 0.509** | -42.249 | |
| Talmugur | Control | 2 988 | 235 | 7.865 ± 0.566 | |
| 200 mmol/L NaCl | 2 937 | 189 | 6.448 ± 0.512* | -18.017 | |
| Rice landrace | Treatment | Total cell examined | Different types of mitotic abnormality (%) | FTMA (%) | |||||
|---|---|---|---|---|---|---|---|---|---|
| Stickiness | Laggard | Fragment | Bridge | Micronucleus | Ring chromosome | ||||
| Benapol | Control | 2 779 | 0.036 | 0.000 | 0.000 | 0.036 | 0.000 | 0.000 | 0.072 ± 0.006 g |
| 200 mmol/L NaCl | 2 751 | 0.074 | 0.147 | 0.110 | 0.147 | 0.037 | 0.000 | 0.516 ± 0.049 de | |
| Charobalam | Control | 2 835 | 0.000 | 0.000 | 0.000 | 0.000 | 0.000 | 0.000 | 0.000 ± 0.000 g |
| 200 mmol/L NaCl | 2 759 | 0.109 | 0.145 | 0.326 | 0.326 | 0.109 | 0.109 | 1.124 ± 0.045 a | |
| Jotaibalam | Control | 2 789 | 0.000 | 0.036 | 0.000 | 0.000 | 0.000 | 0.000 | 0.036 ± 0.004 g |
| 200 mmol/L NaCl | 2 319 | 0.147 | 0.220 | 0.220 | 0.294 | 0.037 | 0.037 | 0.955 ± 0.046 b | |
| Kachra | Control | 2 821 | 0.000 | 0.000 | 0.035 | 0.000 | 0.000 | 0.000 | 0.035 ± 0.004 g |
| 200 mmol/L NaCl | 2 909 | 0.138 | 0.103 | 0.241 | 0.241 | 0.069 | 0.138 | 0.928 ± 0.052 b | |
| Kajolshail | Control | 2 961 | 0.000 | 0.034 | 0.000 | 0.034 | 0.000 | 0.000 | 0.068 ± 0.005 g |
| 200 mmol/L NaCl | 2 936 | 0.068 | 0.102 | 0.170 | 0.204 | 0.034 | 0.034 | 0.613 ± 0.050 d | |
| Kutepatnai | Control | 2 804 | 0.000 | 0.000 | 0.000 | 0.000 | 0.000 | 0.000 | 0.000 ± 0.000 g |
| 200 mmol/L NaCl | 2 853 | 0.035 | 0.105 | 0.070 | 0.070 | 0.070 | 0.000 | 0.351 ± 0.052 f | |
| Lalmota | Control | 2 993 | 0.033 | 0.000 | 0.000 | 0.000 | 0.000 | 0.000 | 0.033 ± 0.021 g |
| 200 mmol/L NaCl | 2 999 | 0.272 | 0.168 | 0.168 | 0.134 | 0.068 | 0.102 | 0.912 ± 0.052 b | |
| Nonakochi | Control | 2 947 | 0.000 | 0.000 | 0.035 | 0.000 | 0.000 | 0.000 | 0.035 ± 0.005 g |
| 200 mmol/L NaCl | 2 996 | 0.034 | 0.138 | 0.172 | 0.138 | 0.000 | 0.000 | 0.482 ± 0.046 e | |
| Rajashail | Control | 2 966 | 0.000 | 0.000 | 0.000 | 0.034 | 0.000 | 0.000 | 0.034 ± 0.006 g |
| 200 mmol/L NaCl | 2 922 | 0.103 | 0.137 | 0.205 | 0.137 | 0.103 | 0.068 | 0.753 ± 0.045 c | |
| Talmugur | Control | 2 988 | 0.000 | 0.000 | 0.000 | 0.000 | 0.000 | 0.000 | 0.000 ± 0.000 ef |
| 200 mmol/L NaCl | 2 937 | 0.068 | 0.110 | 0.136 | 0.068 | 0.034 | 0.000 | 0.416 ± 0.053 g | |
Table 2. Different types of chromosomal abnormalities and frequency of total abnormalities (FTMAs) in root tips of 10 rice landrace seedlings from Bangladesh, grown under post-imbibitional salinity stress for 7 d.
| Rice landrace | Treatment | Total cell examined | Different types of mitotic abnormality (%) | FTMA (%) | |||||
|---|---|---|---|---|---|---|---|---|---|
| Stickiness | Laggard | Fragment | Bridge | Micronucleus | Ring chromosome | ||||
| Benapol | Control | 2 779 | 0.036 | 0.000 | 0.000 | 0.036 | 0.000 | 0.000 | 0.072 ± 0.006 g |
| 200 mmol/L NaCl | 2 751 | 0.074 | 0.147 | 0.110 | 0.147 | 0.037 | 0.000 | 0.516 ± 0.049 de | |
| Charobalam | Control | 2 835 | 0.000 | 0.000 | 0.000 | 0.000 | 0.000 | 0.000 | 0.000 ± 0.000 g |
| 200 mmol/L NaCl | 2 759 | 0.109 | 0.145 | 0.326 | 0.326 | 0.109 | 0.109 | 1.124 ± 0.045 a | |
| Jotaibalam | Control | 2 789 | 0.000 | 0.036 | 0.000 | 0.000 | 0.000 | 0.000 | 0.036 ± 0.004 g |
| 200 mmol/L NaCl | 2 319 | 0.147 | 0.220 | 0.220 | 0.294 | 0.037 | 0.037 | 0.955 ± 0.046 b | |
| Kachra | Control | 2 821 | 0.000 | 0.000 | 0.035 | 0.000 | 0.000 | 0.000 | 0.035 ± 0.004 g |
| 200 mmol/L NaCl | 2 909 | 0.138 | 0.103 | 0.241 | 0.241 | 0.069 | 0.138 | 0.928 ± 0.052 b | |
| Kajolshail | Control | 2 961 | 0.000 | 0.034 | 0.000 | 0.034 | 0.000 | 0.000 | 0.068 ± 0.005 g |
| 200 mmol/L NaCl | 2 936 | 0.068 | 0.102 | 0.170 | 0.204 | 0.034 | 0.034 | 0.613 ± 0.050 d | |
| Kutepatnai | Control | 2 804 | 0.000 | 0.000 | 0.000 | 0.000 | 0.000 | 0.000 | 0.000 ± 0.000 g |
| 200 mmol/L NaCl | 2 853 | 0.035 | 0.105 | 0.070 | 0.070 | 0.070 | 0.000 | 0.351 ± 0.052 f | |
| Lalmota | Control | 2 993 | 0.033 | 0.000 | 0.000 | 0.000 | 0.000 | 0.000 | 0.033 ± 0.021 g |
| 200 mmol/L NaCl | 2 999 | 0.272 | 0.168 | 0.168 | 0.134 | 0.068 | 0.102 | 0.912 ± 0.052 b | |
| Nonakochi | Control | 2 947 | 0.000 | 0.000 | 0.035 | 0.000 | 0.000 | 0.000 | 0.035 ± 0.005 g |
| 200 mmol/L NaCl | 2 996 | 0.034 | 0.138 | 0.172 | 0.138 | 0.000 | 0.000 | 0.482 ± 0.046 e | |
| Rajashail | Control | 2 966 | 0.000 | 0.000 | 0.000 | 0.034 | 0.000 | 0.000 | 0.034 ± 0.006 g |
| 200 mmol/L NaCl | 2 922 | 0.103 | 0.137 | 0.205 | 0.137 | 0.103 | 0.068 | 0.753 ± 0.045 c | |
| Talmugur | Control | 2 988 | 0.000 | 0.000 | 0.000 | 0.000 | 0.000 | 0.000 | 0.000 ± 0.000 ef |
| 200 mmol/L NaCl | 2 937 | 0.068 | 0.110 | 0.136 | 0.068 | 0.034 | 0.000 | 0.416 ± 0.053 g | |
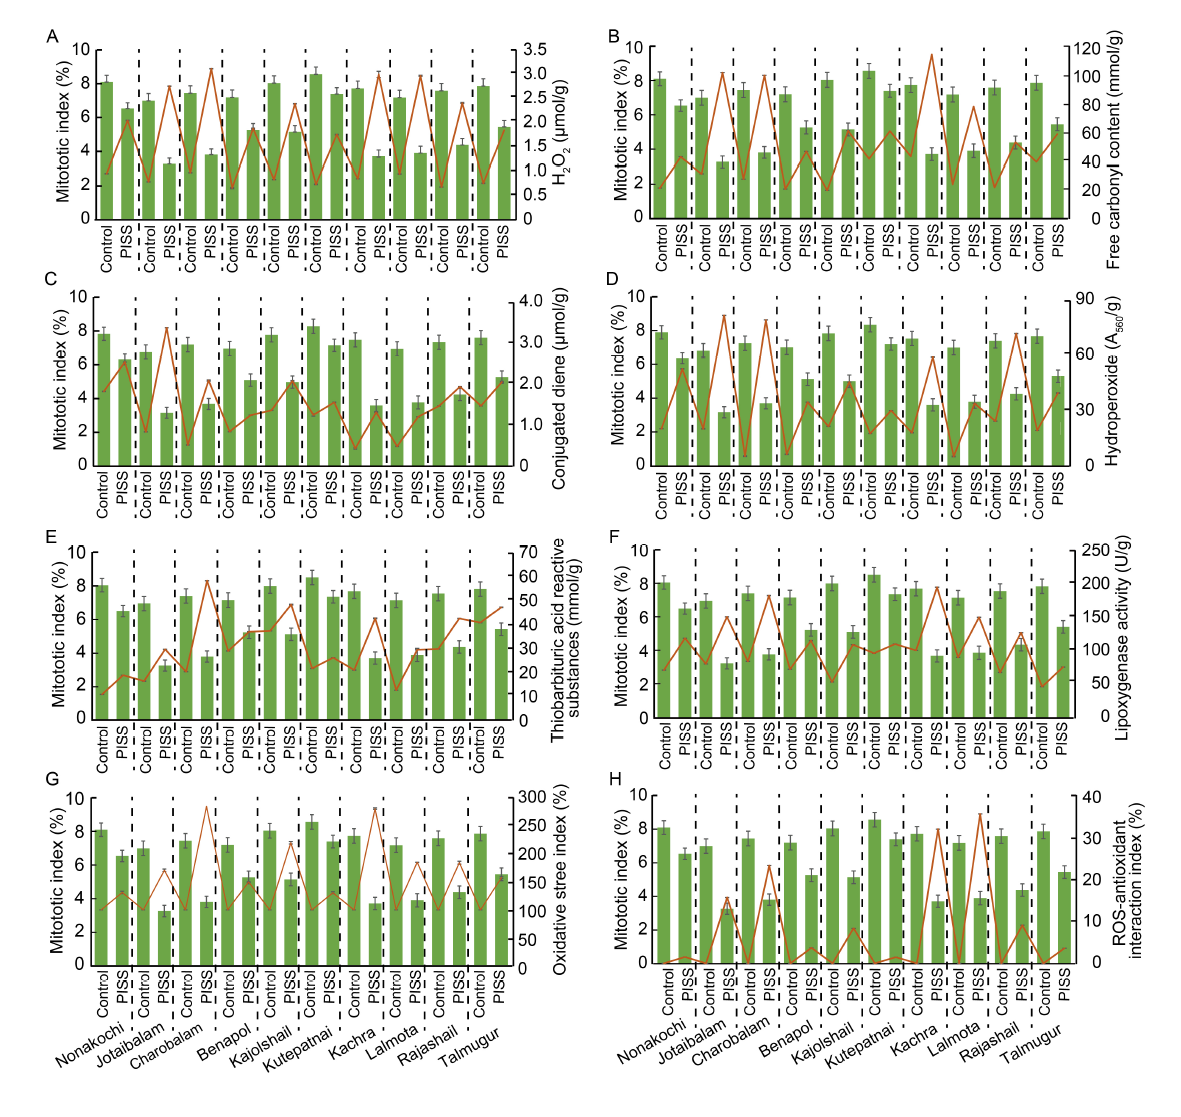
Fig. 1. Correlative evaluation of salinity induced changes in mitotic index with different redox attributes and contents of protein oxidation and lipid peroxidation products in 10 rice landrace seedlings from Bangladesh, under post-imbibitional salinity stress (PISS, 200 mmol/L NaCl) for 7 d. Data are Mean ± SE (n = 3).
| Rice landrace | Treatment | Cytological attribute | Activity of ascorbate-glutathione pathway enzymes | |||
|---|---|---|---|---|---|---|
| MI (%) | FTMA (%) | APOX (U/g) | GR (U/g) | |||
| Benapol | Control | 7.197 ± 0.572 | 0.072 ± 0.006 | 11.874 ± 0.001 | 0.015 ± 0.001 | |
| 200 mmol/L NaCl | 5.514 ± 0.515** | 0.516 ± 0.049 | 7.427 ± 0.001** | 0.075 ± 0.001 | ||
| Charobalam | Control | 7.443 ± 0.569 | 0.000 ± 0.000 | 130.235 ± 0.014 | 0.111 ± 0.001 | |
| 200 mmol/L NaCl | 3.806 ± 0.513** | 1.124 ± 0.045* | 139.259 ± 0.021** | 0.085 ± 0.001 | ||
| Jotaibalam | Control | 6.992 ± 0.490 | 0.036 ± 0.004 | 39.201 ± 0.017 | 0.138 ± 0.002 | |
| 200 mmol/L NaCl | 3.967 ± 0.599** | 0.955 ± 0.046 * | 17.619 ± 0.017** | 0.095 ± 0.001 | ||
| Kachra | Control | 7.728 ± 0.567 | 0.035 ± 0.004 | 34.193 ± 0.002 | 0.095 ± 0.001 | |
| 200 mmol/L NaCl | 3.713 ± 0.502** | 0.928 ± 0.052* | 37.210 ± 0.001** | 0.091 ± 0.002 | ||
| Kajolshail | Control | 8.038 ± 0.571 | 0.068 ± 0.005 | 117.661 ± 0.029 | 0.069 ± 0.001 | |
| 200 mmol/L NaCl | 5.143 ± 0.511** | 0.613 ± 0.050 | 120.410 ± 0.003* | 0.055 ± 0.001* | ||
| Kutepatnai | Control | 8.559 ± 0.569 | 0.000 ± 0.000 | 9.154 ± 0.008 | 0.137 ± 0.002 | |
| 200 mmol/L NaCl | 7.396 ± 0.512* | 0.351 ± 0.052 | 73.963 ± 0.006** | 0.183 ± 0.001* | ||
| Lalmota | Control | 7.183 ± 0.570 | 0.033 ± 0.021 | 24.456 ± 0.002 | 0.058 ± 0.001 | |
| 200 mmol/L NaCl | 3.800 ± 0.531** | 0.912 ± 0.052* | 21.457 ± 0.001** | 0.031 ± 0.001** | ||
| Nonakochi | Control | 7.098 ± 0.578 | 0.035 ± 0.005 | 18.650 ± 0.012 | 0.064 ± 0.001 | |
| 200 mmol/L NaCl | 5.438 ± 0.512* | 0.483 ± 0.046 | 12.170 ± 0.004** | 0.069 ± 0.001* | ||
| Rajashail | Control | 7.586 ± 0.567 | 0.034 ± 0.006 | 12.357 ± 0.001 | 0.038 ± 0.001 | |
| 200 mmol/L NaCl | 4.381 ± 0.509** | 0.753 ± 0.045 | 7.626 ± 0.001** | 0.026 ± 0.001 | ||
| Talmugur | Control | 7.865 ± 0.566 | 0.000 ± 0.000 | 43.212 ± 0.003 | 0.057 ± 0.001 | |
| 200 mmol/L NaCl | 6.448 ± 0.512* | 0.417 ± 0.053 | 112.261 ± 0.001** | 0.136 ± 0.001** | ||
Table 3. Changes of cytological attributes and activities of ascorbate-glutathione pathway enzymes under NaCl salinity stress.
| Rice landrace | Treatment | Cytological attribute | Activity of ascorbate-glutathione pathway enzymes | |||
|---|---|---|---|---|---|---|
| MI (%) | FTMA (%) | APOX (U/g) | GR (U/g) | |||
| Benapol | Control | 7.197 ± 0.572 | 0.072 ± 0.006 | 11.874 ± 0.001 | 0.015 ± 0.001 | |
| 200 mmol/L NaCl | 5.514 ± 0.515** | 0.516 ± 0.049 | 7.427 ± 0.001** | 0.075 ± 0.001 | ||
| Charobalam | Control | 7.443 ± 0.569 | 0.000 ± 0.000 | 130.235 ± 0.014 | 0.111 ± 0.001 | |
| 200 mmol/L NaCl | 3.806 ± 0.513** | 1.124 ± 0.045* | 139.259 ± 0.021** | 0.085 ± 0.001 | ||
| Jotaibalam | Control | 6.992 ± 0.490 | 0.036 ± 0.004 | 39.201 ± 0.017 | 0.138 ± 0.002 | |
| 200 mmol/L NaCl | 3.967 ± 0.599** | 0.955 ± 0.046 * | 17.619 ± 0.017** | 0.095 ± 0.001 | ||
| Kachra | Control | 7.728 ± 0.567 | 0.035 ± 0.004 | 34.193 ± 0.002 | 0.095 ± 0.001 | |
| 200 mmol/L NaCl | 3.713 ± 0.502** | 0.928 ± 0.052* | 37.210 ± 0.001** | 0.091 ± 0.002 | ||
| Kajolshail | Control | 8.038 ± 0.571 | 0.068 ± 0.005 | 117.661 ± 0.029 | 0.069 ± 0.001 | |
| 200 mmol/L NaCl | 5.143 ± 0.511** | 0.613 ± 0.050 | 120.410 ± 0.003* | 0.055 ± 0.001* | ||
| Kutepatnai | Control | 8.559 ± 0.569 | 0.000 ± 0.000 | 9.154 ± 0.008 | 0.137 ± 0.002 | |
| 200 mmol/L NaCl | 7.396 ± 0.512* | 0.351 ± 0.052 | 73.963 ± 0.006** | 0.183 ± 0.001* | ||
| Lalmota | Control | 7.183 ± 0.570 | 0.033 ± 0.021 | 24.456 ± 0.002 | 0.058 ± 0.001 | |
| 200 mmol/L NaCl | 3.800 ± 0.531** | 0.912 ± 0.052* | 21.457 ± 0.001** | 0.031 ± 0.001** | ||
| Nonakochi | Control | 7.098 ± 0.578 | 0.035 ± 0.005 | 18.650 ± 0.012 | 0.064 ± 0.001 | |
| 200 mmol/L NaCl | 5.438 ± 0.512* | 0.483 ± 0.046 | 12.170 ± 0.004** | 0.069 ± 0.001* | ||
| Rajashail | Control | 7.586 ± 0.567 | 0.034 ± 0.006 | 12.357 ± 0.001 | 0.038 ± 0.001 | |
| 200 mmol/L NaCl | 4.381 ± 0.509** | 0.753 ± 0.045 | 7.626 ± 0.001** | 0.026 ± 0.001 | ||
| Talmugur | Control | 7.865 ± 0.566 | 0.000 ± 0.000 | 43.212 ± 0.003 | 0.057 ± 0.001 | |
| 200 mmol/L NaCl | 6.448 ± 0.512* | 0.417 ± 0.053 | 112.261 ± 0.001** | 0.136 ± 0.001** | ||
| Rice landrace | Treatment | Redox behavior | Cytological behavior | |||
|---|---|---|---|---|---|---|
| Accumulation of O2·̄ (Δ540/g) | Total ROS (AU/mg) | MI (%) | FTMA (%) | |||
| Benapol | Control | 1.50 ± 0.04 | 248.959 ± 0.074 | 7.197 ± 0.572 | 0.072 ± 0.006 | |
| 200 mmol/L NaCl | 2.12 ± 0.07** | 372.424 ± 0.170** | 5.144 ± 0.515** | 0.516 ± 0.049 | ||
| Charobalam | Control | 1.40 ± 0.03 | 137.275 ± 0.152 | 7.443 ± 0.569 | 0.000 ±0.000 | |
| 200 mmol/L NaCl | 2.98 ± 0.03** | 390.296 ± 0.091** | 3.806 ± 0.513** | 1.124 ± 0.045* | ||
| Jotaibalam | Control | 1.05 ± 0.05 | 230.304 ± 0.212 | 6.992 ± 0.490 | 0.036 ± 0.004 | |
| 200 mmol/L NaCl | 2.78 ± 0.04** | 393.017 ± 0.116** | 3.967 ± 0.599** | 0.955 ± 0.046* | ||
| Kachra | Control | 1.45 ± 0.03 | 230.304 ± 0.212 | 6.992 ± 0.490 | 0.036 ± 0.004 | |
| 200 mmol/L NaCl | 3.43 ± 0.05* | 393.017 ± 0.116** | 3.967 ± 0.599** | 0.955 ± 0.046* | ||
| Kajolshail | Control | 1.30 ± 0.04 | 111.523 ± 0.048 | 8.038 ± 0.571 | 0.068 ± 0.005 | |
| 200 mmol/L NaCl | 2.45 ± 0.05** | 245.313 ± 0.186** | 5.143 ± 0.511** | 0.613 ± 0.050 | ||
| Kutepatnai | Control | 1.38 ± 0.07 | 129.036 ± 0.078 | 7.098 ± 0.578 | 0.035 ± 0.005 | |
| 200 mmol/L NaCl | 1.50 ± 0.02** | 168.931 ± 0.091** | 5.438 ± 0.512* | 0.483 ± 0.046 | ||
| Lalmota | Control | 1.70 ± 0.06 | 137.275 ± 0.152 | 7.443 ± 0.569 | 0.000 ± 0.000 | |
| 200 mmol/L NaCl | 2.43 ± 0.05** | 390.296 ± 0.091** | 3.806 ± 0.513** | 1.124 ± 0.045* | ||
| Nonakochi | Control | 1.23 ± 0.07 | 129.036 ± 0.078 | 7.098 ± 0.578 | 0.035 ± 0.005 | |
| 200 mmol/L NaCl | 1.47 ± 0.09* | 168.931 ± 0.091** | 5.438 ± 0.512* | 0.483 ± 0.046 | ||
| Rajashail | Control | 1.56 ± 0.06 | 248.959 ± 0.074 | 7.197 ± 0.572 | 0.072 ± 0.006 | |
| 200 mmol/L NaCl | 2.30 ± 0.01** | 372.424 ± 0.170** | 5.144 ± 0.515** | 0.516 ± 0.049 | ||
| Talmugur | Control | 1.28 ± 0.02 | 111.523 ± 0.048 | 8.038 ± 0.571 | 0.068 ± 0.005 | |
| 200 mmol/L NaCl | 2.20 ± 0.07* | 245.313 ± 0.186** | 5.143 ± 0.511** | 0.613 ± 0.050 | ||
Table 4. Changes of redox behavior and cytological behavior under NaCl salinity stress.
| Rice landrace | Treatment | Redox behavior | Cytological behavior | |||
|---|---|---|---|---|---|---|
| Accumulation of O2·̄ (Δ540/g) | Total ROS (AU/mg) | MI (%) | FTMA (%) | |||
| Benapol | Control | 1.50 ± 0.04 | 248.959 ± 0.074 | 7.197 ± 0.572 | 0.072 ± 0.006 | |
| 200 mmol/L NaCl | 2.12 ± 0.07** | 372.424 ± 0.170** | 5.144 ± 0.515** | 0.516 ± 0.049 | ||
| Charobalam | Control | 1.40 ± 0.03 | 137.275 ± 0.152 | 7.443 ± 0.569 | 0.000 ±0.000 | |
| 200 mmol/L NaCl | 2.98 ± 0.03** | 390.296 ± 0.091** | 3.806 ± 0.513** | 1.124 ± 0.045* | ||
| Jotaibalam | Control | 1.05 ± 0.05 | 230.304 ± 0.212 | 6.992 ± 0.490 | 0.036 ± 0.004 | |
| 200 mmol/L NaCl | 2.78 ± 0.04** | 393.017 ± 0.116** | 3.967 ± 0.599** | 0.955 ± 0.046* | ||
| Kachra | Control | 1.45 ± 0.03 | 230.304 ± 0.212 | 6.992 ± 0.490 | 0.036 ± 0.004 | |
| 200 mmol/L NaCl | 3.43 ± 0.05* | 393.017 ± 0.116** | 3.967 ± 0.599** | 0.955 ± 0.046* | ||
| Kajolshail | Control | 1.30 ± 0.04 | 111.523 ± 0.048 | 8.038 ± 0.571 | 0.068 ± 0.005 | |
| 200 mmol/L NaCl | 2.45 ± 0.05** | 245.313 ± 0.186** | 5.143 ± 0.511** | 0.613 ± 0.050 | ||
| Kutepatnai | Control | 1.38 ± 0.07 | 129.036 ± 0.078 | 7.098 ± 0.578 | 0.035 ± 0.005 | |
| 200 mmol/L NaCl | 1.50 ± 0.02** | 168.931 ± 0.091** | 5.438 ± 0.512* | 0.483 ± 0.046 | ||
| Lalmota | Control | 1.70 ± 0.06 | 137.275 ± 0.152 | 7.443 ± 0.569 | 0.000 ± 0.000 | |
| 200 mmol/L NaCl | 2.43 ± 0.05** | 390.296 ± 0.091** | 3.806 ± 0.513** | 1.124 ± 0.045* | ||
| Nonakochi | Control | 1.23 ± 0.07 | 129.036 ± 0.078 | 7.098 ± 0.578 | 0.035 ± 0.005 | |
| 200 mmol/L NaCl | 1.47 ± 0.09* | 168.931 ± 0.091** | 5.438 ± 0.512* | 0.483 ± 0.046 | ||
| Rajashail | Control | 1.56 ± 0.06 | 248.959 ± 0.074 | 7.197 ± 0.572 | 0.072 ± 0.006 | |
| 200 mmol/L NaCl | 2.30 ± 0.01** | 372.424 ± 0.170** | 5.144 ± 0.515** | 0.516 ± 0.049 | ||
| Talmugur | Control | 1.28 ± 0.02 | 111.523 ± 0.048 | 8.038 ± 0.571 | 0.068 ± 0.005 | |
| 200 mmol/L NaCl | 2.20 ± 0.07* | 245.313 ± 0.186** | 5.143 ± 0.511** | 0.613 ± 0.050 | ||
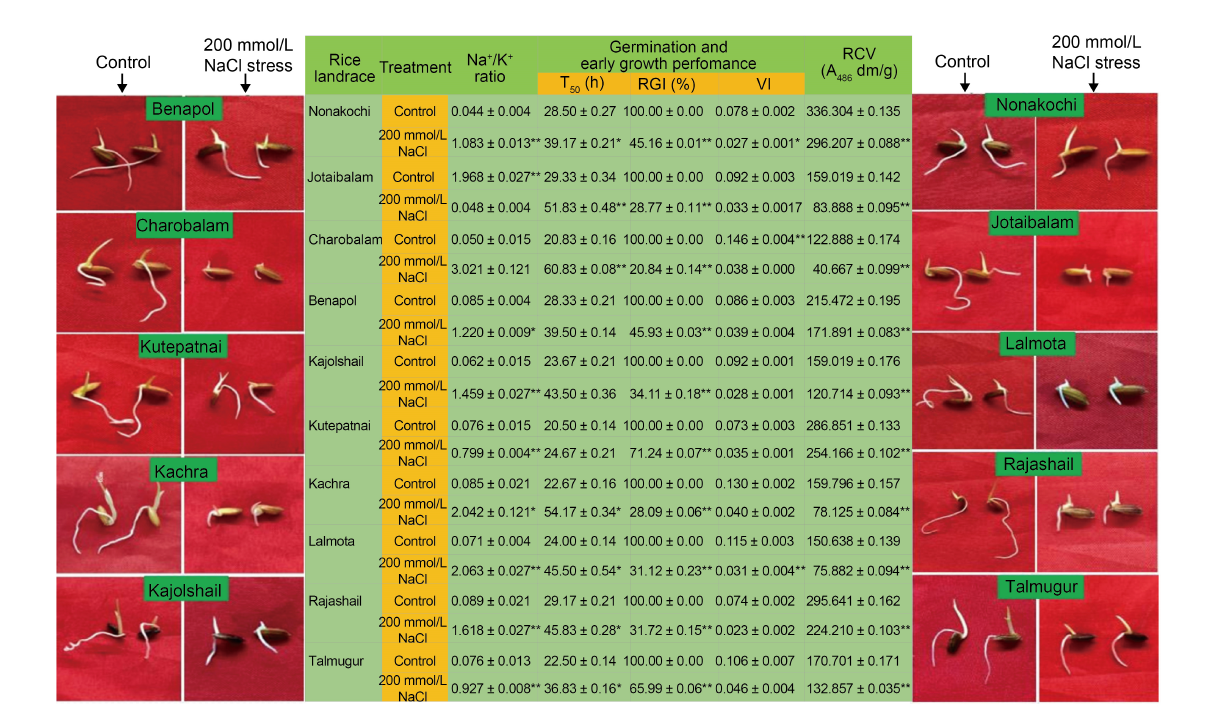
Fig. 2. Impact of post-imbibitional salinity stress-induced modulation of ion homeostasis (assessed in terms of alteration of Na+/ K+ ratio) on germination and early growth phenotypes and relative cell viability of 10 experimental rice landraces from Bangladesh. T50 is the time (h) of 50% germination of seeds sown; RGI, Relative growth index; VI, Vigor index; RCV, Relative cell viability.
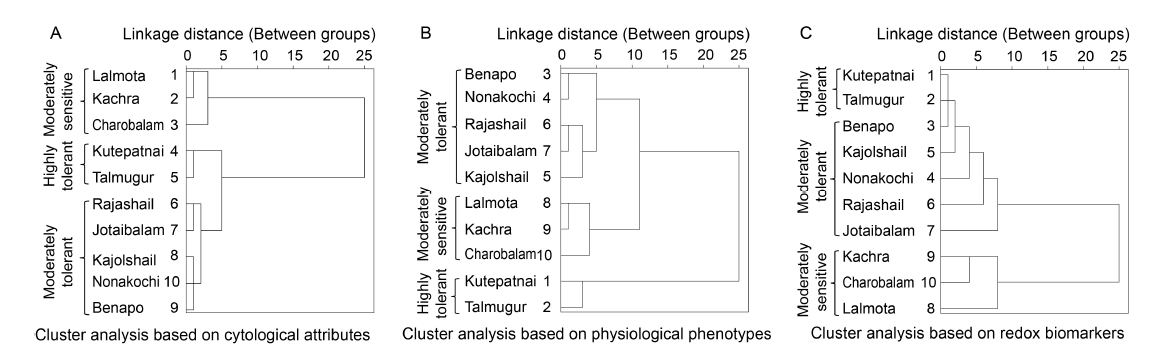
Fig. 3. Dendrogram of hierarchical cluster analysis depicting grouping of 10 rice landraces from Bangladesh.
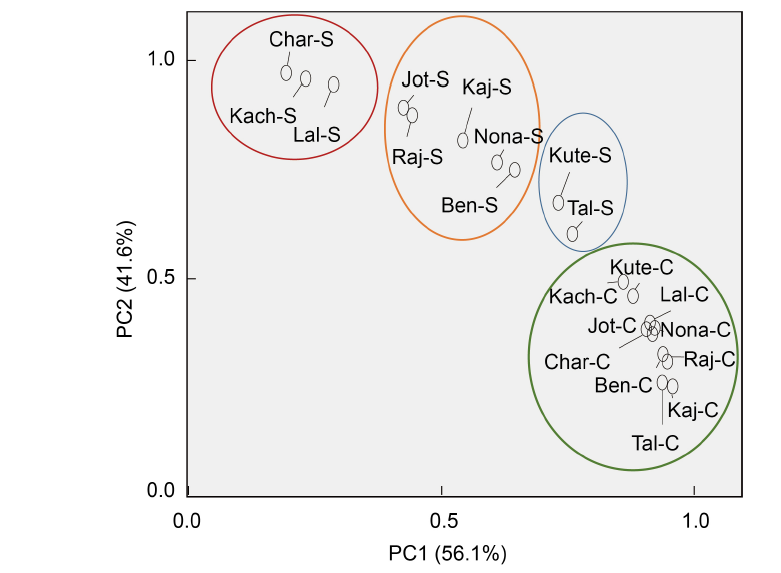
Fig. 4. Biplot showing distribution of 10 rice landraces from Bangladesh. PC1 and PC2 describe the classification of rice landraces into different salt tolerant groups based on the germination and early growth parameters, parameters of redox biomarker, and cytological attributes.Kute, Kutepatnai; Tal, Talmugur; Nona, Nonakochi; Ben, Benapol; Kaj, Kajolshail; Raj, Rajashail; Jot, Jotaibalam; Lal, Lalmota; Kach, Kachra; Char, Charobalam; C, Control; S, Salt stress.
| [1] | Ali Q, Ahmar S, Sohail M A, et al. 2021. Research advances and applications of biosensing technology for the diagnosis of pathogens in sustainable agriculture. Environ Sci Pollut Res, 28(8): 9002-9019. |
| [2] | Badr A. 1986. Effects of the s-triazine herbicide turbutryn on mitosis, chromosomes and nucleic acids in root tips of Vicia faba. Cytologia, 51(3): 571-577. |
| [3] | Baranova E N, Gulevich A A. 2021. Asymmetry of plant cell divisions under salt stress. Symmetry, 13(10): 1811. |
| [4] | Barrôco R M, Van Poucke K, Bergervoet J H W, et al. 2005. The role of the cell cycle machinery in resumption of postembryonic development. Plant Physiol, 137(1): 127-140. |
| [5] | Bhattacharjee M. 2014. Studies on mitodepressive effect of Indigocarmine. Int J Innovative Sci Eng Technol, 1: 157-160. |
| [6] | Bhattacharjee S. 2008. Calcium-dependent signaling pathway in the heat-induced oxidative injury in Amaranthus lividus. Biol Plant, 52(1): 137-140. |
| [7] | Bhattacharjee S. 2019. ROS and oxidative stress:Origin and implication. In: Reactive Oxygen Species in Plant Biology. New Delhi, India: Springer: 1-31. |
| [8] | Bose M L, Isa MA, Bayes A, et al. 2001. Impact of modern rice varieties on food security and cultivar diversity: the Bangladesh case. In: Peng S, Hardy B. Rice Research for Food Security and Poverty Alleviation. Manila, the Philippines: IRRI publication: 617-630. |
| [9] | Buege J A, Aust S D. 1978. Microsomal lipid peroxidation. Methods Enzymol, 52: 302-310. |
| [10] | Chaitanya K K, Naithani S C. 1994. Role of superoxide, lipid peroxidation and superoxide dismutase in membrane perturbation during loss of viability in seeds of Shorea robusta Gaertn. f. New Phytologist, 126(4): 623-627. |
| [11] | Chao B F, Wu Y H, Li Y S. 2008. Impact of artificial reservoir water impoundment on global sea level. Science, 320: 212-214. |
| [12] | Chen H H, Shen Z Y, Li P H. 1982. Adaptability of crop plants to high temperatures Stress. Crop Sci, 22(4): 719-725. |
| [13] | Elsheery N I, Helaly M N, El-Hoseiny H M, et al. 2020. Zinc oxide and silicone nanoparticles to improve the resistance mechanism and annual productivity of salt-stressed mango trees. Agronomy, 10(4): 558. |
| [14] | Farheen J, Mansoor S. 2020. Cytogenetic impact of sodium chloride stress on root cells of Vigna radiata L. seedlings. Turk J Biochem, 45(2): 143-150. |
| [15] | Fick N G, Qualset C D. 1975. Genetic control of plant amylase activity. Proc Natl Acad Sci, 72: 852-862. |
| [16] | Ghosh S, Mistri B. 2020. Drainage induced waterlogging problem and its impact on farming system: A study in Gosaba Island, Sundarban, India. Spatial Inf Res, 28(6): 709-721. |
| [17] | Haque A, Ali M A, Waxuddin M, et al. 1976. Squashmethod for the mitotic chromosomes of grasses. Curr Sci, 43: 382-383. |
| [18] | Hazmana M, Hause B, Eiche E, et al. 2016. Different forms of osmotic stress evokes qualitatively different responses in rice. Plant Physiol, 202: 45-56. |
| [19] | Heath R L, Packer L. 1968. Photo-oxidation in isolated chloroplasts: kinetics and stoichiometry of fatty acid oxidation. Arch Biochem Biophys, 125(1): 189-198. |
| [20] | Hernández J A, Almansa M S. 2002. Short-term effects of salt stress on antioxidant systems and leaf water relations of pea leaves. J Plant Physiol, 115(2): 251-257. |
| [21] | Horemans N, Foyer C H, Asard H. 2000. Transport and action of ascorbate at the plant plasma membrane. Trends Plant Sci, 5(6): 263-267. |
| [22] | Hossain A, El Sabagh A, Bhatt R, et al. 2021. Consequences of salt and drought stresses in rice and their mitigation strategies through intrinsic biochemical adaptation and applying stress regulators. In: Fahad S, Sönmez O, Saud S, et al. Sustainable Soil and Land Management and Climate Change. Florida, USA: CRC Press: 1-15. |
| [23] | Hossain M A, Ismail M R, Uddin M K, et al. 2013. Efficacy of ascorbate-glutathione cycle for scavenging H2O2 in two contrasting rice genotypes during salinity stress. Aust J Crop Sci, 7(12): 1801-1808. |
| [24] | Hossen M S, Karim M F, Fujita M, et al. 2022. Comparative physiology of indica and Japonica rice under salinity and drought stress: An intrinsic study on osmotic adjustment, oxidative stress, antioxidant defense and methylglyoxal detoxification. Stresses, 2(2): 156-178. |
| [25] | Hussain S, Zhang J H, Zhong C, et al. 2017. Effects of salt stress on rice growth, development characteristics, and the regulating ways: A review. J Integr Agric, 16(11): 2357-2374. |
| [26] | Ismail A M, Heuer S, Thomson M J, et al. 2007. Genetic and genomic approaches to develop rice germplasm for problem soils. Plant Mol Biol, 65(4): 547-570. |
| [27] | Jiang M Y, Zhang J H. 2001. Effect of abscisic acid on active oxygen species, antioxidative defence system and oxidative damage in leaves of maize seedlings. Plant Cell Physiol, 42(11): 1265-1273. |
| [28] | Jiang W, Liu D. 2000. Effects of Pb2+ on root growth, cell division, and nucleolus of Zea mays L. Bull Environ Contam Toxicol, 65(6): 786-793. |
| [29] | Kato T A, Haskins J S. 2023. Mitotic index analysis. Methods Mol Biol, 2519: 17-26. |
| [30] | Kesawat M S, Satheesh N, Kherawat B S, et al. 2023. Regulation of reactive oxygen species during salt stress in plants and their crosstalk with other signaling molecules-current perspectives and future directions. Plants, 12(4): 864. |
| [31] | Kiełkowska A. 2017. Cytogenetic effect of prolonged in vitro exposure of Allium cepa L. root meristem cells to salt stress. Cytol Genet, 51(6): 478-484. |
| [32] | Kitsios G, Doonan J H. 2011. Cyclin dependent protein kinases and stress responses in plants. Plant Signal Behav, 6(2): 204-209. |
| [33] | Kononenko N V, Dilovarova T A, Kanavsky R V, et al. 2019. Evaluation of morphological and biochemical resistance parameters to chloride salination in different wheat genotypes. RUDN J Agron Anim Ind, 14(1): 18-39. |
| [34] | Li J Y, Jiang A L, Zhang W. 2007. Salt stress-induced programmed cell death in rice root tip cells. J Integr Plant Biol, 49(4): 481-486. |
| [35] | Lim C B, Prêle C M, Baltic S, et al. 2015. Mitochondria- derived reactive oxygen species drive GANT61-induced mesothelioma cell apoptosis. Oncotarget, 6(3):1519-1530. |
| [36] | Lisa L A, Seraj Z I, Fazle Elahi C M, et al. 2004. Genetic variation in microsatellite DNA, physiology and morphology of coastal saline rice (Oryza sativa L.) landraces of Bangladesh. Plant Soil, 263(1): 213-228. |
| [37] | Lubini G, Fachinetto J M, Laughinghouse H D, et al. 2008. Extracts affecting mitotic division in root-tip meristematic cells. Biologia, 63(5): 647-651. |
| [38] | Luo L Z, Werner K M, Gollin S M, et al, 2004. Cigarette smoke induces anaphase bridges and genomic imbalances in normal cells. Mutat Res Fundam Mol Mech Mutagen, 554(1/2): 375-385. |
| [39] | MacNevin W M, Urone P F. 1953. Separation of hydrogen peroxide from organic hydroperoxides. Anal Chem, 25(11): 1760-1761. |
| [40] | Mensor L L, Menezes F S, Leitão G G, et al. 2001. Screening of Brazilian plant extracts for antioxidant activity by the use of DPPH free radical method. Phytother Res, 15(2): 127-130. |
| [41] | Miller G, Suzuki N, Ciftci-Yilmaz S, et al. 2010. Reactive oxygen species homeostasis and signalling during drought and salinity stresses. Plant Cell Environ, 33(4): 453-467. |
| [42] | Moradi F, Ismail A M. 2007. Responses of photosynthesis, chlorophyll fluorescence and ROS-scavenging systems to salt stress during seedling and reproductive stages in rice. Ann Bot, 99(6): 1161-1173. |
| [43] | Nakano Y, Asada K. 1981. Hydrogen peroxide is scavenged by ascorbate-specific peroxidase in spinach chloroplasts. Plant Cell Physiol, 22(5): 867-880. |
| [44] | Nefic H, Musanovic J, Metovic A, et al. 2013. Chromosomal and nuclear alterations in root tip cells of Allium cepa L. induced by alprazolam. Med Arch, 67(6): 388-392. |
| [45] | Noctor G, Reichheld J P, Foyer C H. 2018. ROS-related redox regulation and signaling in plants. Semin Cell Dev Biol, 80: 3-12. |
| [46] | Nourooz-Zadeh J, Tajaddini-Sarmadi J, Wolff S P. 1994. Measurement of plasma hydroperoxide concentrations by the ferrous oxidation-xylenol orange assay in conjunction with triphenylphosphine. Anal Biochem, 220(2): 403-409. |
| [47] | Palmer R G, Heer H. 1973. A root tip squash technique for soybean Chromosomes. Crop Sci, 13(3): 389-391. |
| [48] | Park H J, Kim W Y, Yun D J. 2016. A new insight of salt stress signaling in plant. Mol Cells, 39(6): 447-459. |
| [49] | Patterson J C, Joughin B A, van de Kooij B, et al. 2019. ROS and ooxidative stress are eelevated in mitosis during aasynchronous ccell cycle pprogression and aare eexacerbated by mitotic aarrest, Cell Systems, 8(02): 163-167.e2. |
| [50] | Peterman T K, Siedow J N. 1985. Immunological comparison of lipoxygenase isozymes-1 and -2 with soybean seedling lipoxygenases. Arch Biochem Biophys, 238(2): 476-483. |
| [51] | Qin J, Dong W Y, He K N, et al. 2010. NaCl salinity-induced changes in water status, ion contents and photosynthetic properties of Shepherdia argentea (Pursh) Nutt. seedlings. Plant Soil Environ, 56(7): 325-332. |
| [52] | Radić S, Prolić M, Pavlica M, et al. 2005. Cytogenetic effects of osmotic stress on the root meristem cells of Centaurea ragusina L. Environ Exp Bot, 54(3): 213-218. |
| [53] | Rahman M A, Thomson M J, Shah-E-Alam M, et al. 2016. Exploring novel genetic sources of salinity tolerance in rice through molecular and physiological characterization. Ann Bot, 117(6): 1083-1097. |
| [54] | Rank J, Lopez L C, Nielsen M H, et al. 2002. Genotoxicity of maleic hydrazide, acridine and DEHP in Allium cepa root cells performed by two different laboratories. Hereditas, 136(1): 13-18. |
| [55] | Rubio-Casal A E, Castillo J M, Luque C J, et al. 2003. Influence of salinity on germination and seeds viability of two primary colonizers of Mediterranean salt pans. J Arid Environ, 53(2): 145-154. |
| [56] | Ryu H, Cho Y G. 2015. Plant hormones in salt stress tolerance. J Plant Biol, 58(3): 147-155. |
| [57] | Saleem M H, Ali S, Hussain S, et al. 2020. Flax (Linum usitatissimum L.): A potential candidate for phytoremediation? Biological and economical points of view. Plants, 9(4): 496. |
| [58] | Saleh A K, Shaban A S, Diab M A, et al. 2023. Green synthesis and characterization of aluminum oxide nanoparticles using Phoenix dactylifera seed extract along with antimicrobial activity, phytotoxicity, and cytological effects on Vicia faba seeds. Biomass Conv Bioref, 14: 31859-31875. |
| [59] | Sapkota A. 2002. Chromosomal mutation: Causes, mechanism, types, examples. In: Russel P J. Genetics. San Francisco, USA: Pearson Education Inc: 595-621. |
| [60] | Schaedle M, Bassham J A. 1977. Chloroplast glutathione reductase. Plant Physiol, 59(5): 1011-1012. |
| [61] | Shaban A S, Safhi F A, Fakhr M A, et al. 2023. Comparison of the Morpho-physiological and molecular responses to salinity and alkalinity stresses in rice. Plants, 13(1): 60. |
| [62] | Simontacchi M, Caro A, Fraga C G, et al. 1993. Oxidative stress affects α-tocopherol content in soybean embryonic axes upon imbibition and following germination. Plant Physiol, 103(3): 949-953. |
| [63] | Singh D, Roy B K. 2016. Salt stress affects mitotic activity and modulates antioxidant systems in onion roots. Braz J Bot, 39(1): 67-76. |
| [64] | Tajbakhsh M, Zhou M X, Chen Z H, et al. 2006. Physiological and cytological response of salt-tolerant and non-tolerant barley to salinity during germination and early growth. Aust J Exp Agric, 46(4): 555-562. |
| [65] | Teixeira S B, Pires S N, Ávila G E, et al. 2018. Cytogenetic activity of root meristems of rice in response to conditioning in carrot extract and salinity. J Exp Agric Int, 24(5): 1-12. |
| [66] | Tobe K, Zhang L P, Omasa K. 2003. Alleviatory effects of calcium on the toxicity of sodium, potassium and magnesium chlorides to seed germination in three non-halophytes. Seed Sci Res, 13(1): 47-54. |
| [67] | Türkoğlu S. 2008. Evaluation of genotoxic effects of sodium propionate, calcium propionate and potassium propionate on the root meristem cells of Allium cepa. Food Chem Toxicol, 46(6): 2035-2041. |
| [68] | Vázquez-Ramos J M,de la Paz Sánchez M. 2003. The cell cycle and seed germination. Seed Sci Res, 13(2): 113-130. |
| [69] | Wang W D, Sheng X Y, Shu Z F, et al. 2016. Combined cytological and transcriptomic analysis reveals a nitric oxide signaling pathway involved in cold-inhibited Camellia sinensis pollen tube growth. Front Plant Sci, 7: 456. |
| [70] | Xu Y M, Bu W C, Xu Y C, et al. 2024. Effects of salt stress on physiological and agronomic traits of rice genotypes with contrasting salt tolerance. Plants, 13(8): 1157. |
| [71] | Yildiz M, Ciğerci I H, Konuk M, et al. 2009. Determination of genotoxic effects of copper sulphate and cobalt chloride in Allium cepa root cells by chromosome aberration and comet assays. Chemosphere, 75(7): 934-938. |
| [72] | Zhang X, Yin H B, Chen S H, et al. 2014. Changes in antioxidant enzyme activity and transcript levels of related genes in Limonium sinense Kuntze seedlings under NaCl stress. J Chem, 2014: 749047. |
| [73] | Zhu J K. 2016. Abiotic stress signaling and responses in plants. Cell, 167(2): 313-324. |
| No related articles found! |
| 阅读次数 | ||||||
|
全文 |
|
|||||
|
摘要 |
|
|||||