Rice Science ›› 2025, Vol. 32 ›› Issue (4): 453-456.DOI: 10.1016/j.rsci.2025.05.002
收稿日期:2024-10-12
接受日期:2025-05-08
出版日期:2025-07-28
发布日期:2025-08-06
. [J]. Rice Science, 2025, 32(4): 453-456.

Fig. 1. Grain yields and fertilizer rates. A and B, Box and whisker plots showing rice grain yield of blanket recommendations, basic calibration (NESL1) (A), and comprehensive calibration (NESL2) (B). The red line denotes the mean. Different lowercase letters near the red lines indicate significant difference in average yields at P < 0.05 by paired sample t-test. C-H, Recommended fertilizer rates by NESL1 (n = 71) and NESL2 (n = 26) for experimental sites: nitrogen (N) (C and D), phosphorus (P) (E and F), and potassium (K) (G and H). Red horizontal lines represent nutrient amounts supplied by the blanket recommendation.
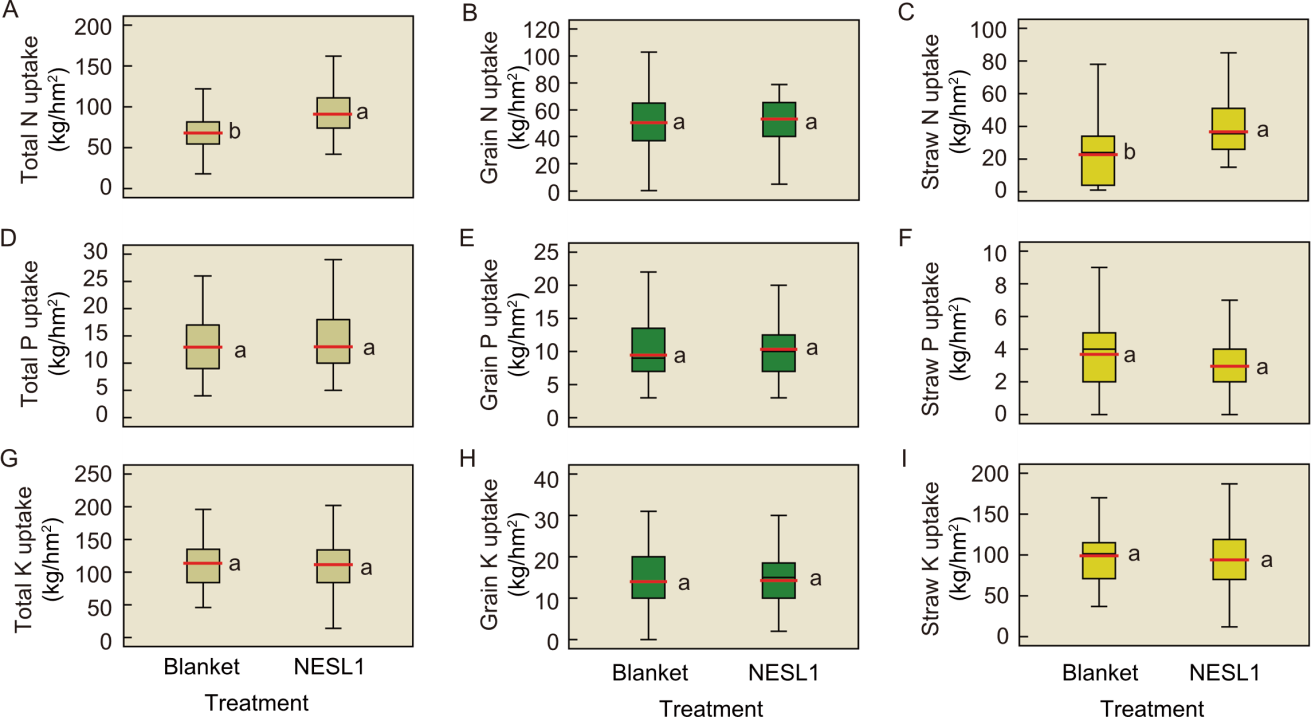
Fig. 2. Plant uptake of nitrogen (N), phosphorus (P), and potassium (K). A-C, N uptake by rice plants: total N uptake (A), grain N uptake (B), and straw N uptake (C) under the blanket and basic calibration (NESL1) fertilizer management (n = 71). D-F, P uptake by rice plants: total P uptake (D), grain P uptake (E), and straw P uptake (F) under the blanket and NESL1 fertilizer management (n = 71). G-I, K uptake by rice plants: total K uptake (G), grain K uptake (H), and straw K uptake (I) under the blanket and NESL1 fertilizer management (n = 71). The box’s bottom line indicates the 25th percentile, the middle line represents the median, and the top line signifies the 75th percentile. The red line denotes the mean, while the whiskers represent the minimum value and the upper end represents the maximum value. Different lowercase letters near red lines indicate significant differences in average yields at P < 0.05 by paired sample t-test.
| Fertilizer cost | Yield income | Gross return above fertilizer cost | |||
|---|---|---|---|---|---|
| N | P | K | |||
| Blanket | 84 a | 18 a | 21 a | 1 454 b | 1 330 b |
| NESL1 | 90 a | 21 a | 21 a | 1 525 a | 1 393 a |
| P-value | > 0.1 | > 0.1 | > 0.1 | 0.008 | 0.018 |
| Blanket | 84 a | 18 a | 21 a | 1 611 b | 1 487 b |
| NESL2 | 94 a | 19 a | 17 a | 1 756 a | 1 626 a |
| P-value | > 0.1 | > 0.1 | > 0.1 | 0.003 | 0.005 |
Table 1. Fertilizer costs, yield income, and gross return above fertilizer cost. $/hm2
| Fertilizer cost | Yield income | Gross return above fertilizer cost | |||
|---|---|---|---|---|---|
| N | P | K | |||
| Blanket | 84 a | 18 a | 21 a | 1 454 b | 1 330 b |
| NESL1 | 90 a | 21 a | 21 a | 1 525 a | 1 393 a |
| P-value | > 0.1 | > 0.1 | > 0.1 | 0.008 | 0.018 |
| Blanket | 84 a | 18 a | 21 a | 1 611 b | 1 487 b |
| NESL2 | 94 a | 19 a | 17 a | 1 756 a | 1 626 a |
| P-value | > 0.1 | > 0.1 | > 0.1 | 0.003 | 0.005 |
| [1] | Amgain L P, Timsina J, Dutta S, et al. 2021. Nutrient expert® rice: An alternative fertilizer recommendation strategy to improve productivity, profitability and nutrient use efficiency of rice in Nepal. J Plant Nutr, 44(15): 2258-2273. |
| [2] | Bhatta R D, Amgain L P, Subedi R, et al. 2020. Assessment of productivity and profitabilty of wheat using Nutrient Expert®-Wheat model in Jhapa district of Nepal. Heliyon, 6(6): e04144. |
| [3] | de Datta S K, Buresh R J. 1989. Integrated nitrogen management in irrigated rice. In: Stewart B A. Advances in Soil Science. New York, USA: Springer: 143-169. |
| [4] | Dobermann A, Fairhurts T H. 2000. Rice: Nutrient Disorders and Nutrient Management. Manila, the Philippines: International Rice Research Institute. |
| [5] | Kulasinghe H P G T N, Vitharana U W A, Dharmakeerthi R S, et al. 2020. Exploring the yield response of paddy (Oryza sativa L.) under varying levels of soil nitrogen, phosphorus and potassium. Trop Agric Res, 31(4): 1-12. |
| [6] | Mandal M K, Dutta S, Majumdar K, et al. 2015. Enhancing rice yield, profitability and phosphorus use efficiency in West Bengal using the Nutrient Expert fertilizer decision support tool. Better Crops, 9: 1-40. |
| [7] | Morari F, Zanella V, Sartori L, et al. 2018. Optimising durum wheat cultivation in north Italy: Understanding the effects of site-specific fertilization on yield and protein content. Precis Agric, 19(2): 257-277. |
| [8] | Pampolino M F, Manguiat I J, Ramanathan S, et al. 2007. Environmental impact and economic benefits of site-specific nutrient management (SSNM) in irrigated rice systems. Agric Syst, 93: 1-24. |
| [9] | Pampolino M F, Witt C, Pasuquin J M, et al. 2012. Development approach and evaluation of the Nutrient Expert software for nutrient management in cereal crops. Comput Electron Agric, 88: 103-110. |
| [10] | Qin J Q, Impa S M, Tang Q Y, et al. 2013. Integrated nutrient, water and other agronomic options to enhance rice grain yield and N use efficiency in double-season rice crop. Field Crops Res, 148: 15-23. |
| [11] | Rathnayake W M U K, Rupasinghe M G N, Sirisena D N, et al. 2019. Response of rice to site-specific application of fertilizer. In: Annals of Sri Lanka Department of Agriculture. Peradeniya, Sri Lanka: Department of Agriculture: 110-114. |
| [12] | Reidsma P, Feng S Y, van Loon M, et al. 2012. Integrated assessment of agricultural land use policies on nutrient pollution and sustainable development in Taihu Basin, China. Environ Sci Policy, 18: 66-76. |
| [13] | Rurinda J, Zingore S, Jibrin J M, et al. 2020. Science-based decision support for formulating crop fertilizer recommendations in sub-Saharan Africa. Agric Syst, 180: 102790. |
| [14] | Satyanarayana T, Majumdar K, Pampolino M, et al. 2013. Nutrient expert: A tool to optimize nutrient use and improve productivity of maize. Better Crops, 97: 21-24. |
| [15] | Sirisena D N, Sumanapala K V K K, Wanninayake W M N. 2012. Use of leaf color chart and SPAD meter to estimate total nitrogen content in rice (Oryza saliva L.) plants. In: Annals of the Sri Lanka Department of Agriculture. Peradeniya, Sri Lanka: Department of Agriculture: 313-314. |
| [16] | Surekha K, Kumar R M, Tuti M, et al. 2018. Yield maximization of rice systems through Nutrient Expert based Site-specific nutrient management. In: International Symposium on Soil Water Plant Nutrition. Nagpur, India: College of Agriculture: 25-26. |
| [17] | Tian D, Li Z, O’Connor D, et al. 2020. The need to prioritize sustainable phosphate-based fertilizers. Soil Use Manag, 36(3): 351-354. |
| [18] | Timsina J, Dutta S, Devkota K P, et al. 2021. Improved nutrient management in cereals using Nutrient Expert and machine learning tools: Productivity, profitability and nutrient use efficiency. Agric Syst, 192: 103181. |
| [19] | Witt C, Dobermann A. 2002. A site-specific nutrient management approach for irrigated, lowland rice in Asia. Better Crops, 16: 20-24. |
| [20] | Xu X P, He P, Yang F Q, et al. 2017. Methodology of fertilizer recommendation based on yield response and agronomic efficiency for rice in China. Field Crops Res, 206: 33-42. |
| [21] | Xu X P, He P, Pampolino M F, et al. 2019. Spatial variation of yield response and fertilizer requirements on regional scale for irrigated rice in China. Sci Rep, 9: 3589. |
| [22] | Zhang J J, He P, Xu X P, et al. 2017. Nutrient expert improves nitrogen efficiency and environmental benefits for summer maize in China. Agron J, 109(3): 1082-1090. |
| [23] | Zhang J J, He P, Xu X P, et al. 2018. Nutrient expert improves nitrogen efficiency and environmental benefits for winter wheat in China. Agron J, 110(2): 696-706. |
| No related articles found! |
| 阅读次数 | ||||||
|
全文 |
|
|||||
|
摘要 |
|
|||||