Rice Science ›› 2019, Vol. 26 ›› Issue (4): 248-256.DOI: 10.1016/j.rsci.2019.04.005
收稿日期:2019-01-28
接受日期:2019-04-28
出版日期:2019-07-28
发布日期:2019-04-04
. [J]. Rice Science, 2019, 26(4): 248-256.
| Species | GM variety | Non-GM variety |
| Rice | Huahui 1, II Kefeng 6, Kefeng 6, Bar 68-1, Wan 21B, Kangyou 97 | II Minghui 86, Minghui 86, Minghui 63, Shanyou 10, Shanyou 63, 80-4B, Donglong, Songjing 6, Zhonghua 11, Zhongzuo 58, Sanjiang 1, Liaojing 371 |
| Cotton | LLcotton25, Mon15985, Mon1445, Mon88913 | Non-GM variety |
| Maize | Bt176, TC1507, Mon810, Mon863 | Non-GM variety |
| Soybean | Mon89788, A5547-127, GTS40-3-2 | Non-GM variety |
| Beet | H7-1 | Non-GM variety |
| Rapeseed | GT73, ToPas19/2 | |
| Papaya | Huanong 1 | |
| Tomato | Tomato | |
| Potato | Potato | |
| Gramineous plant | Wheat, oats, barley, mung bean, buckwheat | |
| Model plant | Arabidopsis, cauliflower, tobacco | |
| GM, Genetically modified. | ||
Table 1 Information of the plant materials.
| Species | GM variety | Non-GM variety |
| Rice | Huahui 1, II Kefeng 6, Kefeng 6, Bar 68-1, Wan 21B, Kangyou 97 | II Minghui 86, Minghui 86, Minghui 63, Shanyou 10, Shanyou 63, 80-4B, Donglong, Songjing 6, Zhonghua 11, Zhongzuo 58, Sanjiang 1, Liaojing 371 |
| Cotton | LLcotton25, Mon15985, Mon1445, Mon88913 | Non-GM variety |
| Maize | Bt176, TC1507, Mon810, Mon863 | Non-GM variety |
| Soybean | Mon89788, A5547-127, GTS40-3-2 | Non-GM variety |
| Beet | H7-1 | Non-GM variety |
| Rapeseed | GT73, ToPas19/2 | |
| Papaya | Huanong 1 | |
| Tomato | Tomato | |
| Potato | Potato | |
| Gramineous plant | Wheat, oats, barley, mung bean, buckwheat | |
| Model plant | Arabidopsis, cauliflower, tobacco | |
| GM, Genetically modified. | ||
| Gene | Primer | Primer sequence (5′-3′) | Product size (bp) | Annealing temperature (ºC) | Reference |
| PLD | PLD-F PLD-R PLD-P | TGGTGAGCGTTTTGCAGTCT CTGATCCACTAGCAGGAGGTCC FAM-GTTGTGCTGCCAATGTGGCCTG-TAMRA | 68 | 58 | JRC, 2006 |
| PLD-F1 PLD-R1 | CGGCTTGGGATGTGCTCTA TGGATGCTCCTGTCAATGGTG | 268 | 54 | ||
| PLD-F2 PLD-R2 | CTGAGTGTCGTCTGTGGGTGTTCC CCGTGCTAAAGATGGGTGAGG | 245 | 58 | ||
| PLD-F3 PLD-R3 | GAACAACACCATTGACAGGAGCAT CCACATTGGCAGCACAACATAGA | 241 | 56 | ||
| SPS | SPS-F SPS-R SPS-P | CGGTTGATCTTTTCGGGATG TTGCGCCTGAACGGATAT FAM-GACGCACGGACGGCTCGGA-TAMRA | 81 | 54 | Ding et al, 2004 |
| SPS-F1 SPS-R1 | TTGCGCCTGAACGGATAT GGAGAAGCACTGGACGAGG | 277 | 54 | Jiang et al, 2009 | |
| SPS-F2 SPS-R2 | GCCATGGATTACATATGGCAAGA ATCTGTTTACTCGTCAAGTGTCATCTC | 287 | 56 | ||
| RBE4 | RBE4-F RBE4-R RBE4-P | GTTTTAGTTGGGTGAAAGCGGTT CCTGTTAGTTCTTCCAATGCCCTTA FAM-TCTGGTTGGGAATAGATACT-MGBNFQ | 106 | 54 | Jeong et al, 2007 |
| RBE4-F1 RBE4-R1 | TCCAATGCCCTTAAACTTTATCA AACGATCTAATTCTGGGCTTTAT | 206 | 54 | Jeong et al, 2007 | |
| RBE4-F2 RBE4-R2 | AGGGCATTGGAAGAACTAACAG CACCACCATCTTGAACAGGAAT | 264 | 54 | ||
| RBE4-F3 RBE4-R3 | TAGTTGGGTGAAAGCGGTTAG CACCACCATCTTGAACAGGAAT | 343 | 54 | ||
| GOS9 | GOS9-F GOS9-R GOS9-P | TTAGCCTCCCGCTGCAGA AGAGTCCACAAGTGCTCCCG FAM-CGGCAGTGTGGTTGGTTTCTTCGG-TAMRA | 68 | 56 | Hernández et al, 2005 |
| GOS9-F1 GOS9-R1 | ACTTACGGGATGGTCTTTGCA GCAATCAATCCATTACCTGCTC | 255 | 54 | ||
| GOS9-F2 GOS9-R2 | TAAGTTGCTTCGACGTACAGGA TAGATGACGGTGACGAGGATAGAGT | 303 | 56 | ||
| GOS9-F3 GOS9-R3 | GCTGCCCGTTAATACATGTTCCT CTAAAAGCAGTTCCACCACCTTGT | 301 | 56 | ||
| PEPC | PEPC-F PEPC-R PEPC-P | TAGGAATCACGGATACGCA TGAACTCAGGTTGCTGGAC FAM-AGGGAGATCCTTACTTGAGGCAGAGAC-TAMRA | 80 | 54 | |
| PEPC-F1 PEPC-R1 | GGTCCCTGATACGCTTTA TCTGCCCACTCACTGCTA | 153 | 54 | ||
| PEPC-F2 PEPC-R2 | GCCGTTGTCGCTTGTTGTGTTC CAGAGACTGCGTATCCGTGATTCCT | 183 | 60 | ||
| PEPC-F3 PEPC-R3 | TCCCTCCAGAAGGTCTTTGTGTC GCTGGCAACTGGTTGGTAATG | 271 | 56 |
Table 2 The detailed sequences of the PCR primers and probes for quanlitative PCR.
| Gene | Primer | Primer sequence (5′-3′) | Product size (bp) | Annealing temperature (ºC) | Reference |
| PLD | PLD-F PLD-R PLD-P | TGGTGAGCGTTTTGCAGTCT CTGATCCACTAGCAGGAGGTCC FAM-GTTGTGCTGCCAATGTGGCCTG-TAMRA | 68 | 58 | JRC, 2006 |
| PLD-F1 PLD-R1 | CGGCTTGGGATGTGCTCTA TGGATGCTCCTGTCAATGGTG | 268 | 54 | ||
| PLD-F2 PLD-R2 | CTGAGTGTCGTCTGTGGGTGTTCC CCGTGCTAAAGATGGGTGAGG | 245 | 58 | ||
| PLD-F3 PLD-R3 | GAACAACACCATTGACAGGAGCAT CCACATTGGCAGCACAACATAGA | 241 | 56 | ||
| SPS | SPS-F SPS-R SPS-P | CGGTTGATCTTTTCGGGATG TTGCGCCTGAACGGATAT FAM-GACGCACGGACGGCTCGGA-TAMRA | 81 | 54 | Ding et al, 2004 |
| SPS-F1 SPS-R1 | TTGCGCCTGAACGGATAT GGAGAAGCACTGGACGAGG | 277 | 54 | Jiang et al, 2009 | |
| SPS-F2 SPS-R2 | GCCATGGATTACATATGGCAAGA ATCTGTTTACTCGTCAAGTGTCATCTC | 287 | 56 | ||
| RBE4 | RBE4-F RBE4-R RBE4-P | GTTTTAGTTGGGTGAAAGCGGTT CCTGTTAGTTCTTCCAATGCCCTTA FAM-TCTGGTTGGGAATAGATACT-MGBNFQ | 106 | 54 | Jeong et al, 2007 |
| RBE4-F1 RBE4-R1 | TCCAATGCCCTTAAACTTTATCA AACGATCTAATTCTGGGCTTTAT | 206 | 54 | Jeong et al, 2007 | |
| RBE4-F2 RBE4-R2 | AGGGCATTGGAAGAACTAACAG CACCACCATCTTGAACAGGAAT | 264 | 54 | ||
| RBE4-F3 RBE4-R3 | TAGTTGGGTGAAAGCGGTTAG CACCACCATCTTGAACAGGAAT | 343 | 54 | ||
| GOS9 | GOS9-F GOS9-R GOS9-P | TTAGCCTCCCGCTGCAGA AGAGTCCACAAGTGCTCCCG FAM-CGGCAGTGTGGTTGGTTTCTTCGG-TAMRA | 68 | 56 | Hernández et al, 2005 |
| GOS9-F1 GOS9-R1 | ACTTACGGGATGGTCTTTGCA GCAATCAATCCATTACCTGCTC | 255 | 54 | ||
| GOS9-F2 GOS9-R2 | TAAGTTGCTTCGACGTACAGGA TAGATGACGGTGACGAGGATAGAGT | 303 | 56 | ||
| GOS9-F3 GOS9-R3 | GCTGCCCGTTAATACATGTTCCT CTAAAAGCAGTTCCACCACCTTGT | 301 | 56 | ||
| PEPC | PEPC-F PEPC-R PEPC-P | TAGGAATCACGGATACGCA TGAACTCAGGTTGCTGGAC FAM-AGGGAGATCCTTACTTGAGGCAGAGAC-TAMRA | 80 | 54 | |
| PEPC-F1 PEPC-R1 | GGTCCCTGATACGCTTTA TCTGCCCACTCACTGCTA | 153 | 54 | ||
| PEPC-F2 PEPC-R2 | GCCGTTGTCGCTTGTTGTGTTC CAGAGACTGCGTATCCGTGATTCCT | 183 | 60 | ||
| PEPC-F3 PEPC-R3 | TCCCTCCAGAAGGTCTTTGTGTC GCTGGCAACTGGTTGGTAATG | 271 | 56 |
| Reaction system (µL) | Reaction program | |||||||||
|---|---|---|---|---|---|---|---|---|---|---|
| 2×FastStart Universal Probe Master | dNTP (10 Mm) | Primer Each (10 µM) | Probe (10 µM) | DNA (50 ng/μL) | Step1 | Step 2 | Cycles of Step 2 | |||
| SPS-F/R/P | 10 | 0.4 | 0.8 | 0.4 | 1.0 | 95 °C 10 min | 95 °C 15 s | 60 °C 60 s | 40 | |
| PLD-F/R/P | 10 | 0.4 | 0.4 | 0.4 | 1.0 | 95 °C 10 min | 95 °C 15 s | 60 °C 60 s | 45 | |
| RBE4-F/R/P | 10 | 1.0 | 1.0 | 0.4 | 1.0 | 95 °C 10 min | 95 °C 30 s | 60 °C 60 s | 40 | |
| GOS-F/R/P | 10 | 1.6 | 0.6 | 0.4 | 1.0 | 95 °C 10 min | 95 °C 30 s | 60 °C 60 s | 40 | |
| PEPC-F/R/P | 10 | 0.4 | 0.8 | 0.4 | 1.0 | 95 °C 10 min | 95 °C 15 s | 60 °C 60 s | 40 | |
Supplemetnal Table 1 Final real-time quantitative PCR reaction systems and programs.
| Reaction system (µL) | Reaction program | |||||||||
|---|---|---|---|---|---|---|---|---|---|---|
| 2×FastStart Universal Probe Master | dNTP (10 Mm) | Primer Each (10 µM) | Probe (10 µM) | DNA (50 ng/μL) | Step1 | Step 2 | Cycles of Step 2 | |||
| SPS-F/R/P | 10 | 0.4 | 0.8 | 0.4 | 1.0 | 95 °C 10 min | 95 °C 15 s | 60 °C 60 s | 40 | |
| PLD-F/R/P | 10 | 0.4 | 0.4 | 0.4 | 1.0 | 95 °C 10 min | 95 °C 15 s | 60 °C 60 s | 45 | |
| RBE4-F/R/P | 10 | 1.0 | 1.0 | 0.4 | 1.0 | 95 °C 10 min | 95 °C 30 s | 60 °C 60 s | 40 | |
| GOS-F/R/P | 10 | 1.6 | 0.6 | 0.4 | 1.0 | 95 °C 10 min | 95 °C 30 s | 60 °C 60 s | 40 | |
| PEPC-F/R/P | 10 | 0.4 | 0.8 | 0.4 | 1.0 | 95 °C 10 min | 95 °C 15 s | 60 °C 60 s | 40 | |
| Species/Variety | GOS9 | PEPC | PLD | RBE4 | SPS | ||||||||||||||||||
| F/R | F1/R1 | F2/R2 | F3/R3 | F/R | F1/R1 | F2/R2 | F3/R3 | F/R | F1/R1 | F2/R2 | F3/R3 | F/R | F1/R1 | F2/R2 | F3/R3 | F/R | F1/R1 | F2/R2 | |||||
| Non-GM cotton | - | - | - | - | P | - | - | - | - | - | - | - | - | - | - | P | P | - | - | ||||
| LLcotton25 | - | - | - | - | P | - | - | - | - | - | - | - | - | - | P | - | P | - | - | ||||
| Mon15985 | - | - | - | - | P | - | - | - | - | - | - | - | - | - | P | P | P | - | - | ||||
| Mon1445 | - | - | - | - | P | - | - | - | - | - | - | - | - | - | P | P | P | - | - | ||||
| Mon88913 | - | - | - | - | P | - | - | - | - | - | - | - | - | - | - | - | P | - | - | ||||
| Non-GM maize | - | - | - | - | P | - | - | - | P | - | - | P | - | - | - | - | P | - | - | ||||
| Bt176 | - | - | - | - | P | - | - | - | P | - | - | - | - | P | - | - | P | - | - | ||||
| TC1507 | - | - | - | - | P | - | - | - | P | - | - | - | - | - | - | - | P | - | - | ||||
| Mon810 | - | - | - | - | P | - | - | - | P | - | - | P | - | - | - | - | P | - | - | ||||
| Mon863 | - | - | - | - | P | - | - | - | P | - | - | P | - | - | - | - | P | - | - | ||||
| Non-GM soybean | - | - | - | - | P | - | - | - | - | - | - | - | - | - | P | - | P | - | - | ||||
| Mon89788 | - | - | - | - | P | - | - | - | - | P | - | - | - | - | P | P | P | - | - | ||||
| A5547-127 | - | - | - | - | P | - | - | - | - | - | - | - | - | - | P | P | P | - | - | ||||
| GTS40-3-2 | - | - | P | - | P | - | - | - | - | - | - | - | - | - | P | - | P | - | - | ||||
| GT73 | - | - | - | - | P | - | - | - | - | - | P | P | - | - | - | - | P | - | - | ||||
| ToPas19/2 | - | - | - | - | P | - | - | - | - | - | P | P | - | - | - | P | P | - | - | ||||
| Non-GM beet | - | - | - | - | P | - | - | - | - | - | - | - | - | - | - | - | - | - | - | ||||
| H7-1 | - | - | - | - | P | - | - | - | - | - | - | - | - | - | - | - | - | - | - | ||||
| Papaya | - | - | - | - | - | - | - | - | - | - | - | - | - | - | - | P | P | - | - | ||||
| Tomato | - | - | - | - | P | - | - | - | - | - | - | - | - | - | - | P | P | - | - | ||||
| Wheat | - | - | - | - | P | - | - | - | - | - | - | P | - | - | - | - | P | - | - | ||||
| Oat | - | - | - | - | P | - | - | - | - | - | - | P | - | - | - | - | P | - | - | ||||
| Barley | - | - | - | - | P | - | P | - | - | - | - | P | - | P | - | - | P | - | - | ||||
| Tobacco | - | P | - | - | P | - | - | - | - | - | - | - | - | - | - | - | P | - | - | ||||
| Cauliflower | - | - | P | - | P | - | - | - | - | - | - | P | - | - | - | - | P | - | - | ||||
| Mung bean | - | - | - | - | P | - | - | - | P | P | - | - | - | - | - | P | P | - | - | ||||
| Potato | - | - | - | - | P | - | - | - | - | - | - | - | - | - | - | P | P | - | - | ||||
| Buckwheat | - | - | - | - | P | - | - | - | - | - | - | - | - | - | - | - | P | - | - | ||||
| Arabidopsis | - | - | - | - | - | - | - | - | - | - | - | - | - | - | - | - | P | - | - | ||||
| ‘P’ means the positive result and ‘-’ means the negative result. | |||||||||||||||||||||||
Table 3 The interspecific specificity of the five endogenous reference genes among the 29 non-rice species using qualitative PCR.
| Species/Variety | GOS9 | PEPC | PLD | RBE4 | SPS | ||||||||||||||||||
| F/R | F1/R1 | F2/R2 | F3/R3 | F/R | F1/R1 | F2/R2 | F3/R3 | F/R | F1/R1 | F2/R2 | F3/R3 | F/R | F1/R1 | F2/R2 | F3/R3 | F/R | F1/R1 | F2/R2 | |||||
| Non-GM cotton | - | - | - | - | P | - | - | - | - | - | - | - | - | - | - | P | P | - | - | ||||
| LLcotton25 | - | - | - | - | P | - | - | - | - | - | - | - | - | - | P | - | P | - | - | ||||
| Mon15985 | - | - | - | - | P | - | - | - | - | - | - | - | - | - | P | P | P | - | - | ||||
| Mon1445 | - | - | - | - | P | - | - | - | - | - | - | - | - | - | P | P | P | - | - | ||||
| Mon88913 | - | - | - | - | P | - | - | - | - | - | - | - | - | - | - | - | P | - | - | ||||
| Non-GM maize | - | - | - | - | P | - | - | - | P | - | - | P | - | - | - | - | P | - | - | ||||
| Bt176 | - | - | - | - | P | - | - | - | P | - | - | - | - | P | - | - | P | - | - | ||||
| TC1507 | - | - | - | - | P | - | - | - | P | - | - | - | - | - | - | - | P | - | - | ||||
| Mon810 | - | - | - | - | P | - | - | - | P | - | - | P | - | - | - | - | P | - | - | ||||
| Mon863 | - | - | - | - | P | - | - | - | P | - | - | P | - | - | - | - | P | - | - | ||||
| Non-GM soybean | - | - | - | - | P | - | - | - | - | - | - | - | - | - | P | - | P | - | - | ||||
| Mon89788 | - | - | - | - | P | - | - | - | - | P | - | - | - | - | P | P | P | - | - | ||||
| A5547-127 | - | - | - | - | P | - | - | - | - | - | - | - | - | - | P | P | P | - | - | ||||
| GTS40-3-2 | - | - | P | - | P | - | - | - | - | - | - | - | - | - | P | - | P | - | - | ||||
| GT73 | - | - | - | - | P | - | - | - | - | - | P | P | - | - | - | - | P | - | - | ||||
| ToPas19/2 | - | - | - | - | P | - | - | - | - | - | P | P | - | - | - | P | P | - | - | ||||
| Non-GM beet | - | - | - | - | P | - | - | - | - | - | - | - | - | - | - | - | - | - | - | ||||
| H7-1 | - | - | - | - | P | - | - | - | - | - | - | - | - | - | - | - | - | - | - | ||||
| Papaya | - | - | - | - | - | - | - | - | - | - | - | - | - | - | - | P | P | - | - | ||||
| Tomato | - | - | - | - | P | - | - | - | - | - | - | - | - | - | - | P | P | - | - | ||||
| Wheat | - | - | - | - | P | - | - | - | - | - | - | P | - | - | - | - | P | - | - | ||||
| Oat | - | - | - | - | P | - | - | - | - | - | - | P | - | - | - | - | P | - | - | ||||
| Barley | - | - | - | - | P | - | P | - | - | - | - | P | - | P | - | - | P | - | - | ||||
| Tobacco | - | P | - | - | P | - | - | - | - | - | - | - | - | - | - | - | P | - | - | ||||
| Cauliflower | - | - | P | - | P | - | - | - | - | - | - | P | - | - | - | - | P | - | - | ||||
| Mung bean | - | - | - | - | P | - | - | - | P | P | - | - | - | - | - | P | P | - | - | ||||
| Potato | - | - | - | - | P | - | - | - | - | - | - | - | - | - | - | P | P | - | - | ||||
| Buckwheat | - | - | - | - | P | - | - | - | - | - | - | - | - | - | - | - | P | - | - | ||||
| Arabidopsis | - | - | - | - | - | - | - | - | - | - | - | - | - | - | - | - | P | - | - | ||||
| ‘P’ means the positive result and ‘-’ means the negative result. | |||||||||||||||||||||||
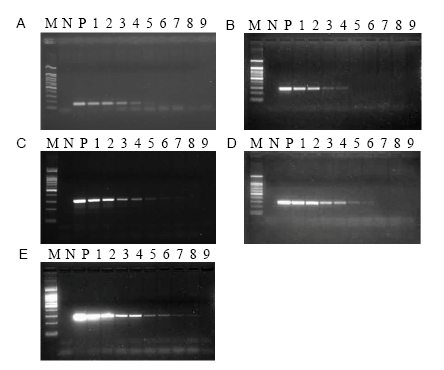
Fig. 1. Qualitative detection sensitivity of the five primers. A, PEPC-F1/R1. B, SPS-F1/R1. C, GOS9-F3/R3. D, SPS-F2/R2. E, PEPC-F3/R3. Lane M, 100 bp marker; Lane N, Negative control; Lane P, Positive control; Lanes 1 to 9, 10%, 5%, 1%, 0.5%, 0.1%, 0.05%, 0.01%, 0.005% and 0% of DNA concentrations, respectively.
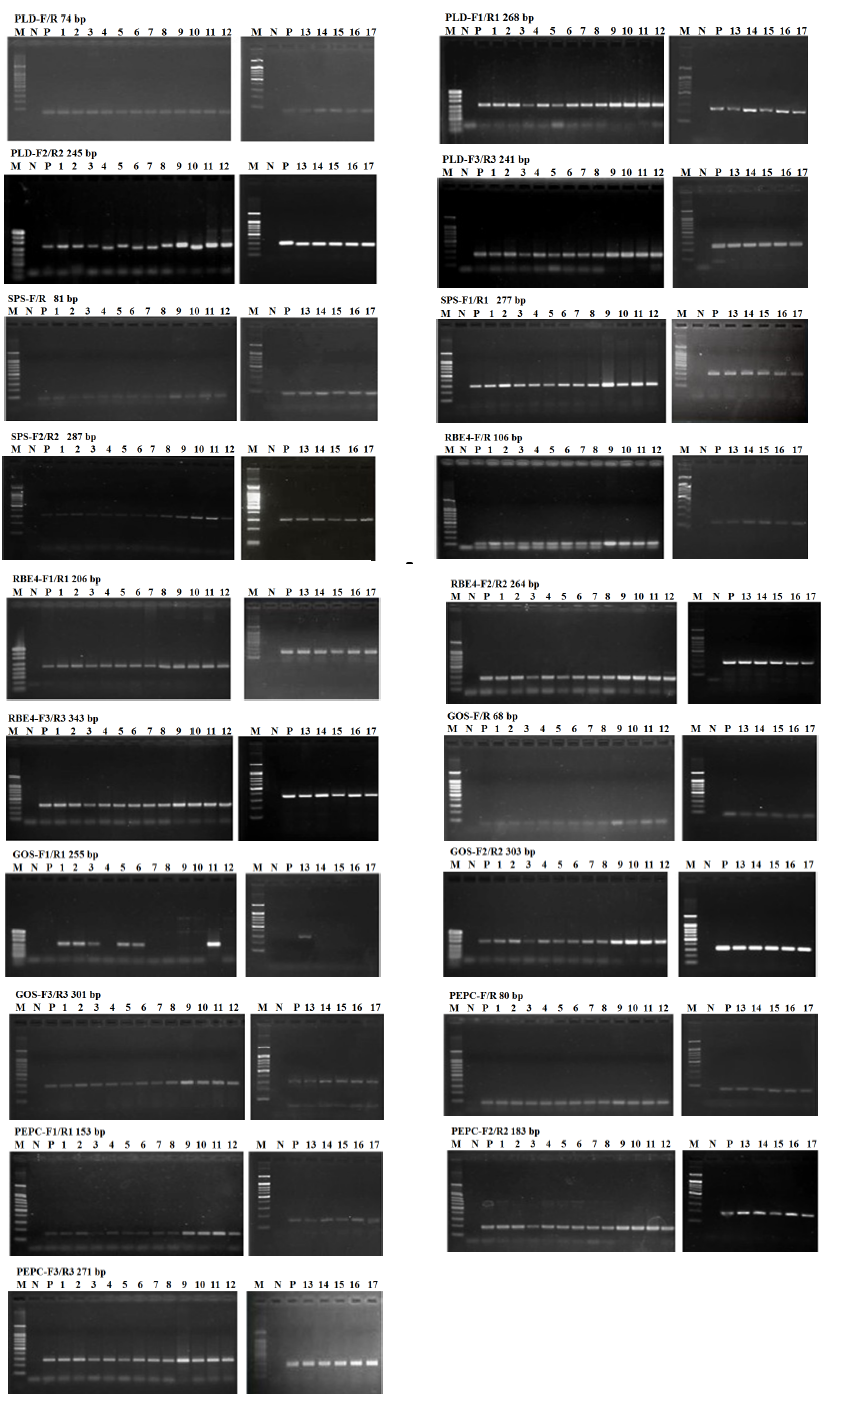
Supplemental Fig. 1. Intraspecific specificity of the five endogenous reference genes among the 18 rice varieties.Lane M, 100 bp marker; Lane N, negative control; P, Positive control; Lanes 2-17, Huahui 1, II Kefeng 6, II Minghui 86, Shanyou 10, Wan 21B, Shanyou 63, Kangyou 97, 80-4B, Minghui 86, Bar68-1, Donglong, Kefeng 6, Minghui 63, Songjing 6, Zhonghua 11, Zhongzuo 58, Sanjiang 1 and Liaojing 371, respectively.
| Primer | Annealing temperature (ºC) | Final concentration (µmol/L) |
| GOS9-F3/R3 | 58 | 0.1 |
| SPS-F1/R1 | 56 | 0.4 |
| SPS-F2/R2 | 58 | 0.1 |
| PEPC-F1/R1 | 56 | 0.2 |
| PEPC-F3/R3 | 58 | 0.1 |
Table 4 Optimized PCR reaction of the five selected specific primers.
| Primer | Annealing temperature (ºC) | Final concentration (µmol/L) |
| GOS9-F3/R3 | 58 | 0.1 |
| SPS-F1/R1 | 56 | 0.4 |
| SPS-F2/R2 | 58 | 0.1 |
| PEPC-F1/R1 | 56 | 0.2 |
| PEPC-F3/R3 | 58 | 0.1 |
| Species | Variety | PLD | SPS | GOS9 | RBE4 | PEPC |
| Cotton | LLcotton25 | 39.60 | - | - | - | - |
| Maize | Non-GM variety | - | 39.69 | 36.96/37.76/37.79 | - | 39.31 |
| TC1507 | - | - | - | 38.28/36.97/36.80 | - | |
| Mon863 | - | - | - | 38.51 | - | |
| Soybean | Non-GM variety | - | - | 38.98 | 38.19 | - |
| Mon89788 | - | 39.31 | - | 39.19 | - | |
| GTS40-3-2 | - | - | - | - | 39.14 | |
| Rapeseed | GT73 | - | - | - | 39.05 | - |
| Beet | Non-GM variety | 39.36/38.50/38.42 | - | 38.16/39.81/38.19 | 38.28/37.99/37.43 | 39.98 |
| H7-1 | - | - | 39.28 | - | - | |
| Tomato | Non-GM variety | - | - | 39.94/37.68 | - | - |
| Oat | Non-GM variety | - | - | 38.03 | - | - |
| Barley | Non-GM variety | - | - | 38.29 | - | - |
| Tobacco | Non-GM variety | - | - | 36.58/37.48/38.54 | - | - |
| Cauliflower | Non-GM variety | - | - | 39.49 | 38.19 | - |
| Potato | Non-GM variety | - | - | 39.55 | 39.35 | - |
| Buck wheat | Non-GM variety | - | - | 39.26 | 39.24 | 39.28 |
| Arabidopsis | Non-GM variety | - | - | 39.32/39.51 | 37.27/38.30/37.68 | - |
| Rice | Kefeng 6 | 30.11/30.09/29.92 | 33.86/34.21/34.43 | 30.16/30.00/30.07 | 29.79/29.88/29.67 | 31.02/30.76/31.43 |
| ‘-’ means data are not available. Species with no Ct values for all the genes are not shown. | ||||||
Table 5 Interspecific specificity (Ct values) of the five endogenous reference genes among the 29 non-rice species using real-time PCR.
| Species | Variety | PLD | SPS | GOS9 | RBE4 | PEPC |
| Cotton | LLcotton25 | 39.60 | - | - | - | - |
| Maize | Non-GM variety | - | 39.69 | 36.96/37.76/37.79 | - | 39.31 |
| TC1507 | - | - | - | 38.28/36.97/36.80 | - | |
| Mon863 | - | - | - | 38.51 | - | |
| Soybean | Non-GM variety | - | - | 38.98 | 38.19 | - |
| Mon89788 | - | 39.31 | - | 39.19 | - | |
| GTS40-3-2 | - | - | - | - | 39.14 | |
| Rapeseed | GT73 | - | - | - | 39.05 | - |
| Beet | Non-GM variety | 39.36/38.50/38.42 | - | 38.16/39.81/38.19 | 38.28/37.99/37.43 | 39.98 |
| H7-1 | - | - | 39.28 | - | - | |
| Tomato | Non-GM variety | - | - | 39.94/37.68 | - | - |
| Oat | Non-GM variety | - | - | 38.03 | - | - |
| Barley | Non-GM variety | - | - | 38.29 | - | - |
| Tobacco | Non-GM variety | - | - | 36.58/37.48/38.54 | - | - |
| Cauliflower | Non-GM variety | - | - | 39.49 | 38.19 | - |
| Potato | Non-GM variety | - | - | 39.55 | 39.35 | - |
| Buck wheat | Non-GM variety | - | - | 39.26 | 39.24 | 39.28 |
| Arabidopsis | Non-GM variety | - | - | 39.32/39.51 | 37.27/38.30/37.68 | - |
| Rice | Kefeng 6 | 30.11/30.09/29.92 | 33.86/34.21/34.43 | 30.16/30.00/30.07 | 29.79/29.88/29.67 | 31.02/30.76/31.43 |
| ‘-’ means data are not available. Species with no Ct values for all the genes are not shown. | ||||||
| Variety | PLD | SPS | PEPC |
| Huahui 1 | 26.98 | 29.44 | 27.77 |
| II Kefeng 6 | 27.01 | 29.49 | 27.73 |
| II Minghui 86 | 26.58 | 29.08 | 27.32 |
| Shanyou 10 | 27.27 | 29.97 | 28.08 |
| Wan 21B | 27.45 | 29.94 | 28.15 |
| Shanyou 63 | 27.10 | 29.80 | 27.69 |
| Kangyou 97 | 27.01 | 29.61 | 27.62 |
| 80-4B | 27.28 | 29.98 | 27.99 |
| Minghui 86 | 26.15 | 28.56 | 27.01 |
| Bar 68-1 | 26.58 | 29.11 | 27.47 |
| Donglong | 26.60 | 29.10 | 27.29 |
| Kefeng 6 | 26.50 | 29.22 | 27.41 |
| Minghui 63 | 27.04 | 29.82 | 28.12 |
| Songjing 6 | 26.09 | 29.32 | 27.51 |
| Zhonghua 11 | 26.66 | 29.31 | 27.56 |
| Zhongzuo 58 | 27.27 | 29.78 | 27.91 |
| Sanjiang 1 | 27.17 | 29.52 | 27.82 |
| Liaojing 371 | 27.05 | 29.57 | 27.59 |
| Average | 26.92 | 29.48 | 27.67 |
| SD value | 0.34 | 0.38 | 0.31 |
| RSD (%) | 1.26 | 1.29 | 1.13 |
| RSD, Relative standard deviation. | |||
Table 6 Intraspecific specificity (Ct values) of the three endogenous reference genes among 18 rice varieties using real-time PCR.
| Variety | PLD | SPS | PEPC |
| Huahui 1 | 26.98 | 29.44 | 27.77 |
| II Kefeng 6 | 27.01 | 29.49 | 27.73 |
| II Minghui 86 | 26.58 | 29.08 | 27.32 |
| Shanyou 10 | 27.27 | 29.97 | 28.08 |
| Wan 21B | 27.45 | 29.94 | 28.15 |
| Shanyou 63 | 27.10 | 29.80 | 27.69 |
| Kangyou 97 | 27.01 | 29.61 | 27.62 |
| 80-4B | 27.28 | 29.98 | 27.99 |
| Minghui 86 | 26.15 | 28.56 | 27.01 |
| Bar 68-1 | 26.58 | 29.11 | 27.47 |
| Donglong | 26.60 | 29.10 | 27.29 |
| Kefeng 6 | 26.50 | 29.22 | 27.41 |
| Minghui 63 | 27.04 | 29.82 | 28.12 |
| Songjing 6 | 26.09 | 29.32 | 27.51 |
| Zhonghua 11 | 26.66 | 29.31 | 27.56 |
| Zhongzuo 58 | 27.27 | 29.78 | 27.91 |
| Sanjiang 1 | 27.17 | 29.52 | 27.82 |
| Liaojing 371 | 27.05 | 29.57 | 27.59 |
| Average | 26.92 | 29.48 | 27.67 |
| SD value | 0.34 | 0.38 | 0.31 |
| RSD (%) | 1.26 | 1.29 | 1.13 |
| RSD, Relative standard deviation. | |||
| Gene | Parameter | Ct value | R2 | Efficiency (%) | |||||
| 50 ng (1.06 × 10⁵) | 5 ng (1.06 × 10⁴) | 0.5 ng (1.06 × 10³) | 0.05 ng (106) | 0.005 ng (10.6) | 0.0025 ng (5.03) | ||||
| PLD | Mean ± SD | 21.90 ± 0.10 | 25.27 ± 0.08 | 28.64 ± 0.13 | 32.11 ± 0.10 | 35.41 ± 0.59 | 37.09 ± 0.75 | 0.997 | 94.90 |
| RSD | 0.432 | 0.314 | 0.469 | 0.299 | 1.665 | 2.015 | |||
| SPS | Mean ± SD | 25.05 ± 0.02 | 28.05 ± 0.15 | 31.45 ± 0.10 | 34.81 ± 0.16 | 37.85 ± 0.17 | 39.29 ± 0.30 | 0.998 | 101.90 |
| RSD | 0.061 | 0.054 | 0.322 | 0.468 | 0.451 | 0.775 | |||
| PEPC | Mean ± SD | 21.17 ± 0.01 | 24.55 ± 0.08 | 28.06 ± 0.01 | 31.34 ± 0.12 | 34.79 ± 0.25 | 35.86 ± 0.23 | 0.999 | 96.90 |
| RSD | 0.047 | 0.333 | 0.036 | 0.373 | 0.725 | 0.064 | |||
| RSD, Relative standard deviation. Data in the parenthesis are the copy number of DNA. | |||||||||
Table 7 Quantitative detection sensitivity of the three endogenous reference genes.
| Gene | Parameter | Ct value | R2 | Efficiency (%) | |||||
| 50 ng (1.06 × 10⁵) | 5 ng (1.06 × 10⁴) | 0.5 ng (1.06 × 10³) | 0.05 ng (106) | 0.005 ng (10.6) | 0.0025 ng (5.03) | ||||
| PLD | Mean ± SD | 21.90 ± 0.10 | 25.27 ± 0.08 | 28.64 ± 0.13 | 32.11 ± 0.10 | 35.41 ± 0.59 | 37.09 ± 0.75 | 0.997 | 94.90 |
| RSD | 0.432 | 0.314 | 0.469 | 0.299 | 1.665 | 2.015 | |||
| SPS | Mean ± SD | 25.05 ± 0.02 | 28.05 ± 0.15 | 31.45 ± 0.10 | 34.81 ± 0.16 | 37.85 ± 0.17 | 39.29 ± 0.30 | 0.998 | 101.90 |
| RSD | 0.061 | 0.054 | 0.322 | 0.468 | 0.451 | 0.775 | |||
| PEPC | Mean ± SD | 21.17 ± 0.01 | 24.55 ± 0.08 | 28.06 ± 0.01 | 31.34 ± 0.12 | 34.79 ± 0.25 | 35.86 ± 0.23 | 0.999 | 96.90 |
| RSD | 0.047 | 0.333 | 0.036 | 0.373 | 0.725 | 0.064 | |||
| RSD, Relative standard deviation. Data in the parenthesis are the copy number of DNA. | |||||||||
| Sample | Gene | Positive Number | Average | |||
|---|---|---|---|---|---|---|
| 1 | 2 | 3 | 4 | |||
| Huahui 1 | RBE4 | 1142 | 1136 | 1104 | 1109 | 1122.75 |
| PEPC | 1276 | 1251 | 1249 | 1234 | 1252.5 | |
| Wan 21B | RBE4 | 1006 | 1014 | 1036 | 1033 | 1022.25 |
| PEPC | 989 | 975 | 992 | 1005 | 990.25 | |
Supplemetnal Table 2 Digital PCR results of the RBE4 and PEPC genes.
| Sample | Gene | Positive Number | Average | |||
|---|---|---|---|---|---|---|
| 1 | 2 | 3 | 4 | |||
| Huahui 1 | RBE4 | 1142 | 1136 | 1104 | 1109 | 1122.75 |
| PEPC | 1276 | 1251 | 1249 | 1234 | 1252.5 | |
| Wan 21B | RBE4 | 1006 | 1014 | 1036 | 1033 | 1022.25 |
| PEPC | 989 | 975 | 992 | 1005 | 990.25 | |
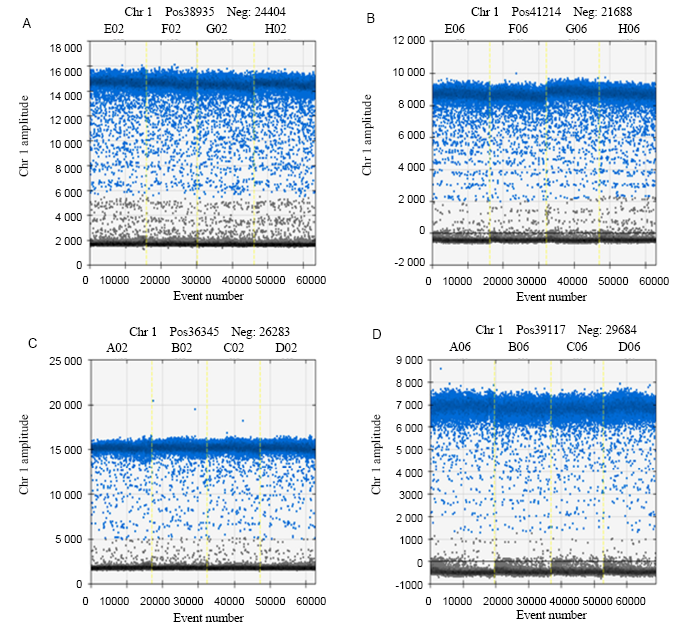
Fig. 2. Schematic digital PCR results of the two rice samples. A, RBE4 PCR result of Huahui 1. B, PEPC result of Huahui 1. C, RBE4 PCR result of rice Wan 21B. D, PEPC result of Wan 21B.
| [1] | Bawa A S, Anilakumar K R.2013. Genetically modified foods: Safety, risks and public concerns: A review.J Food Sci Technol, 50(6): 1035-1046. |
| [2] | Chaouachi M, Alaya A, Ali I B H, Hafsa A B, Nabi N, Bérard A, Romaniuk M, Skhiri F, Saïd K.2013. Development of real-time PCR method for the detection and the quantification of a new endogenous reference gene in sugar beet “Beta vulgaris L.”: GMO application. Plant Cell Rep, 32(1): 117-128. |
| [3] | Chen H Y, Liang X M, Chen S X, Wang Z H, Li L, Huang W S, Hu X Z, Zhu S F, Chen H J.2010. Entry-exit inspection and quarantine industry standard of P.R. China for the detection of GM rice (SN/T 2584-2010): Protocol of real time polymerase chain reaction for detecting genetically modified components in rice and its derived products. Beijing: Chinese Standard Publishing. |
| [4] | Cheng N, Shang Y, Xu Y C, Zhang L, Luo Y B, Huang K L, Xu W T.2017. On-site detection of stacked genetically modified soybean based on event-specific TM-LAMP and a DNAzyme- lateral flow biosensor.Biosens Bioelectron, 91: 408-416. |
| [5] | Ding J Y, Jia J W, Yang L T, Wen H B, Zhang C M, Liu W X, Zhang D B.2004. Validation of a rice specific gene, sucrose phosphate synthase, used as the endogenous reference gene for qualitative and real-time quantitative PCR detection of transgenes.J Agric Food Chem, 52(11): 3372-3377. |
| [6] | Gryson N.2010. Effect of food processing on plant DNA degradation and PCR-based GMO analysis: A review.Anal Bioanal Chem, 396(6): 2003-2022. |
| [7] | Hernández M, Esteve T, Pla M.2005. Real-time polymerase chain reaction based assays for quantitative detection of barley, rice, sunflower, and wheat.J Agric Food Chem, 53(18): 7003-7009. |
| [8] | Jeong S C, Pack I S, Cho E Y, Youk E S, Park S, Yoon W K, Kim C G, Choi Y D, Kim J K, Kim H M.2007. Molecular analysis and quantitative detection of a transgenic rice line expressing a bifunctional fusion TPSP.Food Control, 18(11): 1434-1442. |
| [9] | Jiang L X, Yang L T, Zhang H B, Guo J C, Mazzara M, van den E G, Zhang D B.2009. International collaborative study of the endogenous reference gene,sucrose phosphate synthase (SPS), used for qualitative and quantitative analysis of genetically modified rice. J Agric Food Chem, 57(9): 3525-3532. |
| [10] | Jin S B, Jin W W, Ding Y, Song Y C.2000. Genomic homology comparison of maize and rice usingin situ hybridization. Chin Sci Bull, 45(22): 2431-2434. (in Chinese with English abstract) |
| [11] | JRC (Joint Research Centre). 2006. Event-specific method for the quantitation of rice line LLRICE62 using real-time PCR . Community Reference Laboratory for GM Food andFeed. Italy. |
| [12] | Kou J P, Tang Q L, Zhang X F.2015. Agricultural GMO safety administration in China.J Integr Agric, 14(11): 2157-2165. |
| [13] | Li Y H, Peng Y F, Hallerman E M, Wu K M.2014. Biosafety management and commercial use of genetically modified crops in China.Plant Cell Rep, 33(4): 565-573. |
| [14] | Pray C, Huang J, Hu R F, Deng H Y, Yang J, Morin X K.2018. Prospects for cultivation of genetically engineered food crops in China.Glob Food Secur AGR, 16: 133-137. |
| [15] | Shang Y, Zhu P Y, Xu W T, Guo T X, Tian W Y, Luo Y B, Huang K L.2013. Single universal primer multiplex ligation-dependent probe amplification with sequencing gel electrophoresis analysis.Anal Biochem, 443(2): 243-248. |
| [16] | Wang F, Dang C, Chang X F, Tian J C, Lu Z B, Chen Y, Ye G Y.2017. Variation among conventional cultivars could be used as a criterion for environmental safety assessment ofBt rice on nontarget arthropods. Sci Rep, 7: 41918. |
| [17] | Wang W X, Zhu T H, Lai F X, Fu Q.2011. Event-specific qualitative and quantitative detection of transgenic rice Kefeng-6 by characterization of the transgene flanking sequence.Eur Food Res Technol, 232(2): 297-305. |
| [18] | Wu G, Zhang L, Wu Y H, Cao Y L, Lu C M.2010. Comparison of Five endogenous reference genes for specific PCR detection and quantification ofBrassica napus. J Agric Food Chem, 58(5): 2812-2817. |
| [19] | Xu W T, Bai W B, Guo F, Luo Y B, Yuan Y F, Huang K L.2008. A papaya-specific gene,papain, used as an endogenous reference gene in qualitative and real-time quantitative PCR detection of transgenic papayas. Eur Food Res Technol, 228: 301. |
| [20] | Xu W T, Shang Y, Zhu P Y, Zhai Z F, He J, Huang K L, Luo Y B.2013. Randomly broken fragment PCR with 5′ end-directed adaptor for genome walking.Sci Rep, 3: 3465. |
| [21] | Yang L T, Pan A H, Jia J W, Ding J Y, Chen J X, Cheng H, Zhang C M, Zhang D B.2005. Validation of a tomato-specific gene,LAT52, used as an endogenous reference gene in qualitative and real-time quantitative PCR detection of transgenic tomatoes. J Agric Food Chem, 53(2): 183-190. |
| No related articles found! |
| 阅读次数 | ||||||
|
全文 |
|
|||||
|
摘要 |
|
|||||