
Rice Science ›› 2020, Vol. 27 ›› Issue (6): 480-492.DOI: 10.1016/j.rsci.2020.09.005
收稿日期:2019-09-20
接受日期:2020-03-24
出版日期:2020-11-28
发布日期:2020-11-28
. [J]. Rice Science, 2020, 27(6): 480-492.
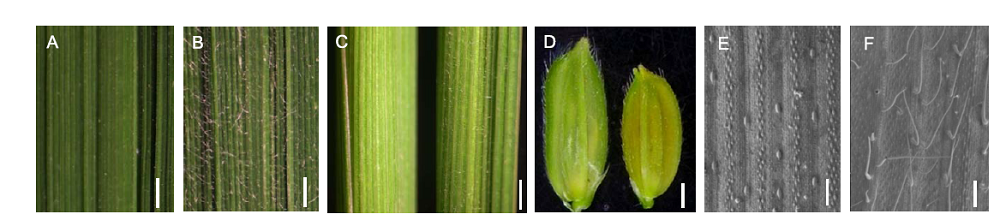
Fig. 1. Phenotypes of trichomes in Nipponbare and Suwangwasnger (SWWR). A, Adaxial leaf of Nipponbare. B, Adaxial leaf of SWWR. C, Leaf sheaths of Nipponbare (Left) and SWWR (Right). D, Grain hulls of Nipponbare (Left) and SWWR (Right). E, Adaxial leaf of Nipponbare under scanning election microscope. F, Adaxial leaf of SWWR under SEM. Scale bars in A, B, C and D, 1 mm. Scale bars in E and F, 500 μm.
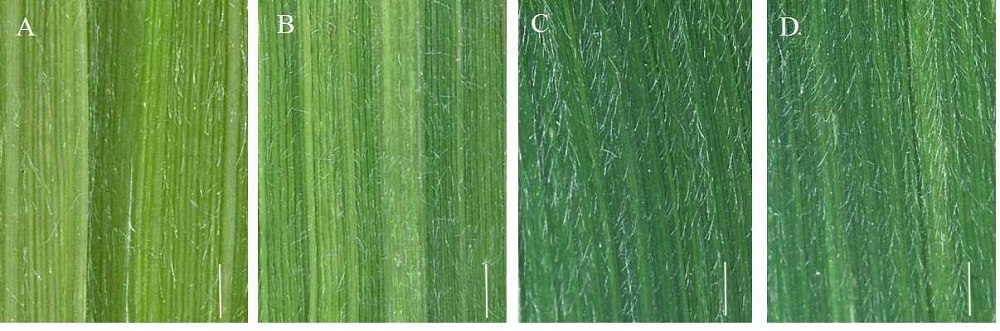
Supplemental Fig. 1. Trichomes at different leaf positions in the tillering stage under stereoscope. A represents SWWR -0.5 leaves. B represents SWWR 0.5 leaves. C represents SWWR 1.5 leaves. D represents SWWR 2.5 leaves. Scale bar, 1mm.
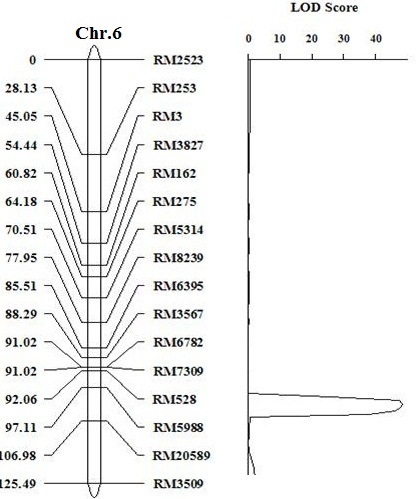
Supplemental Fig. 2. Genetic linkage map of HL6 SWWR on chromosome 6. The numerals in left column represent the genetic distance. The numerals in right column represent SSR marker names. The HL6SWWR gene is located between markers RM528 and RM5988.
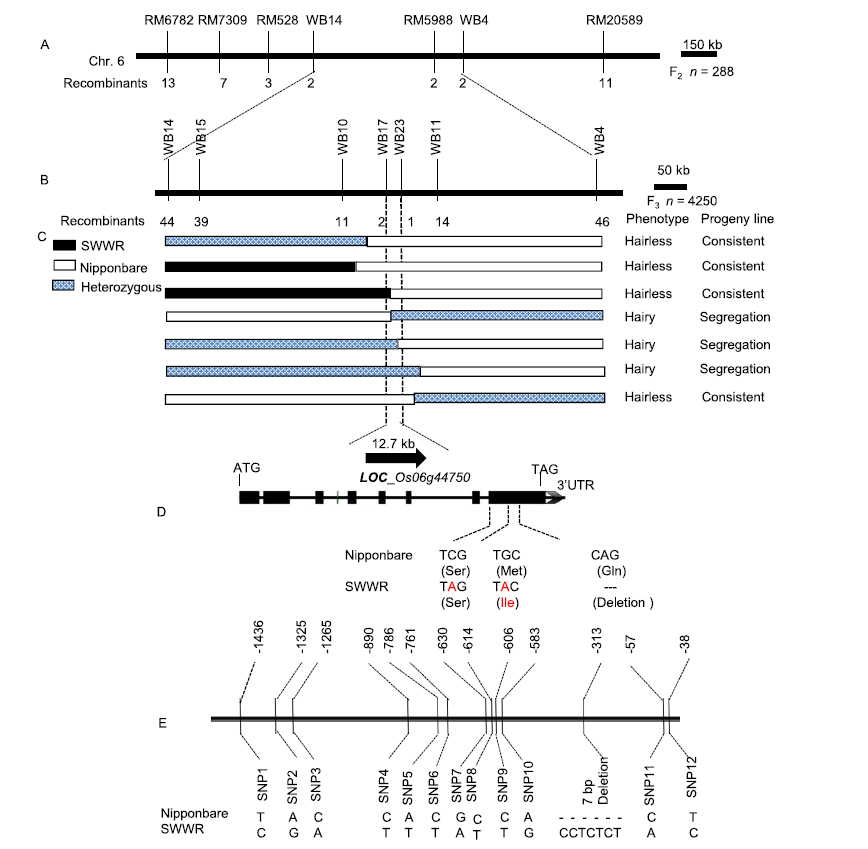
Fig. 2. Map-based cloning and mutation site analysis of HL6SWWR. A, Primary mapping of HL6SWWR locus using 288 F2 plants. B, Fine mapping of HL6SWWR locus using 4 250 plants. C, High-resolution linkage analysis of the HL6SWWR locus and open reading frame in the target region on Rice Genome Annotation Project (RGAP). D, Different sites of HL6 coding sequence and amino acid sequence (in brackets) between Nipponbare and Suwangwanger (SWWR). E, Promoter sequence of 1 500 bp upstream of HL6SWWR transcription initiation site comparing with that of Nipponbare. The relative positions of the variations are given with respect to the start codon (ATG).
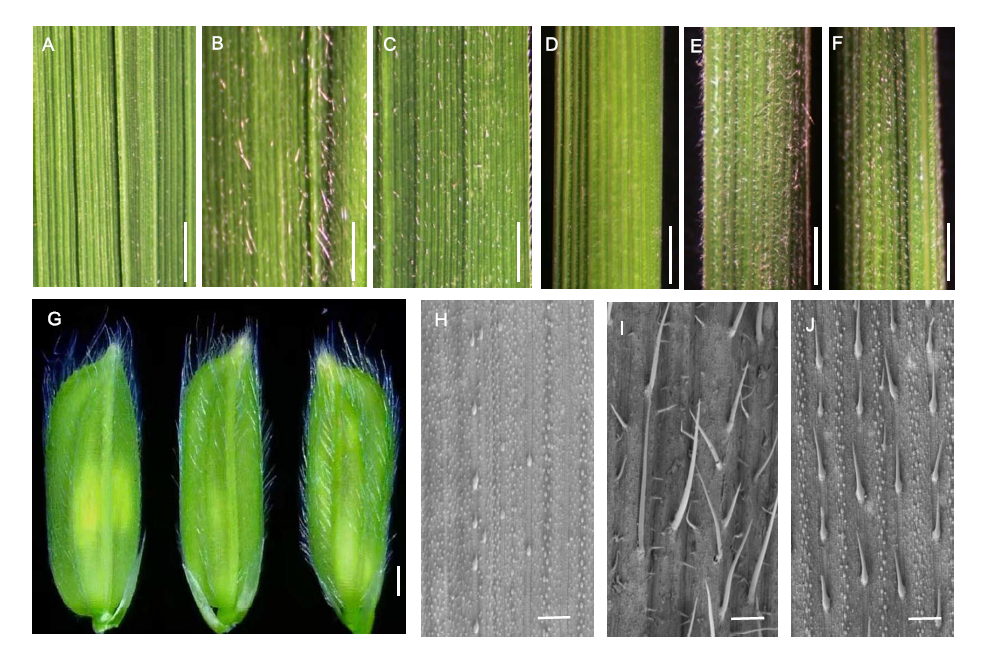
Fig. 3. Trichome characteristics of HL6SWWR complementary transgenic plants. A to C, Adaxial leaves of wild type (WT) Nipponbare, complementary transgenic line 1 (CP1-1) and complementary transgenic line 2 (CP1-2), respectively. Scale bars, 1 mm. D to F, Leaf sheaths of WT, CP1-1 and CP1-2, respectively. Scale bars, 1 mm. G, Grain hulls of WT (Left), CP1-1 (Middle) and CP1-2 (Right), respectively. Scale bar, 1 mm. H to J, Adaxial leaves under scamming electron microscopy of WT, CP1-1 and CP1-2, respectively. Scale bars, 500 μm.
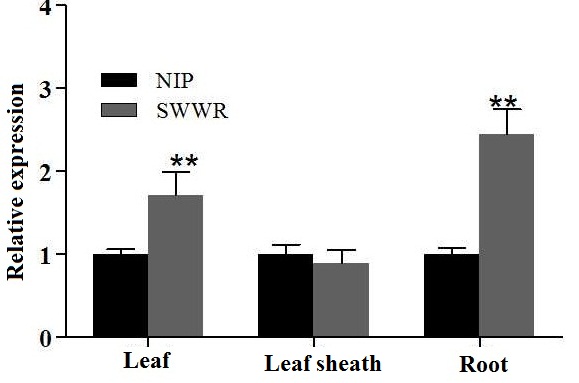
Supplemental Fig. 3. Relative expression of HL6 in leaf, leaf sheath and root in three leaf stage of two parents. Asterisks indicate significant difference at P < 0.01 by t test. Error bars represent SD with triplicates.
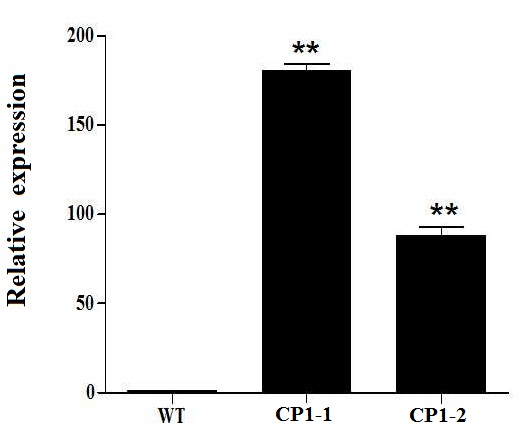
Supplemental Fig. 4. Expression level of HL6SWWR complementary transgenic plants. WT represent wild type, CP1-1, CP1-2 are the transgenic line number. The macro-hair of CP1-1 is longer than CP1-2. Asterisks indicate significant difference at P < 0.01 by t test. Error bars represent SD with triplicates.
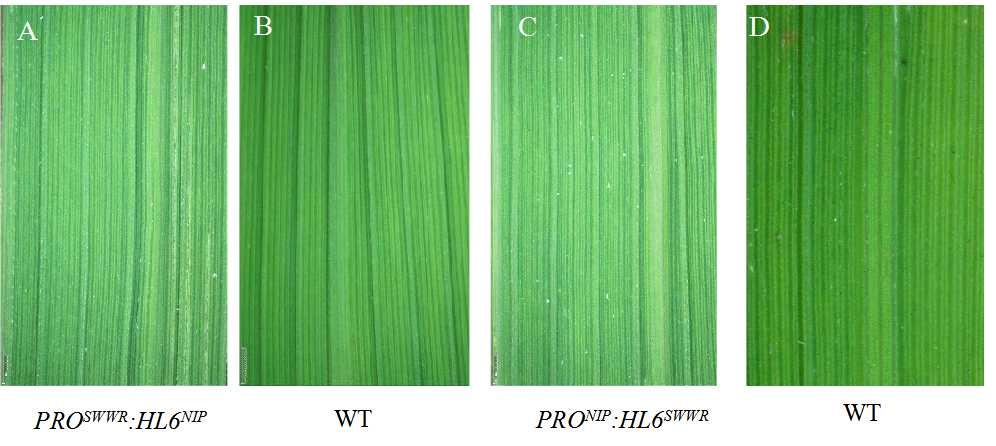
Supplemental Fig. 5. Leaf phenotype of adaxial leaf surface in transgenic plants under stereoscope. A and C represent adaxial leaf surfaces of PROSWWR:HL6NIP and PRONIP:HL6SWWR transgenic plants, respectively. B and D represent adaxial leaf surfaces of wild type. Scale bar, 1mm.
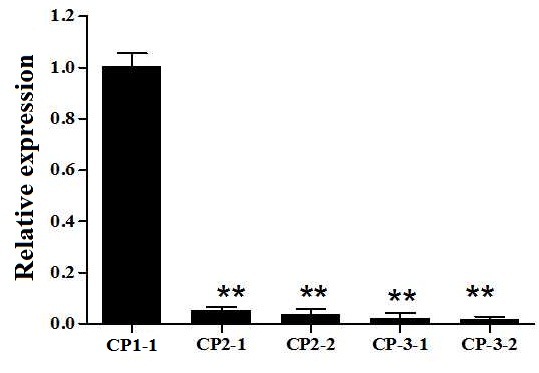
Supplemental Fig. 6. Relative expression of HL6 in the transgenic lines. CP1 represents PROSWWR:HL6SWWR complementary transgenic plant. CP2-1 and CP2-2 refer to two transgenic lines with the vector PRONIP:HL6SWWR. CP3-1 and CP3-2 refer to two transgenic lines with the vector PROSWWR:HL6NIP.Asterisks indicate significant difference at P < 0.01 by t test. Error bars represent SD with triplicates.
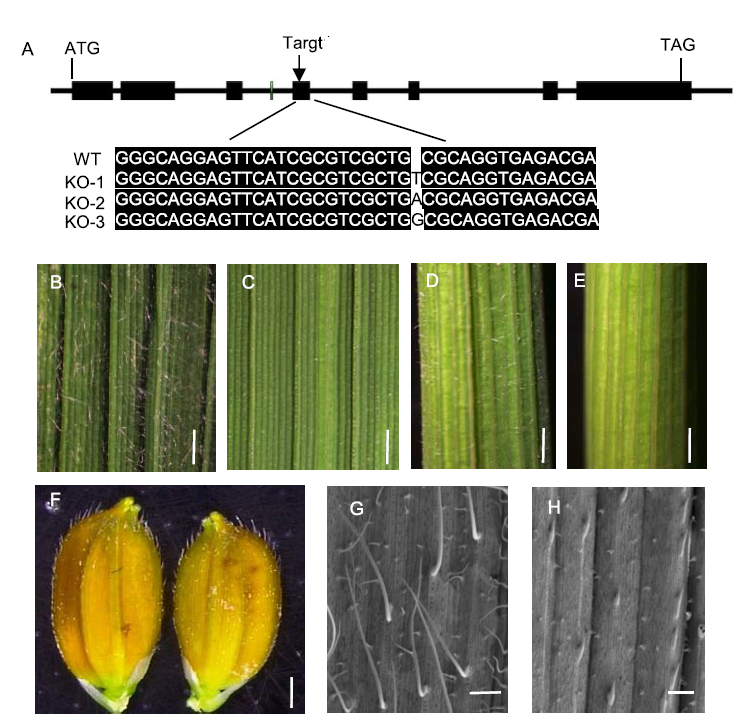
Fig. 4. Trichome characteristics of knock-out (KO) mutant hl6SWWR under Suwangwanger (SWWR) background. A, Schematic diagram of the target site in HL6SWWR genome sequence and HL6 sequence alignment between KO mutant and wild type (WT). B and D, Adaxial leaf and leaf sheath of WT. Scale bars, 1 mm. C and E, Adaxial leaf and leaf sheath of KO mutant hl6SWWR. Scale bars, 1 mm. F, Grain hull of KO mutant hl6SWWR (right) and its wild type (left). Scale bar, 1 mm. G and H, Adaxial leaf under scanning electron microscopy of WT and KO mutant hl6SWWR, respectively. Scale bars, 500 μm.
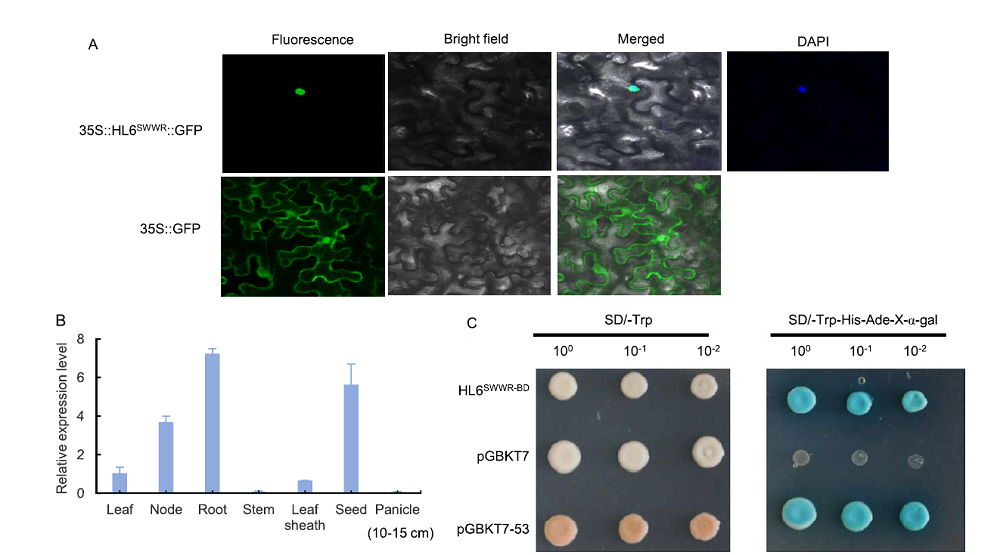
Fig. 5. Subcellular localization, expression pattern and transcriptional activity analysis of HL6SWWR. A, Subcellular localization of HL6SWWR in nuclei. Tobacco leaves were used for subcellular localization. 35S:HL6SWWR:GFP represents HL6SWWR and GFP fusion protein. 35S:GFP represents the control. B, Real-time PCR analyses of HL6SWWR in SWWR different tissues. Actin was used as the internal control. Bars represent SD (n = 3). C, HL6SWWR has transcription-activation activity in yeast. HL6SWWR coding sequence was cloned into the vector pGBKT7. pGBKT7-53 was used as a positive control. Transformed yeast was serially diluted and placed on SD screening plates.
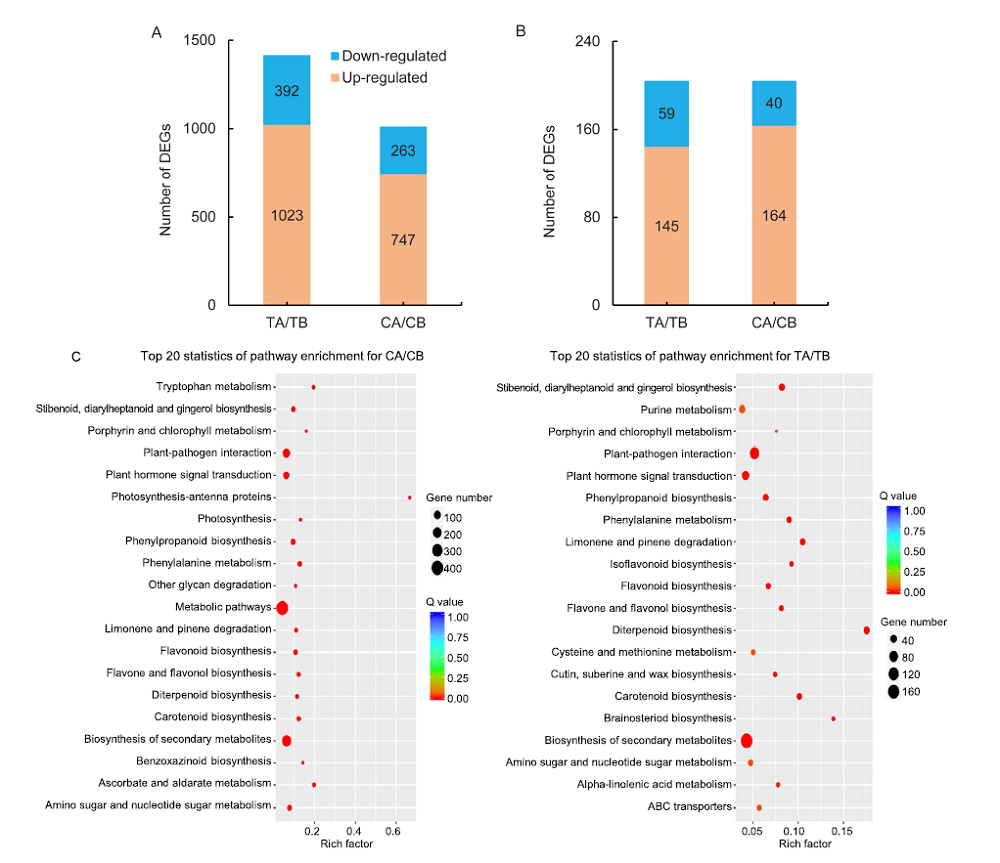
Fig. 6. Scatter-plot of enriched KEGG pathways for differentially expressed genes (DEGs). A, DEGs in the groups of hl6SWWR (TA) / wild type Suwangwanger (SWWR) (TB) and complementary line HL6SWWR (CA) / wild type Nipponbare (CB). B, DEGs shared by the two groups. C, Scatter-plot of enriched KEGG pathways for DEGs in TA/TB and CA/CB. Q value is the P value after multiple hypothesis test correction. The value of Q is [0, 1]. The closer to zero, the more significant the enrichment. Rich-factor refers to the ratio of the number of DEGs enriched in the pathway to the number of genes annotated into the pathway gene. The larger the rich-factor, the greater the degree of enrichment.
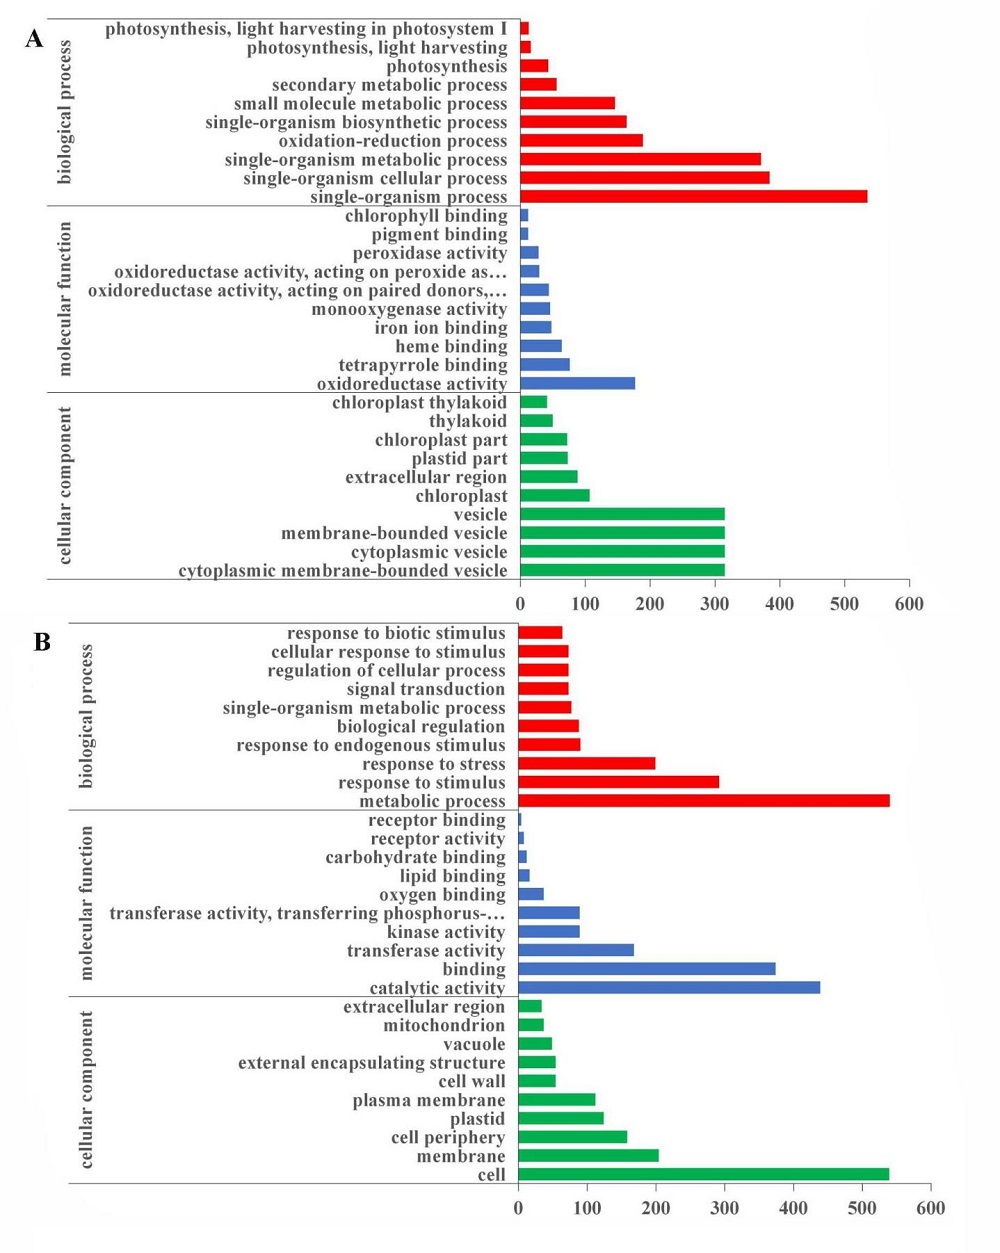
Supplemental Fig. 7. GO enrichment analysis for differentially expressed genes. A, Gene Ontology enrichment for differentially expressed genes in hl6SWWR mutant and wild type SWWR plants. B, Gene Ontology enrichment for differentially expressed genes in HL6SWWR complementary transgenic and wild type Nipponbare plants. The x-axis refers to the number of genes annotated by the GO term. The y-axis represents GO classification including Biological Process, Cellular Component and Molecular Function.
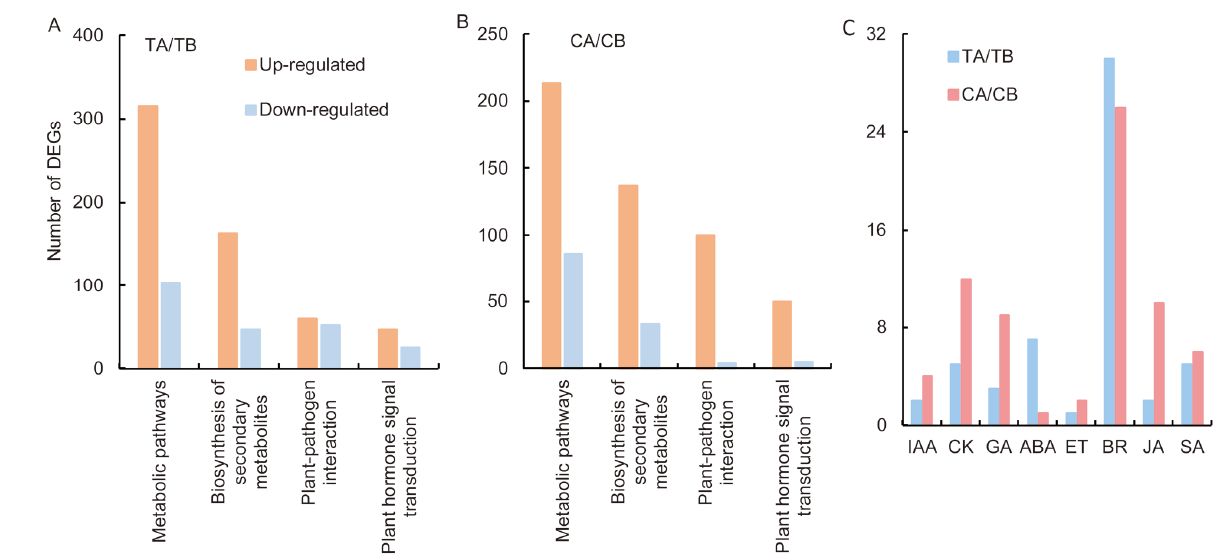
Fig. 7. Analysis of differential expression gene (DEGs) in different pathway. A, DEGs in the hl6SWWR (TA) / Suwangwanger (SWWR) (TB) group. B, DEGs in the HL6SWWR complementary transgenic plant (CA) / wild type Nipponbare (CB). C, DEGs involved in different phytohormone signal transduction pathway. IAA, Auxin; CK, Cytokine; GA, Gibberellic acid; ABA, Abscisic acid; ET, Ethylene; BR, Brassinosteroid; JA, Jasmonic acid; SA, Salicylic acid.
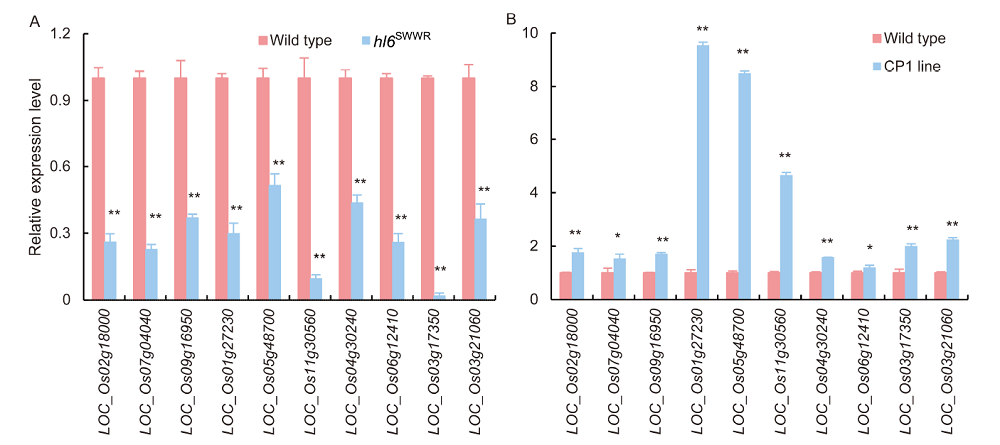
Fig. 8. Validation of RNA-seq results by qRT-PCR. A, qRT-PCR was conducted in hl6SWWR mutants and WT plants. B, qRT-PCR was conducted in HL6SWWR complementary transgenic (CP1) line and WT plants. Ten DEGs were selected to be tested by qRT-PCR. Actin gene was used as the internal control. Bars are SD of three independent replicates. * and ** represent significant differences at the 0.05 and 0.01 levels, respectively.
| [1] | An L J, Zhou Z J, Su S, Yan A, Gan Y B.2012. GLABROUS INFLORESCENCE STEMS (GIS) is required for trichome branching through gibberellic acid signaling in Arabidopsis. Plant Cell Physiol, 53(2): 457-469. |
| [2] | Angeles-Shim R B, Asano K, Takashi T, Shim J, Kuroha T, Ayano M, Ashikari M.2012. A WUSCHEL-related homeobox 3B gene,depilous (dep), confers glabrousness of rice leaves and glumes. Rice, 5(1): 28. |
| [3] | Balkunde R, Pesch M, Hulskamp M.2010. Trichome patterning in Arabidopsis thaliana from genetic to molecular models. Curr Top Dev Biol, 91: 299-321. |
| [4] | Bernhardt C, Zhao M Z, Gonzalez A, Lloyd A, Schiefelbein J.2005. The bHLH genes GL3 and EGL3 participate in an intercellular regulatory circuit that controls cell patterning in the Arabidopsis root epidermis. Development, 132(2): 291-298. |
| [5] | Cheng J P, Wang L, Du W L, Lai Y Y, Huang X, Wang Z F, Zhang H S.2014. Dynamic quantitative trait locus analysis of seed dormancy at three development stages in rice. Mol Breeding, 34(2): 501-510. |
| [6] | Gan L J, Xia K, Chen J G, Wang S C.2011. Functional characterization of TRICHOMELESS2, a new single-repeat R3 MYB transcription factor in the regulation of trichome patterning in Arabidopsis. BMC Plant Biol, 11: 176. |
| [7] | Gan Y B, Liu C, Yu H, Broun P.2007. Integration of cytokinin and gibberellin signalling by Arabidopsis transcription factors GIS, ZFP8 and GIS2 in the regulation of epidermal cell fate. Development, 134(11): 2073-2081. |
| [8] | Gao S H, Gao Y N, Xiong C, Yu G, Chang J, Yang Q H, Yang C X, Ye Z B.2017. The tomato B-type cyclin gene, SlCycB2, plays key roles in reproductive organ development, trichome initiation, terpenoids biosynthesis and Prodenia litura defense. Plant Sci, 262: 103-114. |
| [9] | Glas J J, Schimmel B C J, Alba J M, Escobar-Bravo R, Schuurink R C, Kant M R.2012. Plant glandular trichomes as targets for breeding or engineering of resistance to herbivores. Int J Mol Sci, 13(12): 17077-17103. |
| [10] | Glover B J, Perez-Rodriguez M, Martin C.1998. Development of several epidermal cell types can be specified by the same MYB- related plant transcription factor. Development, 125(17): 3497-3508. |
| [11] | Huchelmann A, Boutry M, Hachez C.2017. Plant glandular trichomes: Natural cell factories of high biotechnological interest. Plant Physiol, 175(1): 6-22. |
| [12] | Ivakov A, Persson S.2013. Plant cell shape: Modulators and measurements. Front Plant Sci, 4: 439. |
| [13] | Kang J H, McRoberts J, Shi F, Moreno J E, Jones A D, Howe G A.2014. The flavonoid biosynthetic enzyme chalcone isomerase modulates terpenoid production in glandular trichomes of tomato. Plant Physiol, 164(3): 1161-1174. |
| [14] | Kim D, Pertea G, Trapnell C, Pimentel H, Kelley R, Salzberg S L.2013. TopHat2: Accurate alignment of transcriptomes in the presence of insertions, deletions and gene fusions. Genom Biol, 14(4): R36. |
| [15] | Kirik V, Simon M, Huelskamp M, Schiefelbein J.2004a. The ENHANCER OF TRY AND CPC1 gene acts redundantly with TRIPTYCHON and CAPRICE in trichome and root hair cell patterning in Arabidopsis. Dev Biol, 268(2): 506-513. |
| [16] | Kirik V, Simon M, Wester K, Schiefelbein J, Hulskamp M.2004b. ENHANCER of TRY and CPC 2 (ETC2) reveals redundancy in the region-specific control of trichome development of Arabidopsis. Plant Mol Biol, 55(3): 389-398. |
| [17] | Li B, Dewey C N.2011. RSEM: Accurate transcript quantification from RNA-Seq data with or without a reference genome. BMC Bioinf, 12: 323. |
| [18] | Li J J, Yuan Y D, Lu Z F, Yang L S, Gao R C, Lu J G, Li J Y, Xiong G S.2012. Glabrous Rice 1, encoding a homeodomain protein, regulates trichome development in rice. Rice, 5: 32. |
| [19] | Li Q, Cao C X, Zhang C J, Zheng S S, Wang Z H, Wang L N, Ren Z H.2015. The identification of Cucumis sativus Glabrous 1 (CsGL1) required for the formation of trichomes uncovers a novel function for the homeodomain-leucine zipper I gene. J Exp Bot, 66(9): 2515-2526. |
| [20] | Li W Q, Wu J G, Weng S L, Zhang D P, Zhang Y J, Shi C H.2010. Characterization and fine mapping of the glabrous leaf and hull mutants (gl1) in rice(Oryza sativa L.). Plant Cell Rep, 29(6): 617-627. |
| [21] | Ma X L, Zhang Q Y, Zhu Q L, Liu W, Chen Y, Qiu R, Wang B, Yang Z F, Li H Y, Lin Y R, Xie Y Y, Shen R X, Chen S F, Wang Z, Chen Y L, Guo J X, Chen L T, Zhao X C, Dong Z C, Liu Y G.2015. A robust CRISPR/Cas9 system for convenient, high-efficiency multiplex genome editing in monocot and dicot plants. Mol Plant, 8(8): 1274-1284. |
| [22] | Morohashi K, Zhao M Z, Yang M L, Read B, Lloyd A, Lamb R, Grotewold E.2007. Participation of the Arabidopsis bHLH factor GL3 in trichome initiation regulatory events. Plant Physiol, 145(3): 736-746. |
| [23] | Morohashi K, Grotewold E.2009. A systems approach reveals regulatory circuitry for Arabidopsis trichome initiation by the GL3 and GL1 selectors. PLoS Genet, 5(2): e1000396. |
| [24] | Murray M G, Thompson W F.1980. Rapid isolation of high molecular weight plant DNA. Nucl Acids Res, 8(19): 4321-4325. |
| [25] | Patra B, Pattanaik S, Yuan L.2013. Ubiquitin protein ligase 3 mediates the proteasomal degradation of GLABROUS 3 and ENHANCER OF GLABROUS 3, regulators of trichome development and flavonoid biosynthesis in Arabidopsis. Plant J, 74(3): 435-447. |
| [26] | Pattanaik S, Patra B, Singh S K, Yuan L.2014. An overview of the gene regulatory network controlling trichorne development in the model plant, Arabidopsis. Front Plant Sci, 5: 259. |
| [27] | Payne C T, Zhang F, Lloyd A M.2000. GL3 encodes a bHLH protein that regulates trichome development in Arabidopsis through interaction with GL1 and TTG1. Genetics, 156(3): 1349-1362. |
| [28] | Qi T C, Song S S, Ren Q C, Wu D W, Huang H, Chen Y, Fan M, Peng W, Ren C M, Xie D X.2011. The jasmonate-ZIM-domain proteins interact with the WD-Repeat/bHLH/MYB complexes to regulate jasmonate-mediated anthocyanin accumulation and trichome initiation in Arabidopsis thaliana. Plant Cell, 23(5): 1795-1814. |
| [29] | Rios-Estepa R, Turner G W, Lee J M, Croteau R B, Lange B M.2008. A systems biology approach identifies the biochemical mechanisms regulating monoterpenoid essential oil composition in peppermint. Proc Natl Acad Sci USA, 105(8): 2818-2823. |
| [30] | Schilmiller A L, Last R L, Pichersky E.2008. Harnessing plant trichome biochemistry for the production of useful compounds. Plant J, 54(4): 702-711. |
| [31] | Sun L L, Zhang A D, Zhou Z J, Zhao Y Q, Yan A, Bao S J, Yu H, Gan Y B.2015. GLABROUS INFLORESCENCE STEMS3 (GIS3) regulates trichome initiation and development in Arabidopsis. New Phytol, 206(1): 220-230. |
| [32] | Sun W Q, Gao D W, Xiong Y, Tang X X, Xiao X F, Wang C R, Yu S B.2017. Hairy Leaf 6, an AP2/ERF transcription factor, interacts with OsWOX3B and regulates trichome formation in rice. Mol Plant, 10(11): 1417-1433. |
| [33] | Sun Y, Fokar M, Asami T, Yoshida S, Allen R D.2004. Characterization of the brassinosteroid insensitive 1 genes of cotton. Plant Mol Biol, 54(2): 221-232. |
| [34] | Sun Y, Veerabomma S, Fokar M, Abidi N, Hequet E, Payton P, Allen R D.2015. Brassinosteroid signaling affects secondary cell wall deposition in cotton fibers. Ind Crop Prod, 65: 334-342. |
| [35] | Tan H X, Xiao L, Gao S H, Li Q, Chen J F, Xiao Y, Ji Q, Chen R B, Chen W S, Zhang L.2015. TRICHOME AND ARTEMISININ REGULATOR 1 is required for trichome development and artemisinin biosynthesis in Artemisia annua. Mol Plant, 8(9): 1396-1411. |
| [36] | Tominaga-Wada R, Ishida T, Wada T.2011. New insights into the mechanism of development of Arabidopsis root hairs and trichomes. Int Rev Cel Mol Biol, 286: 67-106. |
| [37] | Vernoud V, Laigle G, Rozier F, Meeley R B, Perez P, Rogowsky P M.2009. The HD-ZIP IV transcription factor OCL4 is necessary for trichome patterning and anther development in maize. Plant J, 59(6): 883-894. |
| [38] | Wang Y L, Nie J T, Chen H M, Guo C L, Pan J, He H L, Pan J S, Cai R.2016. Identification and mapping of Tril, a homeodomain-leucine zipper gene involved in multicellular trichome initiation in Cucumis sativus. Theor Appl Genet, 129(2): 305-316. |
| [39] | Wang Z, Yang Z R, Li F G.2019. Updates on molecular mechanisms in the development of branched trichome in Arabidopsis and nonbranched in cotton. Plant Biotechnol J, 17(9): 1706-1712. |
| [40] | Wei L H, Song P Z, Wang Y, Lu Z K, Tang Q, Yu Q, Xiao Y, Zhang X, Duan H C, Jia G F.2018. The m(6)A reader ECT2 controls trichome morphology by affecting mRNA stability in Arabidopsis. Plant Cell, 30(5): 968-985. |
| [41] | Werker E.2000. Trichome diversity and development. Adv Bot Res, 31: 1-35. |
| [42] | Xiang C Y, Liang X X, Chu R Z, Duan M, Cheng J P, Ding Z Q, Wang J F.2015. Fine mapping of a palea defective 1 (pd1), a locus associated with palea and stamen development in rice. Plant Cell Rep, 34(12): 2151-2159. |
| [43] | Xie C, Mao X Z, Huang J J, Ding Y, Wu J M, Dong S, Kong L, Gao G, Li C Y, Wei L P.2011. KOBAS 2.0: A web server for annotation and identification of enriched pathways and diseases. Nucl Acids Res, 39: 316-322. |
| [44] | Yang C X, Li H X, Zhang J H, Luo Z D, Gong P J, Zhang C J, Li J H, Wang T T, Zhang Y Y, Lu Y E, Ye Z B.2011. A regulatory gene induces trichome formation and embryo lethality in tomato. Proc Natl Acad Sci USA, 108(29): 11836-11841. |
| [45] | Young M D, Wakefield M J, Smyth G K, Oshlack A.2010. Gene ontology analysis for RNA-seq: Accounting for selection bias. Genome Biol, 11(2): R14. |
| [46] | Yu N, Cai W J, Wang S C, Shan C M, Wang L J, Chen X Y.2010. Temporal control of trichome distribution by microRNA156- targeted SPL genes in Arabidopsis thaliana. Plant Cell, 22(7): 2322-2335. |
| [47] | Zhang F, Gonzalez A, Zhao M Z, Payne C T, Lloyd A.2003. A network of redundant bHLH proteins functions in all TTG1-dependent pathways of Arabidopsis. Development, 130(20): 4859-4869. |
| [48] | Zhang H L, Wu K, Wang Y F, Peng Y, Hu F Y, Wen L, Han B, Qian Q, Teng S.2012. A WUSCHEL-like homeobox gene, OsWOX3B responses to NUDA/GL-1 locus in rice. Rice, 5(1): 30. |
| [49] | Zhang M, Zheng X L, Song S Q, Zeng Q W, Hou L, Li D M, Zhao J, Wei Y, Li X B, Luo M, Xiao Y H, Luo X Y, Zhang J F, Xiang C B, Pei Y.2011. Spatiotemporal manipulation of auxin biosynthesis in cotton ovule epidermal cells enhances fiber yield and quality. Nat Biotechnol, 29(5): 453-458. |
| [50] | Zhao M Z, Morohashi K, Hatlestad G, Grotewold E, Lloyd A.2008. The TTG1-bHLH-MYB complex controls trichome cell fate and patterning through direct targeting of regulatory loci. Development, 135(11): 1991-1999. |
| No related articles found! |
| 阅读次数 | ||||||
|
全文 |
|
|||||
|
摘要 |
|
|||||
