Received:2014-10-05
Revised:2015-02-11
Genetic Diversity and Population Structure in Landraces and Improved Rice Varieties from India
1State Level Biotechnology Centre, Mahatma Phule Agricultural University, Rahuri 413722, Ahmednagar, Maharashtra State, India
2Agricultural Research Station, Radhanagari 416212, Kolhapur, Maharashtra State, India
3Directorate of Sorghum Research, Rajendranagar 500031, Hyderabad, Telangana, India
4Agricultural Research Station, Lonavala 410401, Pune, Maharashtra State, India
Corresponding author: Pawan L. KULWAL (pawankulwal@gmail.com)
Rice (Oryza sativa L.) is a cereal foodstuff which forms an important part of more than three billion people around the world. It is the most essential and important food crop of the world and is popularly called as ‘ global grain’ . Because of its ability to adapt to a wider range of environmental conditions, it is one of the most diversified crop species (Chang, 1976).
Because improvement in rice productivity and quality remains crucial, crop improvement programs should aim to broaden the genetic base of breeding stocks (Vanaja and Babu, 2004). Many traditional varieties and improved cultivars have been released for cultivation in different regions of India. Despite abundant genetic resources, only a small proportion of the total rice germplasm collection has been used in breeding programs. This discrepancy has narrowed the genetic base in most improved varieties and advance breeding lines. Hence, appropriate conservation of landraces and broadening the gene pool of rice varieties has become necessary for breeding rice varieties with high yields and superior qualities in India.
Germplasm constitutes the foundation for genetic improvement of crops. The pace and magnitude of genetic improvement are generally dependent on the amount of genetic diversity present in a population. Genetic diversity in plants has been assessed using morphological and physiological traits. Mahalanobis D2statistics is a powerful tool for determining clustering patterns to establish a relationship between genetic and geographical divergence and investigating roles of different quantitative characters toward the maximum divergence (Murthy and Arunachalam, 1966). However, assessment based on plant phenotypes may not be a reliable measure of genetic difference because of the influence of environmental factors. Recent techniques, such as DNA-based markers, provide highly effective and reliable tools for measuring genetic diversity in crop germplasm and evaluating evolutionary relationships. As DNA-based molecular marker systems are used to detect differences in genetic information carried by different individuals, they are increasingly useful for identification and characterization of novel germplasm (O’ Neill et al, 2003).
Simple sequence repeats (SSRs) are simple, tandemly repeated nucleotide sequence motifs flanked by unique sequences. SSR markers, which can be assayed through PCR, are used to detect a high level of allelic diversity, and genotyping of these co-dominant markers can also be automated (Reed et al, 1994; Smith, 1997; McCouch et al, 2002). Inter-simple sequence repeat (ISSR) markers reveal a high degree of polymorphism and distinguish genetically related individuals. Numerous SSR markers have been identified in rice (Temnykh et al, 2001; McCouch et al, 2002), and along with ISSR markers they have been used to assess genetic diversity (Joshi et al, 2000; Saini et al, 2004; Lapitan et al, 2007; Pervaiz et al, 2010; Sivaranjani et al, 2010; Ghaley et al, 2012; Vanniarajan et al, 2012; Das et al, 2013; Yadav et al, 2013). These markers have become important tools for unambiguous characterization of genotypes and for protection of rights under the Protection of Plant Varieties and Farmer’ s Rights Act of 2001 in India.
This investigation aimed to study genetic diversity and population structure in a set of rice genotypes from landraces, local selections and improved varieties by using SSR and ISSR markers.
MATERIALS AND METHODSRice materialsGermplasm for genetic diversity and population structure analysis consisted of 50 rice genotypes, including 15 landraces, 7 local selections and 28 improved varieties maintained at the Agricultural Research Station (ARS), Radhanagari, Kolhapur District, Maharashtra State, India (Table 1).
Table 1
Table 1
 Table 1 List of rice genotypes along with their pedigree.| Genotype | Parentage/detail |
|---|
| Heera | CR404-48 × CR289-1208 | | Halvi Sal 17 | Local selection from Kolhapur (MS) | | RDN185-2 | Halvi Sal 17 × TN1 | | Phule Radha | TN1 × Kolamba 540 | | RTN1 | IR8 × RTN24 | | Ratna | TKM6 × IR8 | | Phule Samruddhi | Indrayani × Sonsali | | Jaya | TN1 × T141 | | Phule Maval | Pawana × Indrayani | | Pawana | Pusa 33 × IR28 | | Indrayani | Ambemohar 157 × IR8 | | Bhogavati | Selection from Basmati composite | | Pusa Basmati 1 | Pusa 150 × Karnal Local | | Ghansal | Local selection from Kolhapur (MS) | | Kalajirga | Local selection from Kolhapur (MS) | | Vivek Dhan 82 | VL221 × UPR82-1-7 | | Badshabhog | Local type/landrace from Orissa | | Kothimbire | Landrace from Kolhapur (MS) | | BPT5204 | (GEB24 × TN1) × Mahsuri | | RDN98-2-3-5-14 | Halvi Sal 17 × TN1 | | RDN01-2-10-9 | Ambemohar 157 × IR8 | | KJT2 | RP6-17 × RP4-14 | | EK70 | Landrace from Igatpuri, Nasik (MS) | | Patni | Landrace from Sindhudurg (MS) | | Diwani | Landrace from Uttar Pradesh | | Shyam Jeer | Landrace from Bihar | | Kasturi | Basmati 370 × CRR88-17-1-5 | | SD17 | Pusa Basmati 1 × IET12603 | | Sugandhamati | Pusa Basmati 1 × IET12603 | | Basmati 386 | Selection from Pak Basmati | | MC4 | Selection from Karnal Local | | Haryana Basmati | Local selection from Haryana | | Mahisugandha | BK79 × Basmati 370 | | Khalibagh | Landrace from Sindhudurg (MS) | | Vikram | Landrace from Sindhudurg (MS) | | Tulshi tall | Landrace from Kolhapur (MS) | | Champakali | Landrace from Kolhapur (MS) | | Siddhagiri | Landrace from Kolhapur (MS) | | RDN97-2 | TN1 × IR64 | | RDN99-12 | Selection from Phule Maval | | RDN99-14 | Bhogavati × RTN24 | | RTN purple | Local selection from Ratnagiri (MS) | | Taraori Basmati | Pureline selection from NBC19 | | RDN02-80 | Indrayani × Pusa Basmati 1 | | Pavsal | Landrace from Pune (MS) | | Antersal | Landrace from Pune (MS) | | Nalabhat | Landrace from Pune (MS) | | Sonsali | Landrace from Pune (MS) | | LK248 | Local selection from Nasik (MS) | | Pomendi Local | Landrace from Ratnagiri (MS) |
MS, Maharashtra State of India. | Table 1 List of rice genotypes along with their pedigree. |
SSR and ISSR markersAmong 17 SSR markers used for analysis, 13 were linked to blast resistance genes/QTLs, and 7 were listed in the panel of 50 standard SSR markers used for diversity analysis (www.gramene.org), and some markers were common to both lists (Supplemental Table 1). A set of 25 available ISSR markers were also used for genetic diversity analysis (Supplemental Table 2).
Table 2
Table 2
Table 2 Polymorphism patterns obtained using simple sequence repeat (SSR) and inter-simple sequence repeat (ISSR) primers| Marker | Total no. of alleles | No. of monomorphic alleles | No. of unique alleles | Polymorphism (%) | PIC |
|---|
| RM11 | 2 | 0 | 0 | 100 | 0.461 | | RM21 | 3 | 0 | 0 | 100 | 0.663 | | RM44 | 20 | 0 | 0 | 100 | 0.91 | | RM72 | 5 | 0 | 0 | 100 | 0.765 | | RM162 | 9 | 0 | 1 | 100 | 0.765 | | RM204 | 23 | 0 | 2 | 100 | 0.928 | | RM209 | 8 | 0 | 0 | 100 | 0.811 | | RM215 | 5 | 0 | 1 | 100 | 0.607 | | RM224 | 15 | 0 | 1 | 100 | 0.901 | | RM241 | 17 | 0 | 2 | 100 | 0.923 | | RM246 | 22 | 0 | 0 | 100 | 0.917 | | RM259 | 20 | 0 | 0 | 100 | 0.963 | | RM307 | 4 | 0 | 0 | 100 | 0.523 | | TRS26 | 15 | 0 | 0 | 100 | 0.893 | | TRS33 | 19 | 0 | 2 | 100 | 0.902 | | ISSR808 | 3 | 1 | 0 | 66.7 | 0.105 | | ISSR809 | 9 | 0 | 0 | 100 | 0.818 | | ISSR810 | 10 | 0 | 0 | 100 | 0.867 | | ISSR811 | 9 | 0 | 0 | 100 | 0.866 | | ISSR812 | 10 | 1 | 0 | 90 | 0.85 | | ISSR813 | 8 | 0 | 0 | 100 | 0.851 | | ISSR814 | 4 | 0 | 0 | 100 | 0.65 | | ISSR815 | 12 | 0 | 0 | 100 | 0.91 | | ISSR818 | 6 | 0 | 0 | 100 | 0.648 | | ISSR821 | 6 | 0 | 0 | 100 | 0.793 | | ISSR823 | 12 | 1 | 0 | 91.7 | 0.913 | | ISSR826 | 3 | 0 | 0 | 100 | 0.197 | | ISSR827 | 11 | 0 | 0 | 100 | 0.989 |
PIC, Polymorphism information content. | Table 2 Polymorphism patterns obtained using simple sequence repeat (SSR) and inter-simple sequence repeat (ISSR) primers |
Genomic DNA isolation and PCR amplificationFresh leaf samples from 15 day-old seedlings were used to extract DNA through cetyltrimethyl ammonium bromide method described by Doyle and Doyle (1990) with some modifications. The quality and quantity of DNA were spectrophotometrically estimated with a NanoDrop system (ND-1000, Thermo Scientific, USA). PCR amplifications were performed in a Corbett Palm-Cycler (Corbett Research, Australia) with a total volume of 20 mL for each PCR mixture containing 20 ng of genomic DNA, 2.0 mL of 10 × buffer (100 mmol/L Tris, pH 9.0, 500 mmol/L KCl and 0.1% gelatin), 200 µ mol/L dNTPs and l U Taq DNA polymerase with 0.100 µ mol/L SSR primer or 0.200 µ mol/L ISSR primer. Temperature cycles were programmed as 5 min at 95 ° C, followed by 40 cycles of 30 s at 94 ° C, 30 s at 55 ° C or 60 ° C annealing temperature and 1 min at 72 ° C, with a final extension of 10 min at 72 ° C for SSR primers. For ISSR primers, amplification reactions were carried out for 5 min at 95 ° C, followed by 35 cycles of 1 min at 94 ° C, 1 min at the primer-specific annealing temperature and 1 min at 72 ° C, with a final extension of 10 min at 72 ° C.
The amplified products with SSR primers were resolved by electrophoresis on 10% polyacrylamide denaturing gels and then subjected to silver staining. The amplified products with ISSR primers were resolved on 1.2% agarose gels and visualized using a UV Trans-illuminator (Fluor Chem™ Alpha Innotech, USA) in a gel documentation system.
Estimation of polymorphism information content (PIC)PIC values were calculated as described by Powell et al (1996) with the following formula:
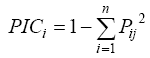
where Pij is the frequency of the jth allele for the ith marker.
Genetic diversity analysisData obtained from all polymorphic markers were used to determine genetic relationships. The amplified products were scored for the presence or absence of each marker allele. Each product amplified by a given primer was treated as a unit character. Data were entered into a binary matrix as discrete variables, and scored with ‘ 1’ for the presence and ‘ 0’ for the absence of the fragment. As the number and/or position of fragment(s) in a lane determine the allelic pattern produced by a primer, all fragments in a lane were compared across all other lanes (genotypes). Genetic similarities based on the Dice coefficient were calculated among all possible pairs with the SIMQUAL option and organized in a similarity matrix (Supplemental Table 3). Cluster analysis was performed with NTSYSpc (version 2.02i). A dendrogram was constructed through unweighted pair-group method with arithmetic averages (UPGMA) to group individuals into different clusters.
Population structure analysisPopulation structure was assessed with a set of 28 SSR marker loci containing the least number of missing marker data points by using the software package STRUCTURE 2.3 (Pritchard et al, 2000) with the admixture model. The number of sub-populations (K) was set from 1 to 10 with the length of the burn-in period, and markov chain monte carlo number after the burn-in period was set as 100 000. The number of sub-populations was determined based on the criteria proposed by Evanno et al (2005).
RESULTSAnalysis of SSR markersAmong 17 SSR markers used, 15 were polymorphic (except RM25 and RM250) (Table 2). These 15 polymorphic markers amplified a total of 187 polymorphic alleles. The number of alleles per primer varied from 2 (RM11) to 23 (RM204), and the PIC values ranged from 0.461 (RM11) to 0.963 (RM259) with an average of 0.795. All the polymorphic SSR markers, except RM11, exhibited the PIC values higher than 0.500. In addition, 6 of these 15 markers amplified 9 unique alleles, which distinguished individual genotypes from the other genotypes used in this study.
Analysis of ISSR markersAmong the 25 ISSR markers used, 13 were polymorphic. A total of 103 alleles were amplified, of which 100 were polymorphic (Table 2). The number of alleles per primer varied from 3 (ISSR808 and ISSR826) to 12 (ISSR815 and ISSR823). None of the markers amplified a unique locus. The PIC values for polymorphic ISSR markers ranged from 0.105 (ISSR808) to 0.989 (ISSR827) with an average of 0.727.
Genetic diversity based on molecular markersThe binary data from polymorphic SSR and ISSR primers were used to calculate similarity indices. The similarity coefficient based on 13 ISSR and 15 SSR primers ranged from 0.25 to 0.85. The maximum diversity was observed between the landrace Pomendi Local and the improved scented (Basmati) variety Pusa Basmati 1 (similarity coefficient of 0.25), followed by the breeding line RDN97-2 and the landrace Tulshi tall (0.26). The genotype Badshabhog recorded the highest number of genotypic combinations (26) with a similarity index value ≤ 0.40, followed by Pavsal (25), Pusa Basmati 1 (20), Khalibagh (15), Ghansal (15), Tulshi tall (14), Vikram (10), Shyam Jeer (9) and RDN97-2 (9). Conversely, the maximum similarity was observed between the improved varieties. The highest similarity was observed between the improved varieties Pawana and RTN1 (0.85), followed by those between Phule Maval and Phule Samruddhi (0.84), Bhogavati and Indrayani (0.84), and Indrayani and Phule Maval (0.83). The improved variety Pawana demonstrated the highest number of genotypic combinations (6) with a similarity index value ≥ 0.75, followed by Indrayani (5), Phule Maval (5), Bhogavati (4) and RDN99-14 (4), thereby indicating their similar genetic constitution (Supplemental Table 3).
Table 3
Table 3
Table 3 Distribution of rice genotypes into different clusters based on simple sequence repeat (SSR) and inter-simple sequence repeat (ISSR) markers.| Cluster | Sub-cluster | No. of genotypes | Genotype | Remark |
|---|
| I | A | 4 | Heera, SD17, Sugandhamati, MC4 | Basmati line Karnal Local as parent or in ancestry, except Heera | | B | 1 | RDN02-80 | Basmati line Karnal Local as parent or in ancestry, except Heera | | II | A | 7 | Halvi Sal 17, EK70, Patni, Siddhagiri, RDN97-2, Khalibagh, Sonsali | Non-scented, landraces or local selections, except RDN97-2 | | B | 3 | Kalajirga, Kasturi, Champakali | Scented landraces except Kasturi | | III | A | 14 | RDN185-2, Phule Radha, RTN1, Pawana, Jaya, Ratna, Phule Samruddhi, Phule Maval, Indrayani, Bhogavati, RDN01-2-10-9, KJT2, BPT5204, RDN98-2-3-5-14 | All improved varieties with dwarf plant type, IR8 or TN1 as parent or in ancestry | | B | 5 | RDN99-12, RDN99-14, RTN purple, LK248, Pomendi Local | Dwarf plant type, midlate to late maturity, medium slender grain type | | C | 2 | Nalabhat, Taroari Basmati | Landraces, long-slender grain type, late maturity | | D | 3 | Vivek Dhan 82, Haryana Basmati, Antersal | Tall plant type | | IV | | 2 | Vikram, Tulshi tall | Landraces | | V | A | 4 | Pusa Basmati 1, Ghansal, Badshabhog, Pavsal | Scented Basmati or non-Basmati genotypes; mostly landraces | | B | 5 | Kothimbire, Diwani, Shyam Jeer, | Scented Basmati or non-Basmati genotypes; mostly landraces | | Basmati 386, Mahisugandha |
| Table 3 Distribution of rice genotypes into different clusters based on simple sequence repeat (SSR) and inter-simple sequence repeat (ISSR) markers. |
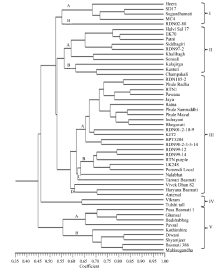
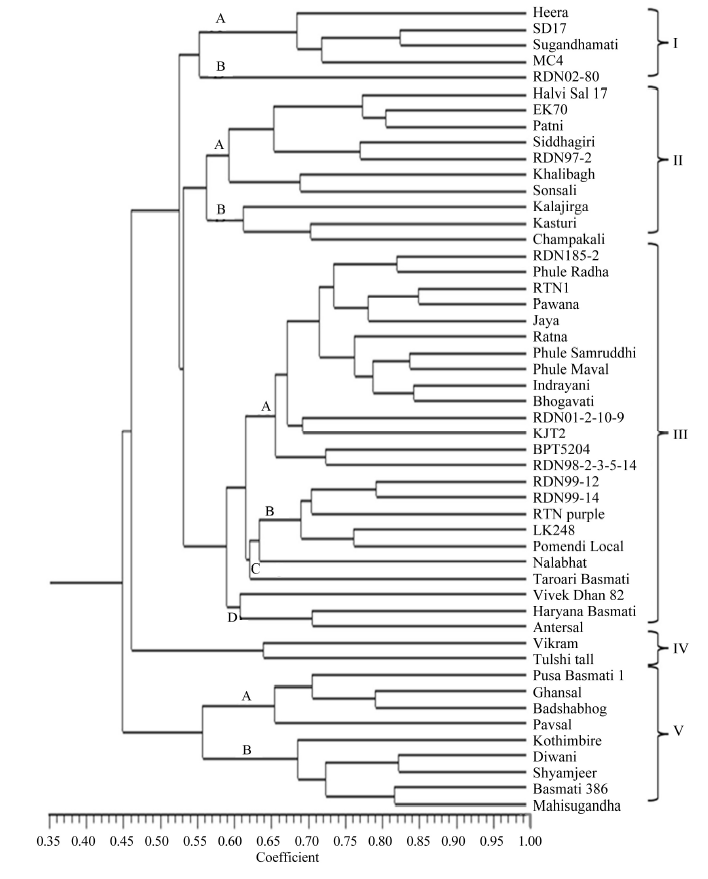
These 50 rice genotypes were grouped into 5 major clusters with 11 sub-clusters by using UPGMA-based clustering analysis with the Dice similarity coefficient. Cluster III presented the highest number of genotypes, followed by cluster II, cluster V, cluster I and cluster IV (Table 3 and Fig. 1).
Cluster I consisted of five genotypes, and the similarity between any two genotypes in the cluster ranged from 41% to 82%. The cluster was further sub-divided into two sub-clusters with a similarity coefficient of 0.55. Cluster II consisted of 10 genotypes and was divided into 2 sub-clusters with a similarity coefficient of 0.56. The similarity between the genotypes in this cluster ranged from 43% to 80%. Sub-cluster II-A comprised of non-scented local genotypes, except RDN97-2, whereas sub-cluster II-B comprised of scented local types, except Kasturi.
Cluster III contained 24 genotypes, including most improved varieties under the study. The similarity coefficient between any two rice varieties in this cluster ranged from 0.44 to 0.85. The cluster was further sub-divided into four sub-clusters with varied degrees of similarity. The major sub-cluster III-A was differentiated at a similarity coefficient of 0.66 and comprised of 14 improved varieties (Table 3), and these varieties are of interest because they are cultivated in India. The varieties in this group were dwarf plants with high yields and contained TN1 or IR8 in their ancestry as a source of the dwarfing gene. Grouping of these genotypes in one cluster indicated their parental relationships. The other 10 genotypes in sub-clusters III-B, III-C and III-D were also diverse.
Table 4
Table 4
Table 4 Distribution of rice genotypes into different sub-populations based on population structure analysis.| Sub-population | No. of genotypes | Genotype | Remark |
|---|
| 1 | 19 | Phule Maval, RTN1, Indrayani, Bhogavati, | Almost all improved varieties (except Antersal and Kalajirga) with dwarf plant type; Most of the genotypes have IR8 or TN1 in their parentage/ancestry. | | RDN01-2-10-9, KJT2, Pawana, Phule Samruddhi, Ratna, Antersal, RDN185-2, Phule Radha, | | RDN99-12, Vivek Dhan 82, Jaya, BPT5204, RDN98-2-3-5-14, Kalajirga, Kasturi | | 2 | 9 | Pomendi Local, LK248, Vikram, RDN99-14, | Almost all are landraces or selections from local types (except RDN99-14) | | RTN purple, Taroari Basmati, Nalabhat, Sonsali, MC4 | | 3 | 8 | Siddhagiri, Patni, RDN97-2, EK70, Halvi Sal 17, RDN02-80, Champakali, Haryana Basmati | Almost all are landraces or selections from local types (except RDN97-2 and RDN02-80) | | 4 | 7 | Shyam Jeer, Basmati 386, Kothimbire, Mahisugandha, Diwani, Tulshi tall, Khalibagh | Mostly landraces; Basmati 386 and Mahisugandha have Pakistan Basmati in parentage/ancestry | | 5 | 7 | Pusa Basmati 1, Ghansal, Badshabhog, Sugandhamati, Pavsal, SD17, Heera | Landraces and improved Basmati types; Pusa Basmati 1, SD17 and Sugandhamati have Karnal Local in the parentage/ancestry |
| Table 4 Distribution of rice genotypes into different sub-populations based on population structure analysis. |
Cluster IV consisted of only two landraces and thus confirmed as the most unusual genotypes in this collection. These landraces probably contained unusual combinations of alleles, which were not clustered with the genotypes in the other groups. Cluster V consisted of nine genotypes, and the similarity coefficient among any two genotypes in this cluster ranged from 0.47 to 0.82. This cluster was further sub-divided into sub-cluster V-A and V-B, with 0.65 and 0.68 similarities, respectively. This cluster represented all scented (Basmati and non-Basmati) genotypes.
Nine unique alleles amplified using six SSR markers were specific to a particular genotype and can distinguish the respective genotype from the other genotypes. For example, the 500 bp allele amplified by the SSR marker RM162 was specific to the genotype RDN02-80. Similarly, the unique alleles of 95 and 105 bp were amplified by the marker RM241 in the genotype RDN02-80. The marker RM204 amplified unique alleles of 200 and 205 bp in the genotypes RDN97-2 and Taroari Basmati, respectively. The marker RM215 amplified a unique allele of 385 bp in Ratna, whereas RM224 amplified a unique allele of 150 bp in Patni. Similarly, the marker TRS33 amplified unique alleles of 180 and 580 bp in the rice genotypes BPT5204 and Sonsali, respectively.
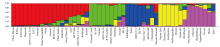
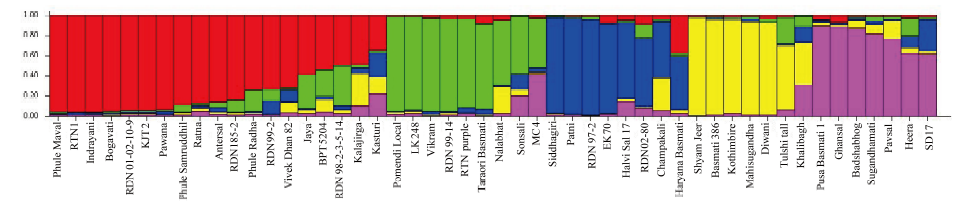
Population structure analysisThe results of population structure analysis revealed five sub-populations in this study (Table 4 and Fig. 2). The distribution of sub-populations was similar to the grouping in the UPGMA dendrogram based on ISSR and SSR markers. Sub-populations 1, 2 and 3 comprised 19, 9 and 8 genotypes, respectively, whereas sub-populations 4 and 5 comprised 7 genotypes each. In the population structure analysis, majority of the improved varieties and landraces/local selections were separated into different sub-populations (Table 4). A majority of the improved varieties were included in sub-population 1, whereas landraces and local selections were included in other sub-populations.
DISCUSSIONGenetic variability in a plant material is used as basis for crop improvement. The use of germplasm can be determined from the extent of available variability in the material. The important objective of each genetic diversity study is to understand the possibility of classifying individual genotypes into different groups. Genotypes used in this study showed significant amount of genetic diversity for different agro-morphological traits (data not given). Although morphological trait analysis is a useful tool in studying genetic differences reflected by phenotypic expression, its results may not always reflect the real genetic variation because of genotype × environment interaction and unknown genetic control of polygenic morphological and agronomic traits (Smith and Smith, 1992). Characterization of genotypes based on polymorphisms at the DNA level with molecular markers is a powerful tool for estimation of genetic divergence (Hashimoto et al, 2004). In the present study, among the 15 polymorphic SSR markers, 14 exhibited PIC values higher than 0.500, thereby suggesting their suitability for genetic diversity study. The average PIC value (0.795) exhibited by SSR markers was almost similar to those observed by Kanawapee et al (2011) in 30 rice cultivars and Das et al (2013) in rice landraces.
In this investigation, grouping of rice genotypes based on polymorphic ISSR and SSR markers indicated low to high genetic diversities among the studied genotypes. The maximum diversity among the landraces indicated distinct differences in their genetic architecture. These landraces were obtained from various agro-climatic regions of the country and evolved through long process under different environmental conditions of their respective regions. Interestingly, the improved Basmati variety Pusa Basmati 1 and the improved line RDN97-2 presented high numbers of genotypic combinations (20 and 9, respectively) with a similarity value ≤ 0.40. These results indicated the genetic dissimilarity of these varieties with the other genotypes in the study. The distinct genetic makeup of Pusa Basmati 1 was also reported by Jain et al (2004) and Singh et al (2011). Moreover, the improved varieties in the present study showed the maximum similarity. Most of the improved varieties presented dwarf-type plants, long slender grains and high grain yield. These genotypes had common parents and/or were related by ancestry as reflected in their high genotypic similarities.
Fifty rice genotypes were grouped into five clusters through UPGMA-based clustering with the Dice similarity coefficient. Cluster I consisted of five genotypes differentiated from the other clusters at 0.52 similarity. Genotypes in this cluster, except Heera, contained the Basmati landrace Karnal Local in their ancestry. This cluster was separated into two sub-clusters at 0.55 similarity, thereby differentiating RDN02-80, from the other genotypes in the cluster. It contained the widely cultivated scented rice variety Indrayani and Pusa Basmati 1 in its ancestry. The parental relationship of RDN02-80 with that of the other genotypes in sub-cluster A grouped them together in cluster I. However, the presence of a non-Basmati parent in RDN02-80 may be attributed to their genetic differences with genotypes in sub-cluster A. The common parentage between SD17 and Sugandhamati produced the maximum genetic similarity (0.84), and both were grouped together in sub-cluster A with MC4 and Heera. The grouping in cluster A generally reflected the parental relationships among the genotypes.
Most of the landraces in the present investigation were grouped independently in clusters II, IV and V. Cluster II consisted of 10 genotypes accommodating 8 local types from Maharashtra. These genotypes reported wide variation for the similarity coefficient between them. Sub-cluster A was comprised of all non-scented local genotypes, except RDN97-2, whereas sub-cluster B was comprised of scented local types except Kasturi, which is an improved scented variety.
The improved varieties in the present investigation were mostly grouped into Cluster III, which was the largest cluster in this study. This cluster was differentiated into four sub-clusters at different levels of similarity. Sub-cluster A was the largest with 14 genotypes and all of them were improved varieties with most of them having TN1 or IR8 in their parentage.
Two landraces Vikram and Tulshi tall were grouped into Cluster IV, indicating their distinct differences in the allelic combinations from other genotypes. Although these two landraces were grouped into the same cluster, they showed moderate similarity (0.64). Tulshi tall is a landrace from Western Ghat Zone of Maharashtra, while Vikram is a landrace from Konkan region of Maharashtra in India.
Nine genotypes grouped into Cluster V represented scented Basmati and non-Basmati local types from India. The range of similarity coefficient in this cluster varied from 0.47 to 0.82, indicating moderate to high variation between the genotypes. These local types belonged to different agro-climatic zones of India and were evolved through different selection indices with shifting effect of biotic and abiotic factors resulting into differences in genetic composition among them.
Overall, 50 rice genotypes were grouped into 5 clusters based on their similarity coefficients. Most of the local genotypes and Basmati lines were grouped independently from the improved varieties. A close association among the scented Basmati germplasm was also reported by Davierwala et al (2000) and Rabbani et al (2008). This analysis suggested that landraces, local genotypes and Basmati rice have long and independent history of evolution, which distinguishes them from most of the improved varieties.
The nine unique alleles which were amplified by six SSR markers can be effectively used for precise identification of these genotypes in the given set of rice genotypes. The importance of unique and rare alleles for DNA fingerprinting was also highlighted by Nagaraju et al (2002), Jain et al (2004), Shivapriya and Hittalmani (2006), and Das et al (2013). No unique alleles were amplified by any of the ISSR markers in the present study. This also highlights the importance of SSR markers over ISSR in the genetic diversity study.
In the population structure analysis, all the rice genotypes were separated into five sub-populations, and a majority of the improved varieties and landraces or local selections were categorized into different sub-populations. Majority of the improved varieties were present in sub-population 1. IR8 or TN1 was present in the parentage/ancestry of most genotypes of sub-population 1. The results of cluster analysis obtained using ISSR and SSR markers were compared with those of the population structure analysis. The comparison suggested that cluster III-A corresponded to sub-population 1, whereas clusters III-B and III-C corresponded to sub-population 2. Similarly, clusters V-A and V-B corresponded to sub-populations 5 and 4, respectively. Although the obtained results using these two analyses were similar to a larger extent, the observed differences can be attributed to the different methods used for grouping the genotypes.
In this study, the results of genetic diversity analyses based on SSR and ISSR and population structure analysis of rice genotypes indicated the independent grouping of the improved varieties, landraces, scented Basmati and non-Basmati genotypes. This finding revealed an independent and complex pattern of evolution in these germplasm groups. The genetic diversity in the rice gene pool must be further elucidated to facilitate classification, proper maintenance, conservation and utilization of these valuable resources. In addition, marker-based identification and differentiation of rice genotypes may be applied to maintain the integrity of these lines and thus benefit farmers and research workers.
SUPPLEMENTAL DATAThe following materials are available in the online version of this article at http://www.sciencedirect.com/
science/journal/16726308; http://www.ricescience.org.
Supplemental Table 1. Details of simple sequence repeat (SSR) primers used in this study.
Supplemental Table 2. Details of inter-simple sequence repeat (ISSR) primers used in this study.
Supplemental Table 3. Dice similarity and dis-similarity coefficient using pooled data of ISSR and SSR analysis.
Managing Editor: Li Guan




 , Jagannath V. Patil