

Effects of Dry-Milling and Wet-Milling on Chemical, Physical and Gelatinization Properties of Rice Flour
[Jitranut Leewatchararongjaroen, Jirarat Anuntagool ]
]
]
|
|


Rice flour from nine varieties, subjected to dry- and wet-milling processes, was determined for its physical and chemical properties. The results revealed that milling method had an effect on properties of flour. Wet-milling process resulted in flour with significantly lower protein and ash contents and higher carbohydrate content. Wet-milled flour also tended to have lower lipid content and higher amylose content. In addition, wet-milled rice flour contained granules with smaller average size compared to dry-milled samples. Swelling power at 90 °C of wet-milled samples was higher while solubility was significantly lower than those of dry-milled flour. Dry milling process caused the destruction of the crystalline structure and yielded flour with lower crystallinity compared to wet-milling process, which resulted in significantly lower gelatinization enthalpy.
Rice (Oryza sativa L.) is a staple food for more than half of the world’ s population (Xiang et al, 2015). Rice is consumed mostly as cooked grains, and it is also processed to puffed rice (Joshi et al, 2013) or flour and starch that can be further formulated into a variety of products. In order to successfully incorporate rice or its flour into products, the properties of the material have to be known as they will affect product qualities, consistency and also lead to good consumer satisfaction. Factors influencing the physicochemical properties of rice flour include rice genotype (Iturriaga et al, 2004), amylose content (Varavinit et al, 2003), protein content (Marco and Rosell, 2008) and milling method (Suksomboon and Naivikul, 2006). Rice flour is generally manufactured using wet-milling method as it is believed to yield flour with superior quality. However, wet-milling method results in large amount of waste water. Studies (Chen et al, 1999, 2003; Suksomboon and Naivikul, 2006) have shown that dry-milled flour retains components such as protein, lipid and ash at higher levels than wet-milled flour. If incorporated into food recipes, dry-milled flour can then offer a more nutritive product. Chen et al (1999) studied the physicochemical and functional properties of waxy rice flour prepared from dry-milling, semi-dry-milling, and wet-milling methods, and indicated that dry hammer-milled rice shows higher gelatinization and pasting temperatures, and semi-dry- milled rice results in the lowest pasting temperature, setback viscosity and enthalpy value. Hammer and semi-dry hammer milled rice gives higher percentages of coarse particles (100-300 μ m), cyclone and turbo milled rice leads to a more even particle-size distribution, and the wet-milled rice gives the finest particles (10-30 μ m). The dry-milled rice flour is reported to have more damaged starch, thus giving better solubility, and lower peak and final viscosities. Therefore, the final quality of rice flour is profoundly affected by the milling type and milling method. Provided that the physical and functional properties of both dry-milled and wet-milled rice flour are thoroughly elucidated, they can both find application in the food industry. This study aimed to investigate the physical and chemical properties of flour from several rice varieties as affected by dry-milling and wet-milling methods.
Nine Thai rice varieties, Ayutthaya 1 (AY1), Plai Ngahm Prachin Buri (PNG), Prachin Buri 1 (PB1), Prachin Buri 2 (PB2), Rice Department 45 (RD45) (from Prachin Buri Rice Research Center in Thailand, harvested during March, 2011), Khao Dawk Mali 105 (K105; from Pathum Thani Rice Research Center in Thailand, harvested during December, 2010), Shaw Lung 97 (SL97; from Pattani Rice Research Center in Thailand, harvested during March, 2011), Rice Department 41 (RD41) and Rice Department 47 (RD47) (from Phitsanulok Rice Research Center in Thailand, harvested during November, 2010), were used in this study. The rice samples were obtained as milled rice. All samples were stored at 4 ° C until further analyses.
Dry-milling process
Milled rice grains (500 g) were ground twice using a vertical disc mill. Flour samples were passed through a 100-mesh sieve (149 μ m opening), sealed in polypropylene plastic bags and stored in a desiccator at room temperature until further analyses.
Wet-milling process
Approximately 1 kg milled rice was soaked overnight in 2 L NaHSO3 solution (1.25%) before it was ground using a stone-mill under continuous addition of water to obtain rice slurry. The slurry was filtered through a filter bag to obtain rice cake. The cake was dried overnight in a tray dryer at 40 ° C. The dried rice flour was ground and sieved through a 100-mesh sifter. Flour samples were packed in polypropylene plastic bags and stored in a desiccator at room temperature for further use (Varavinit et al, 2003).
Particle size analysis
Particle size distribution was analyzed by a Laser Light Scattering Particle Size Analyzer (Beckman Coulter, model LS 13320, USA) according to the method of Park et al (2010) with minor modification.
Morphology observation
Light microscopy and scanning electron microscopy (SEM) were used to examine the morphology of starch granules. Samples were observed using a polarized light microscope (Model CH30RF200, Olympus, Japan). Rice flour was also investigated using an SEM (Model JSM-5800 LV, JEOL, Japan) with the procedure of Scientific and Technological Research Equipment Centre, Chulalongkorn University, Thailand.
X-ray diffraction analysis
X-ray diffraction analysis was performed using an X-ray diffractometer (Model D8 Discover, Bruker AXS, Germany) with the procedure of Scientific and Technological Research Equipment Centre, Chulalongkorn University, Thailand.
Water binding capacity, swelling power and solubility
Water binding capacity was determined following the method of Medcalf and Gilles (1965). Approximately 1 g sample was weighed (W1) and transferred to a centrifugal tube in which 15 mL of distilled water was added and mixed. The tube containing the sample was then incubated in a shaker water bath at 30 ° C and 174 r/min for 30 min before it was centrifuged at 5 000 × g for 20 min. The supernatant was decanted carefully and the residue was weighed (W2). Water binding capacity was calculated as follows:
Water binding capacity = (W2- W1) / W1
Swelling power and solubility were determined following the method of Schoch (1964). Approximately 0.5 g sample was weighed (W3) and transferred to a centrifugal tube, and 15 mL distilled water was added and mixed. The tube was then incubated in a shaker water bath at constant temperatures (60 ° C, 70 ° C, 80 ° C and 90 ° C) at 174 r/min for 30 min. The tube was cooled to room temperature and centrifuged at 6 000 × g at 4 ° C for 20 min. The supernatant was decanted carefully and the residue was weighed (W4). The supernatant was dried in an aluminum dish at 105 ° C in a hot-air oven to a constant weight (W5). Swelling power and solubility were calculated as follows:
Solubility (%) = (W4/ W3) × 100
Swelling power = W5/ [W3× (1 - Solubility) / 100]
Chemical analysis
Rice and flour samples were prepared for proximate analyses following the method of AOAC (2005). Moisture, fat, crude fiber protein and ash contents were subsequently determined, and carbohydrates were calculated following the AOAC official methods (AOAC, 2005). The conversion factor (5.95) was applied to convert nitrogen content to the crude protein content. Amylose content of rice flour was determined using the iodine binding method (Juliano, 1971).
Pasting properties
Pasting properties were measured using a Rapid Visco Analyser (RVA) (Model 4D, Newport Scientific, Australia) using the standard profile 1 following the method of Haase et al (1995).
Thermal properties
Thermal properties of rice flour were examined by a Differential Scanning Calorimeter (Model Diamond, Perkin-Elmer, USA) following the method of Kim et al (1995).
The experiment was designed in a completely randomized design. SPSS version 17.0 was employed for data analysis. All measurements were done in triplicate, except X-ray diffraction analysis (duplicate), thermal properties (duplicate), and texture analysis (10 replicates). Analysis of variance and Duncan’ s new multiple range test were used for comparing differences in the mean values at 95% confidence level (Montgomery, 2005).
Moisture content of the milled rice from different varieties ranged from 11.1% to 12.7%. Fat content varied from 0.31% to 1.86%. Among the nine varieties, RD47 showed the highest protein content (10.7%) and SL97 showed the lowest protein content (6.3%) (P ≤ 0.05). Ash content ranged from 0.18% to 0.79%. Carbohydrate content and crude fiber of milled rice varied between 92.5% to 87.7% and 0.11% to 0.46%, respectively. The rice varieties could be classified into two groups, low amylose rice with amylose content of 17.9%-18.4% (RD45 and K105) and high amylose rice with amylose content of 29.5%-36.5% (AY1, PNG, PB1, PB2, SL97, RD41 and RD47).
Chemical compositions of rice flour
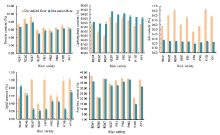
Chemical compositions of dry- and wet-milled rice flour are shown in Fig. 1. Dry- and wet-milling caused significant differences in flour composition. Wet-milled rice flour showed lower protein and ash contents but higher carbohydrate content in all the nine genotypes. Almost all the nine rice genotypes except RD41 showed lower lipid content under wet-milled treatment than under dry-milled treatment.
 | Fig. 1. Chemical composition of dry-milled rice flour and wet-milled rice flour.RD41, Rice Department 41; RD45, Rice Department 45; RD47, Rice Department 47; SL97, Shaw Lung 97; PB1, Prachin Buri 1; PB2, Prachin Buri 2; PNG, Plai Ngahm Prachin Buri; K105, Khao Dawk Mali 105; AY1, Ayutthaya 1. |
Particle size distribution
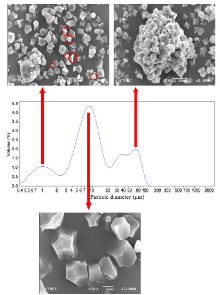
Averaged particle size of dry-milled rice flour ranged from 66.1 to 87.2 μ m, whereas those of wet-milled rice flour varied from 19.8 to 56.9 μ m (Table 1). In dry-milling process, the protein matrix and other substances that cause aggregation of starch granules were not removed. Most starch granules, therefore, remained in their native form as large aggregates (Fig. 2).
| Table 1 Particle size of dry- and wet-milled rice flour. μ m |
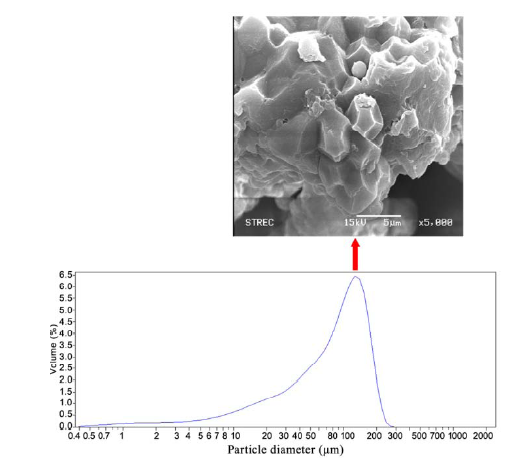 | Fig. 2. Selected particle size distribution of dry-milled K105 (Khao Dawk Mali 105) rice flour. |
Fig. 3 shows that wet-milled rice flour expressed three major peaks when analyzed for its particle size distribution. The first peak at smaller size range (0.5 to 2.0 μ m) could possibly be the remnant of damaged starch granule or some water insoluble protein particles that remained from the wet milling process. The second peak, which covered the 3-20 μ m size range and with a peak around 8 μ m, could represent separated rice starch granules. The last peak governing the 20 to 150 μ m size range could represent starch granules aggregate as clearly revealed in an SEM image shown in Fig. 4.
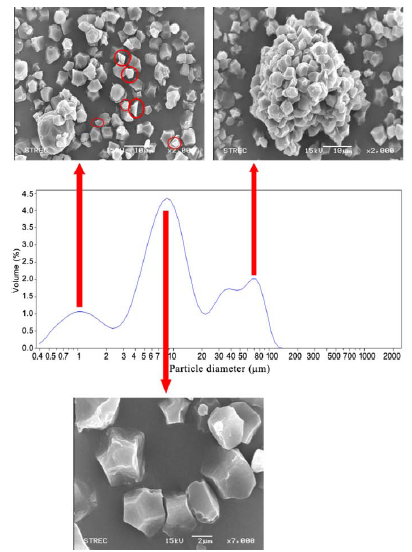 | Fig. 3. Selected particle size distribution of wet-milled K105 (Khao Dawk Mali 105) rice flour. |
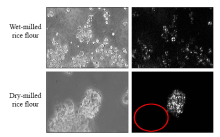
 | Fig. 4. Selected normal and polarized light micrographs of wet- and dry-milled Rice Department 41 (RD41) rice flour (magnification 20 × ). |
Morphology observation
The results indicated that dry-milling disrupted the ordered structure of starch granules, causing the loss of birefringence in some part of dry-milled rice flour (circled area in Fig. 4). Similar result was reported by Chen et al (2003), who indicated that starch granules significantly lost their birefringence as ball-milling treatment time prolonged.
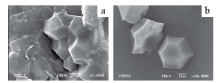
Scanning electron micrograph (SEM) of dry-milled and wet-milled rice flour are shown in Fig. 5. Wet- and dry-milled rice starch granules are polygonal but irregular in shape (Li et al, 2011). It is obvious that dry-milled rice flour contained significantly larger flour particles in the form of aggregates.
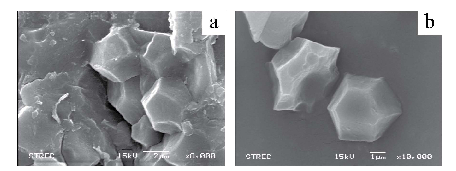 | Fig. 5. Scanning electron microscopy images of starch granules from dry-milled (a) and wet-milled Rice Department 41 (RD41) rice flour (b). |
X-ray diffraction pattern of rice flour
X-ray diffractions of rice flour showed strong reflections at 15° , 17° , 18° and 23° 2θ angles. The crystallinity degrees of wet-milled and dry-milled rice flour varied from 13.0% to 24.2%. Crystallinity degree of wet-milled rice flour was significantly higher than those of dry-milled rice flour (P ≤ 0.05) (Table 2).
| Table 2 Crystallinity characteristics of dry- and wet-milled rice flour. |
Water binding capacity
The water binding capacity of wet-milled rice flour ranged from 1.29 to 1.47, and dry-milled rice flour showed the water binding capacity in the range of 2.69 to 3.87 (data not shown).
Swelling power and solubility
The swelling power of dry-milled rice flour and wet-milled rice flour at 90 ° C and the solubility are shown in Fig. 6. The swelling power of wet-milled and dry-milled rice flour became equivalent, except in wet-milled rice flour from RD41, RD45, RD47 and K105 that possessed higher swelling power than the dry-milled rice flour at 90 ° C (Fig. 6). Wet-milled flour of RD41 and RD47 possessed slightly higher swelling power than the dry-milled flour, while that of RD45 and K105 had considerably higher swelling power than the dry-milled flour at 90 ° C. This could be resulted from the lower amylose content, hence higher amylopectin, that could promote swelling at the later stage of heating in RD45 and K105.
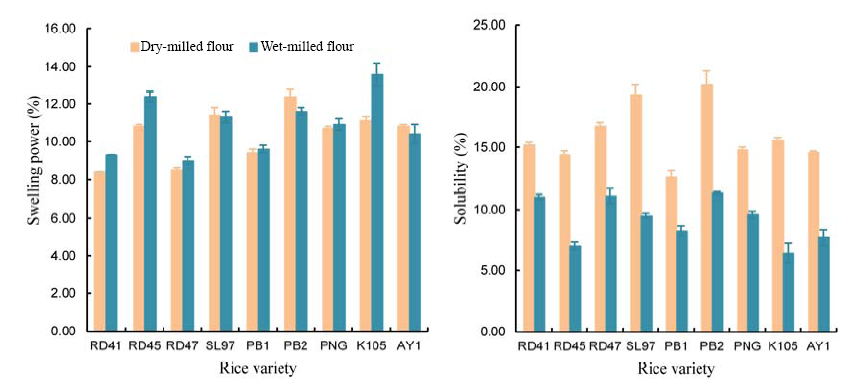 | Fig. 6. Swelling power and solubility properties of rice flour at 90 ° C.RD41, Rice Department 41; RD45, Rice Department 45; RD47, Rice Department 47; SL97, Shaw Lung 97; PB1, Prachin Buri 1; PB2, Prachin Buri 2; PNG, Plai Ngahm Prachin Buri; K105, Khao Dawk Mali 105; AY1, Ayutthaya 1. |
Pasting properties
Pasting properties differed significantly among different rice varieties. The dry-milled rice flour had peak viscosity from 1 010 to 2 624 cP whereas the peak viscosity of wet-milled rice flour ranged from 2 062 to 3 818 cP (Table 3).
| Table 3 Pasting properties of dry-milled and wet-milled rice flour. |
Thermal properties
Table 4 shows thermal properties of wet- and dry-milled rice flour from different varieties. The onset temperature (To) of the rice flour samples varied from 61.7 ° C for dry-milled RD47 to 75.4 ° C for dry-milled SL97, whereas the peak temperature (Tp) ranged from 68.3 ° C for wet-milled RD47 to 80.5 ° C for wet-milled SL97 and the conclusion temperature (Tc) ranged from 74.0 ° C for dry-milled RD47 to 85.6 ° C for dry-milled SL97. The gelatinization enthalpy of dry-milled flour was in the range of 2.5 to 5.9 J/g and wet-milled flour varied in the range of 7.6 to 12.1 J/g.
| Table 4 Thermal properties of rice flours. |
In the wet-milling process, rice grains had to be soaked and ground with water. Soluble protein, which is albumin, was removed, resulting in lower protein content in wet-milled rice flour (Suksomboon and Naivikul, 2006). Wet-milled flour also contained lower ash content that could be the result of washing process (Fig. 1). In all rice varieties investigated, wet-milling yielded significantly lower ash and protein contents and higher carbohydrate content. It was also observed that wet-milling yielded flour with lower lipid content in eight out of nine rice varieties. Further, wet-milling yielded flour with lower amylose content in all the nine rice varieties in this study. This could be due to the fact that flour from wet-milling contains lower impurities content as a result of washing process. However, as amylose is more easily leached out with water during wet-milling process, the opposite could also be observed. Excessive mechanical weathering could cause amylose leaching during wet-milling resulting in a reduction in amylose content in some flour samples.
Averaged particle size of dry-milled flour were significantly (P ≤ 0.05) higher than that of wet-milled flour (Table 1). Rice starch appeared naturally as compound granules. Starch granules in wet-milled samples are mostly separated as individual granules, because during the soaking process of wet-milled rice flour, some soluble proteins, sugars, and non-starch bound lipids are washed out from the surface of starch granules, causing the structure of starchy endosperm to become loosen, which results in the fine particles and less damaged starch (Patindol and Wang, 2002; Chen et al, 2003; Suksomboon and Naivikul, 2006). The granule size of rice starch is around 2-10 μ m which is consistent with the results of BeMiller and Whistler (2009).
X-ray diffractions of rice flour showed a typical A-pattern, similar to those of most ordinary rice flour (Iturriaga et al, 2004; Yu et al, 2010). Lower crystallinity degree for dry-milled rice flour may be due to the mechanical force from dry milling process that caused considerable disruption of the native crystalline structure.
Starch is less soluble in water at below gelatinization temperature because of hydrogen intermolecular bonds. The water binding capacities of wet-milled rice flour were significantly (P ≤ 0.05) lower than those of dry-milled rice flour. The mechanical damage of starch granules from dry-milling process caused the absence of a network structure and increases in free hydroxyl groups resulting in higher water binding capacity.
The swelling power of starch depends on the capacity of starch molecules to hold water via hydrogen bonding, when hydrogen bonds between starch molecules are broken after complete gelatinization they are replaced by hydrogen bonds with water (Singh et al, 2006; Lee and Osman, 1991; Yu et al, 2010). The increase in swelling power in dry-milled flour compared to wet-milled flour at a temperature below gelatinization temperature indicated the damage of large ordered (crystalline) regions, which resulted in more exposed hydroxyl groups as explained earlier. As stated earlier, dry-milling process caused considerable disruption of the native crystalline structure of the rice flour (Chen et al, 2003; Suksomboon and Naivikul, 2006). The higher amount of free hydroxyl groups was, thus, inevitably increased following the increase in damaged starch. In this study, as a result of damaged granules, higher solubility was also observed for dry-milled flour (Fig. 6).
Pasting properties differed significantly among different rice varieties. Pasting properties of starch have been reported to be affected by amylose and lipid contents and by branch chain-length distribution of amylopectin (Lee and Osman, 1991). Amylopectin contributes to swelling of starch granules and pasting, while amylose and lipids inhibit the swelling. Milling process also asserts an influence on pasting viscosity properties as it results in mechanical damage of starch granules. The result in Table 3 shows that dry-milled rice flour had significantly lower peak viscosity compared to wet-milled rice flour (P ≤ 0.05). The lower peak viscosity was caused by a higher starch damage of dry-milled rice flour (Yoenyongbuddhagal and Noomhorm, 2002).
Table 4 shows thermal properties of wet- and dry-milled rice flour from different varieties. Tc-To of dry-milled flour was significantly higher than those of wet-milled flour (P ≤ 0.05). This could possibly due to larger particle distribution of dry-milled flour. The smaller particle started to hydrate and gelatinize rapidly when gelatinization temperature was reached. The larger particles or aggregates could not hydrate or expand as rapidly resulting in delayed gelatinization, hence a larger Tc-To. The gelatinization enthalpy of dry-milled flour was significantly lower than those of wet-milled flour (P ≤ 0.05). This result confirmed the disruption of crystalline structure of dry-milled rice flour (Chen et al, 1999).
Milling process caused significant differences in physicochemical properties of rice flour. Wet-milled flour had lower protein and ash contents with fewer starch granule aggregates and higher crystallinity, hence slightly higher swelling power and higher peak viscosity in some rice varieties and higher gelatinization enthalpy.
This research was partly supported by H. M. King Bhumibol Adulyadej’ s 72nd Birthday Anniversary Scholarship, Graduate School, Chulalongkorn University, Thailand and the Ratchadapisek Somphot Endowment Fund # R-028-2553 for Development of Rice Products for the Agriculture Coorperation under the Chaipattana Foundation Patronage and Faculty of Science Chulalongkorn University, Thailand.
The authors have declared that no competing interests exist.
| 1 |
|
| 2 |
|
| 3 |
|
| 4 |
|
| 5 |
|
| 6 |
|
| 7 |
|
| 8 |
|
| 9 |
|
| 10 |
|
| 11 |
|
| 12 |
|
| 13 |
|
| 14 |
|
| 15 |
|
| 16 |
|
| 17 |
|
| 18 |
|
| 19 |
|
| 20 |
|
| 21 |
|
| 22 |
|
| 23 |
|