Evaluation of Protocols for Measuring Leaf Photosynthetic Properties of Field-Grown Rice
[Chang Tian-gen1, 2 , Xin Chang-peng1 , Qu Ming-nan1 , Zhao Hong-long1, 2 , Song Qing-feng1 , Zhu Xin-guang1, 2  ]
]
]
|
|


Largely due to the heterogeneity of environmental parameters and the logistical difficulty of moving photosynthetic equipment in the paddy fields, effective measurement of lowland rice photosynthesis is still a challenge. In this study, we showed that measuring detached rice leaves in the laboratory can not effectively represent the parameters measured in situ. We further described a new indoor facility, high-efficiency all-weather photosynthetic measurement system (HAPS), and the associated measurement protocol to enable whole-weather measurement of photosynthetic parameters of rice grown in the paddy fields. Using HAPS, we can conduct photosynthetic measurements with a time span much longer than that appropriate for the outdoor measurements. Comparative study shows that photosynthetic parameters obtained with the new protocol can effectively represent the parameters in the fields. There was much less standard deviation for measurements using HAPS compared to the outdoor measurements, no matter for technical replications of each recording or for biological replications of each leaf position. This new facility and protocol enables rice photosynthetic physiology studies to be less tough but more efficient, and provides a potential option for large scale studies of rice leaf photosynthesis.
Improving photosynthetic efficiency is recognized as a major approach to increase crop yields (Long et al, 2006; Zhu et al, 2010). So far, unfortunately, improving photosynthetic efficiency has not been effectively used in the improvements of crop yields. A number of reasons might be related to these, including emphasizing leaf instead of canopy photosynthesis (Zhu et al, 2012; Song et al, 2016) and the difficulty of conducting large scale measurement of photosynthetic physiology in the fields, which discourage genetic studies of photosynthesis. And therefore, what are the major barriers preventing large scale studies of photosynthetic parameters? Though changes in photosynthetic physiological parameters usually take a few days (Geiger, 1976; Oguchi et al, 2003; Schrö der et al, 2005), the instantaneous photosynthetic properties, such as the rubisco activation state, stomatal conductance and operating efficiency of photosystem II, are influenced by the environmental conditions, such as light and temperature (Demmig-Adams et al, 1989; Collatz et al, 1991; Salvucci and Crafts-Brandner, 2004). Unfortunately, stable light environments are usually not available in the fields. The high level of environmental heterogeneities makes it difficult to conduct field photosynthetic physiological measurements, in particular in regions where the weather conditions vary frequently. Partially as a result of the high level of environmental variations, stable and reliable measurements of photosynthetic rates are only possible when experiments are conducted between late-morning to mid-afternoon on a sunny day (Xu, 2006), since photosynthetic rates measured in the late-afternoon or on cloudy or overcast day usually are lower and inaccurate (Chen and inaclurate, 2006). Besides the high level of diurnal variability, many rice paddy field conditions can be too demanding to perform field measurements. These limitations make large scale field phenotyping of photosynthetic parameters in a large genetic population difficult to implement.
Growing large panels of crop varieties or accessions in the greenhouse and measuring photosynthetic physiology in the laboratory can be used as an effective option to study the photosynthetic physiology. However, many laboratory and field experiments show that plants grown in the fields show drastic difference in the photosynthetic parameters (Mahon and Hobbs, 1981; Mishra et al, 2012; Kolari et al, 2014). Plants in the fields routinely experience dynamic environments, such as changes in light, temperature and humidity, which can not be easily replicated in the greenhouse. The light quality, nutrition components, and soil depth etc. in laboratory usually cannot meet the growth demand of crop plants such as maize and rice. As a result, the parameters obtained in laboratory can not represent the actual physiological parameters of plants grown in the fields, even without considering that practical space limitation of growing large genetic populations in a greenhouse.
An indoor gas exchange measurement method commonly used for field-grown plants is to use leaves detached from the fields. Driever et al (2014) conducted large scale photosynthetic measurements of field-grown wheat in the laboratory using detached tillers. Leakey et al (2006) also measured photosynthetic carbon dioxide response curve (A-Ci curve) and photosynthetic light response curve (A-Q curve) with excised leaves of maize. However, the feasibility of the method in rice has never been evaluated. In this study, we first explored the feasibility of the protocol that measuring photosynthesis in detached rice leaves. Furthermore, to overcome difficulties in accurate and high-throughput characterization of photosynthetic parameters for field-grown rice, we designed a new indoor measurement facility high-efficiency all-weather photosynthetic measurements system (HAPS) and a related indoor measurement protocol.
Field experiments were conducted at Songjiang breeding station (30º 56′ 44′ ′ N, 121º 8′ 1′ ′ E) of the Shanghai Institutes of Plant Physiology and Ecology, Shanghai, China. A japonica rice variety Xiushui 134 was used. Seeds after germination were sown on seedbeds in the field on 1 June, 2015, and seedlings were transplanted to field on 26 June, 2015. One plant was transplanted into each hill at a planting density of 25 hills/m2 (0.20 m × 0.20 m). The rice plants started rapid shoot elongation on 10 August and flowering on 8 September, and were harvested on 28 October, 2015. Nitrogen fertilizer was applied at a rate of 200 kg/hm2 with 35%, 35% and 30% of the total nitrogen fertilizer applied at the pre-transplanting, tillering and booting stages, respectively. Phosphate (P2O5) and potassium (K2O) fertilizers were both applied as basal fertilizers before transplantation at the rate of 150 kg/hm2. Weeds, pests and diseases were controlled periodically with herbicides, insecticides and fungicides.
A-Ci and A-Q curves were measured weekly with a LI-6400 infrared analyzer (Li-Cor Inc., Lincoln, Nebraska, USA) after 30 July, 2015. Before indoor measurements, plants were dug from the field. Two neighboring plants were dug out together with adhesive soil and put into a bucket. Four buckets (eight plants) were sampled each time for each treatment. Plants were placed in the measurement facility for one-day adaptation [a level of 1 800 μ mol/(m2∙ s) artificial light was turned on at 6:30 am and turned off at 18:00 pm], after which measurements were conducted. For both outdoor and indoor measurements, plants located at the edge of rows or columns were not used to avoid boundary effects.
For A-Ci curve measurements, we first set the light intensity being 1 800 μ mol/(m2∙ s), air flow rate being 500 μ mol/s, leaf chamber block temperature being 30 º C, which matched ambient air temperature and was suitable for rice leaf physiological activity, and reference CO2 concentration being 425 μ mol/mol, and maintained leaves under such a condition for 15 min for adaptation and stabilization of leaf photosynthesis. Then, we used the following reference CO2 concentrations 425, 350, 250, 150, 100 and 50 μ mol/mol for 2.5 min before logging data at each iteration. After that, we set reference CO2 concentration back to 425 μ mol/mol for 10 min. Afterwards, we set another loop of changing reference CO2 concentrations, 425, 500, 600, 700, 900, 1 100, 1 400 and 1 800 μ mol/mol for 2.5 min before logging at each iteration. At last, we finished logging and set reference CO2 concentration back to 425 μ mol/mol.
For A-Q curve measurements, we first set air flow rate being 500 μ mol/s, leaf chamber block temperature being 30 º C, reference CO2 concentration being 400 μ mol/mol and the initial light intensity being 2 000 μ mol/(m2∙ s), and kept leaves under such a condition for 20 min. Then we set a loop for changing through a series of light intensities, 2 000, 1 800, 1 600, 1 400, 1 200, 1 000, 800, 600, 400, 200, 100, 50, 25 and 0 μ mol/(m2∙ s) for 2 min before logging at each iteration. At last, we finished logging and set light intensity to 1 000 μ mol/(m2∙ s).
For each logging, we recorded data every other second for 5 times. The mean value was used as the measured data and the standard deviation was used to represent the measurement variation.
For A-Ci curve, we followed the method proposed by Gu et al (2010). To prevent over-fitting, we fixed dark respiration rate Rd to be 1 μ mol/(m2∙ s). Values of CO2 compensation point in the absence of dark respiration, Michaelis Menten constants (Ko and Kc) and temperature response function for these parameters were taken from Bernacchi et al (2001). A-Q curve was fitted with the classical non-rectangular hyperbola model:
An =A - Rd
Where A is the gross photosynthetic rate, An is the net photosynthetic rate, Rd is the dark respiration rate, I is incident irradiance and the remaining three parameters define the maximum apparent quantum yield (ϕ CO2), gross photosynthetic rate under saturate incident light intensity (Asat), and the curvature (θ ).
To test whether rice plant photosynthetic response curves can be measured with detached leaves, we measured A-Ci and A-Q curves of attached and detached leaves for a lab-grown japonica rice, Nipponbare, with the same protocol described above, except that the leaf chamber block temperature was set to 25 º C, which was consistent with the temperature in the laboratory. Light period used for the rice growth is 16 h light and 8 h dark. Light intensity was 1 000 μ mol/(m2∙ s). The first fully expanded leaves of the 14-week-old rice seedlings were used for gas exchange measurements. Leaves were measured before detachment and at different time after detachment, i.e. 0, 1 and 3 h for A-Ci curves and 0, 2 and 4 h for A-Q curves. We used different detached leaves for photosynthetic measurement at different time points after detachment to avoid sampling bias, namely, six groups of leaves were used in the comparative study. During the leaf detachment, leaves together with the relevant tillers were cut from the base of the plant, followed by immediate recutting of the shoot (5 cm above the original incision) under water by the method described in Driever et al (2014). Finally, the ratio of photosynthetic CO2 uptake rate in the detached leaf to that of the same leaf before detachment was used to examine the potential impact of detachment on leaf photosynthetic physiology.
Fig. 1-A shows the large level of weather variations at Songjiang, Shanghai, which is a typical rice grown region in China. Similarly, during a diurnal cycle, there was also large variation in light radiation (Fig. 1-B), which caused great variations in the measured photosynthetic CO2 uptake rates within a single day (Fig. 1-C and -D). This brought great challenge to leaf photosynthetic measurement, especially for comparative studies among different rice lines (e.g., comparative study of wild type and different mutated strains, genome- wide association study for a large rice population).
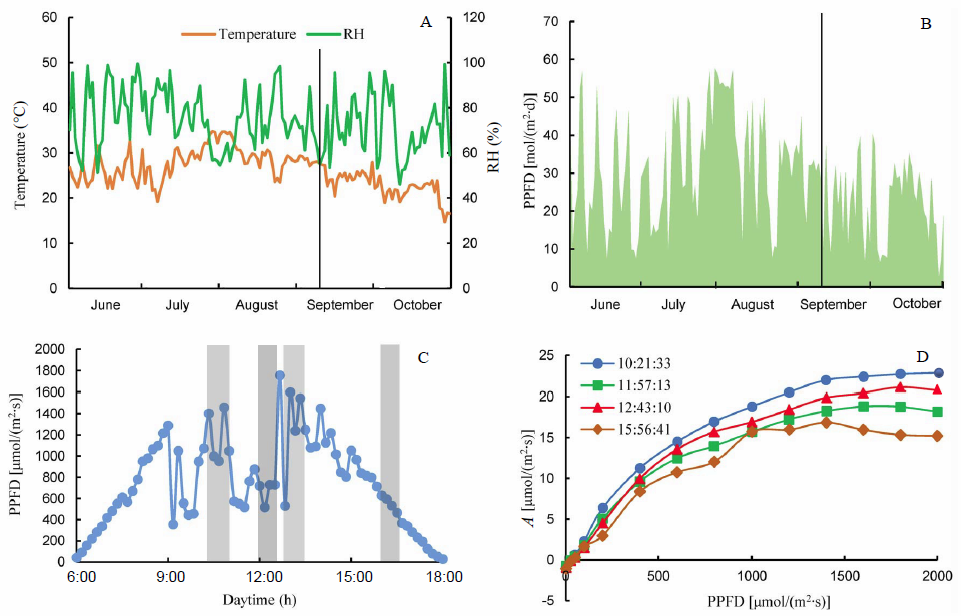 | Fig. 1. Weather variations throughout the year and photosynthetic light response curves (A-Q curves) on a typical cloudy day at Songjiang Experimental Station, Shanghai, China in 2015. A, Average daytime temperature and average daytime relative humidity (RH); B, Daily integrated photosynthetically active photon flux density (PPFD); C, Daytime light level variation of 10 September; D, A-Q curves measured outdoor under different incident radiations on 10 September. Lines in parts A and B correspond to the date of 10 September. |
For all the six groups in the comparative study, we found that detached rice leaves always showed a dramatically decreased stomatal conductance as well as photosynthesis rate in both A-Ci and A-Q curves compared with measurements before detaching treatment (Fig. 2), no matter measured immediately after detachment (0 h-AD in Fig. 2-A) or after certain time light acclimation (1 h-AD and 3 h-AD in Fig. 2-A).
 | Fig. 2. Comparison of photosynthetic curves and stomatal conductance curves of attached leaves and detached leaves. A, Comparison of A-Ci curves measured on leaves before detachment (BD), immediately after detachment (0 h-AD), 1 h after detachment (1 h-AD) and 3 h after detachment (3 h-AD); B, Comparison of gs-Ci curves before and after detachment; C, Comparison of A-Q curves before and after detachment; D, Comparison of gs-Q curves before and after detachment. PPFD, Phtosynthetically active photon flux density. |
We designed a new indoor HAPS to deal with the dilemma (Fig. 3-A). HAPS consists of several independent modules, including light-emitting diodes (LED) arrays (45 cm × 45 cm × 10 cm), each of which contains 15 lines (parallel connection) and 15 rows (series connection) LEDs (XLamp XP-E2, CREE, USA), cooling fans (12 cm × 12 cm × 3 cm, ADN512XB-A9B, ADDA, Taiwan, China), decomposable steel support frames with height-adjustable support plates (100 cm × 50 cm × 200 cm) and walls covered with light-reflecting aluminum film (Metallic PET Film, STARLEAD, China). For each LED array, we used a programmable constant current power supply (RSP-750-48, Mean Well, Taiwan, China) to drive the LEDs and the radiator fans. The light intensity of artificial LED light source can be fine-tuned. The size of the facility is adjustable since HAPS can be easily assembled based on the independent modules mentioned above. The typical volume of the facility is 200 cm in length, 100 cm in width, and 200 cm in height (Fig. 3-A). During the measurement, we put the infrared gas analyzers (e.g. LI-6400) outside the frame to save space while the leaf chambers are placed on the adjustable support plates besides plants (not shown). We also designed a new high performance lithium battery, which, after it is fully charged, can support the operation of a LI-6400 for more than 7 h (Fig. 3-B). And the instrument is lighter and more useful when working for long time in the field. Plants posture in HAPS is shown in Fig. 3-C (notice that we removed the light- reflecting aluminum film to avoid dazzle light in the picture). Light intensity at different layers of plants and light spectrum are shown in Fig. 3-D and -E, respectively.
 | Fig. 3. The new indoor photosynthetic measurements facility high-efficiency all-weather photosynthetic measurements system (HAPS). A, Overall design of HAPS; B, Self-designed high performance lithium battery with independent adaptor socket versus standard lead-acid battery provided by Li-Cor Inc; C, Plants in HAPS and measurement of distance to artificial light source of different leaf-position leaves; D, Attenuation of light levels with distance from the light source (Mean ± SD, n = 4), and the lines show the average distances from light source of flag leaf, the 3rd and the 5th leaves from the top; E, Light spectrum of artificial light-emitting diodes source used in HAPS. |
We further tested whether measurements using HAPS can faithfully represent the physiological properties of outdoor plants. No significant difference was found between the HAPS measured and in situ measured A-Ci and A-Q curves (Fig. 4). There were no significant changes in the calculated photosynthetic parameters (Vcmax, Jmax, ϕ CO2, Asat and Rd) (data not shown).
 | Fig. 4. Comparison of measured photosynthetic carbon dioxide response curves (A-Ci curves, A) and photosynthetic light response curves (A-Q curves, B) using high-efficiency all-weather photosynthetic measurement systems and measured in situ (Mean ± SD). PPFD, Phtosynthetically active photon flux density. Four replications from different blocks were included in each curve, and no statistical significant difference was found. |
| Table 1 Fitted parameters measured indoor or outdoor at different growth stages (Mean ± SD, n = 4). |
Using HAPS, we conducted A-Ci curve and A-Q curve measurements between 9:00 am and 5:00 pm, a time span much longer than that appropriate for the outdoor measurements (usually 9:30 am to 3:30 pm) (Table 1). HAPS can be used to conduct measurements for even longer period as required by experiments. Furthermore, the estimated photosynthetic parameters using HAPS showed less standard deviations as compared to those from in situ measurements for all the growth stages (Table 1), regardless of the weather condition on the measuring day (Supplemental Fig. 1). During each data recording, we logged the photosynthesis rate five times consecutively. Using these data, we estimated the variation of photosynthesis rates during the data recording. Our results showed that there was much less standard deviation for each recording using HAPS compared to in situ (Fig. 5).
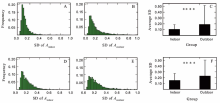
 | Fig. 5. Standard deviation of photosynthesis rate for each recording using high-efficiency all-weather photosynthetic measurement systems (HAPS) and in situ measurement during whole growth season. A, Standard deviation (SD) distribution of recordings using HAPS for A-Ci curves; B, SD distribution of recordings for in situ measurement of A-Ci curves; C, Comparison of average SDs for recordings using HAPS and recordings for in situ measurement of A-Ci curves (Mean ± SD, n = 1 982); D, SD distribution of recordings using HAPS for A-Q curves measurement; E, SD distribution of recordings for in situ measurement of A-Q curves; F, Comparison of average SDs for recordings using HAPS and recordings forin situ measurement of A-Q curves (Mean ± SD, n = 1 328). There are more than 1 000 records for each distribution shown in panel A, B, D and E. * * * * meansP-value < 10-7. |
The challenges of field measurement of photosynthesis have been long appreciated and conducting physiological parameter measurements indoor seems an apparent option. However, so far, there is no systematic comparison between indoor and outdoor photosynthetic parameter measurements. The commonly used indoor gas exchange measurement method for field-grown plants is using detached leaves, as done in wheat (Driever et al, 2014) and maize (Leakey et al, 2006). However, whether this approach works in rice has not been evaluated. Our results indicated that detached rice leaves showed a dramatic decrease in stomatal conductance as well as photosynthesis rates even when measured immediately after detachment (Fig. 2). This might be due to the high transpiration rate of rice (Tanguilig et al, 1987), which makes rice leaves more prone to water loss. In contrast, physiological parameters derived from HAPS can be an effective surrogate of the physiological parameters of field-growth rice plants in situ (Fig. 4).
There are several major features of HAPS. Firstly, measurements with HAPS is not influenced by the weather and field conditions. For example, in a paddy rice field where it is difficult to conduct detailed photosynthetic measurements, and in areas with constantly changing weather conditions, such as the rainy summer weather conditions in subtropics monsoon climate regions, HAPS can be very helpful. In fact, as shown by the less standard deviations from estimated photosynthetic parameters from the indoor measurements (Table 1), using HAPS may also be a preferred option even when the weather and field conditions allows outdoor measurements, unless the purpose of the study is to measure the diurnal changes of photosynthetic parameters in the field.
Furthermore, HAPS can be used for measuring rice photosynthetic properties between 9:00 am and 5:00 pm, during which period the measured photosynthetic rates are relatively stable. This is in contrast to the typical rice outdoor photosynthetic physiological parameter measurement, for which the measurement is usually constrained between 9:30 am to 3:00 pm. This feature, together with the above-mentioned suitability of measurements under different weather and field conditions, makes this protocol a potential option to conduct large scale rice photosynthetic rate measurement in the fields. Here, we provide an estimate of the time needed to use HAPS to perform a genetic study of Pn as an example. Firstly, if a leaf is well light adapted before measurements, it may take about 3 min for each Pnmeasurement. Then, for a moderate sized genetic population, e.g. a population with 192 rice lines with 5 replication, it may take 48 h, with enough labors and well organized workflow. Namely, Pn phenotyping could be finished in about 6 d using two typical size (200 cm × 100 cm × 200 cm) HAPS (one for photosynthesis measurement and the other for light adaptation of plants at a time) with one gas exchange infra-red analyzer (e.g. LI-6400).
Additionally, HAPS can be easily assembled and disassembled and doesn’ t occupy much space. And thanks to the excellent battery life of the self-designed lithium battery (Fig. 3-B), one doesn’ t need to worry about automatic shutdown of the machine in the case of low battery during measurements, and can easily manipulate multiple machines simultaneously on his/her own. Concurrently, the light intensity of LED array in HAPS can be fine-tuned, which can meet various needs of acclimation light intensity for different crops (e.g., rice and maize has high saturation light, whereas winter wheat has relatively lower). What’ s more, with a programmable logic controller, one can set the change pattern of the light intensity versus time, thus to do more studies about fast light response such as influence of delayed stomatal response to fluctuant incident light on radiation use efficiency and water use efficiency (unpublished data).
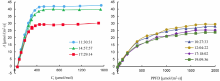
Several precautions need to be taken when using HAPS. Firstly, when moving rice plants from the field to the indoor, more soil needs to be moved together with the rice plants to avoid damaging the root system. Secondly, at least one hour light acclimation is needed before the measurements. The optimal light levels for acclimation might differ among plant species. For rice, to our experience, a high light level is needed (which can also be inferred from Fig. 1-B, -C and Fig. 4-B). Concurrently, it should be aware that though HAPS extended the time span that is appropriate for the measurements, measured photosynthesis rate was still gradually decreased after 5:00 pm (Fig. 6), which is likely due to the influence of internal circadian rhythm (Hennessey and Field, 1991). Though we observed no mid-day depression in this study, it is advised to check whether mid-day depression might have occurred if other rice lines are used.
One major advantage of using HAPS compared to greenhouse or phytotron is that we can measure plants grown under field conditions, which are most relevant to agriculture. The field-grown plants may show rather different growth and developmental patterns, as compared to plants grown in greenhouses and phytotrons. In addition, many of the field treatments and agronomic practices, such as irrigation scheduling, fertilizer application and planting density manipulation, are easier to apply in the field than in greenhouses or phytotrons.
 | Fig. 6. Typical indoor photosynthetic carbon dioxide response curves (A-Ci, left) and photosynthetic light response curves (A-Q, right) measured before 17:00 pm and after 17:00 pm using high-efficiency all-weather photosynthetic measurement systems. PPFD, Phtosynthetically active photon flux density. |
This study provides empirical data supporting using HAPS as an effective surrogate for rice photosynthetic performance in the fields. This new protocol holds potential to be used in studying not only rice photosynthetic physiology under demanding fields and weather conditions, but also genetic studies of photosynthetic physiological parameters using large genetic populations. Large scale study using a large genetic population is needed now to test its performance in genetics study of photosynthesis.
This research was financially supported by the Strategic Leading Project of Modular Designer Crop Breeding, Chinese Academy of Sciences (Grant No. XDA08020301).
The following material is available in the online version of this article at http://www.sciencedirect.com/science/ journal/16726308; http://www.ricescience.org.
Supplemental Fig. 1. Weather variations throughout the day for dates of photosynthetic measurements in Table 1.
The authors have declared that no competing interests exist.
| 1 |
|
| 2 |
|
| 3 |
|
| 4 |
|
| 5 |
|
| 6 |
|
| 7 |
|
| 8 |
|
| 9 |
|
| 10 |
|
| 11 |
|
| 12 |
|
| 13 |
|
| 14 |
|
| 15 |
|
| 16 |
|
| 17 |
|
| 18 |
|
| 19 |
|
| 20 |
|
| 21 |
|