Rice Science ›› 2015, Vol. 22 ›› Issue (2): 71-80.DOI: 10.1016/S1672-6308(14)60283-3
收稿日期:2014-09-02
接受日期:2014-12-09
出版日期:2015-03-10
发布日期:2015-01-27
. [J]. Rice Science, 2015, 22(2): 71-80.
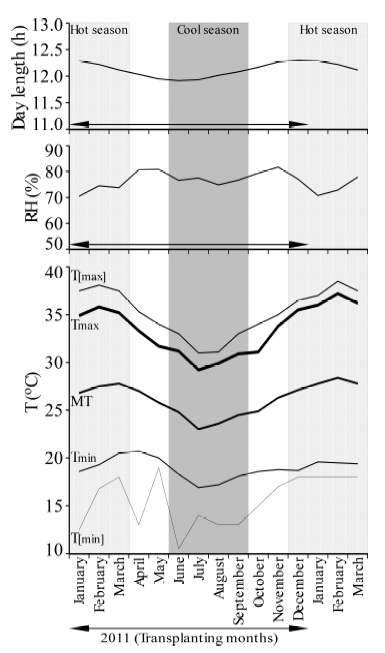
Fig. 1. Day length, relative humidity (RH), and temperature (T) from January 2011 to March 2012.MT, Monthly means of daily mean temperature; Tmax and Tmin, Monthly means of daily maximum and minimum temperatures, respectively; T[max] and T[min], Maximum and minimum temperatures in each month, respectively. The hot (grey) and cool (dark grey) seasons are arbitrarily determined based on long-term average recordings of temperature.
| Month | NERICA1 | Wahiwahi | |||||||||||||||
|---|---|---|---|---|---|---|---|---|---|---|---|---|---|---|---|---|---|
| Daywhole | Daypre | MTpre | ATpre | Daypost | MTpost | ATpost | TMinPI | Daywhole | Daypre | MTpre | ATpre | Daypost | MTpost | ATpost | TMinPI | ||
| (d) | (d) | (ºC) | (ºC) | (d) | (ºC) | (ºC) | (ºC) | (d) | (d) | (ºC) | (ºC) | (d) | (ºC) | (ºC) | (ºC) | ||
| January | 112 | 78 | 27.5 | 2 149 | 34 | 27.2 | 924 | 18 | 116 | 80 | 27.5 | 2 203 | 36 | 27 | 974 | 18 | |
| February | 117 | 82 | 27.6 | 2 259 | 35 | 25.8 | 904 | 20 | 117 | 83 | 27.5 | 2 286 | 34 | 25.8 | 877 | 20 | |
| March | 116 | 81 | 27 | 2 184 | 35 | 25 | 877 | 19 | 116 | 81 | 27 | 2 184 | 35 | 25 | 877 | 19 | |
| April | 126 | 84 | 26 | 2 187 | 42 | 23.3 | 978 | 10.5 | 126 | 87 | 26 | 2 261 | 39 | 23.2 | 905 | 10.5 | |
| May | 130 | 91 | 24.4 | 2 222 | 39 | 23.8 | 930 | 15 | 144 | 93 | 24.4 | 2 270 | 51 | 24.1 | 1228 | 16 | |
| June | 123 | 88 | 23.7 | 2 089 | 35 | 24.5 | 858 | 13.9 | 137 | 87 | 23.7 | 2 065 | 50 | 24.4 | 1221 | 13.9 | |
| July | 123 | 89 | 23.7 | 2 112 | 34 | 25.3 | 861 | 14 | 131 | 98 | 23.7 | 2 327 | 33 | 25.1 | 835 | 13 | |
| August | 112 | 79 | 24.1 | 1 907 | 33 | 26.2 | 863 | 17 | 116 | 80 | 24.1 | 1 932 | 36 | 26.2 | 943 | 18 | |
| September | 110 | 76 | 25 | 1 902 | 34 | 26.6 | 906 | 17 | 112 | 80 | 25.1 | 2 007 | 32 | 26.7 | 856 | 17 | |
| October | 110 | 76 | 26 | 1 978 | 34 | 27.6 | 940 | 18 | 123 | 91 | 26.2 | 2 385 | 32 | 27.8 | 891 | 18 | |
| November | 104 | 70 | 26.9 | 1 881 | 34 | 28.1 | 955 | 18 | 118 | 84 | 27 | 2 272 | 34 | 28.2 | 959 | 18 | |
| December | 110 | 75 | 27.6 | 2 068 | 35 | 27.7 | 971 | 18 | 119 | 82 | 27.7 | 2 268 | 37 | 27.8 | 1029 | 18 | |
| Mean | 116 | 81 | 25.8 | 2 078 | 35 | 25.9 | 914 | 16.5 | 123 | 86 | 25.8 | 2 205 | 37 | 26 | 966 | 16.6 | |
| SD | 8 | 6.3 | 1.5 | 132 | 3 | 1.6 | 43 | 2.7 | 10 | 5.9 | 1.5 | 136 | 6 | 1.6 | 132 | 2.8 | |
| Month | IR64 | TXD306 | |||||||||||||||
| Daywhole | Daypre | MTpre | ATpre | Daypost | MTpost | ATpost | TMinPI | Daywhole | Daypre | MTpre | ATpre | Daypost | MTpost | ATpost | TMinPI | ||
| (d) | (d) | (ºC) | (ºC) | (d) | (ºC) | (ºC) | (ºC) | (d) | (d) | (ºC) | (ºC) | (d) | (ºC) | (ºC) | (ºC) | ||
| January | 123 | 87 | 27.5 | 2 394 | 36 | 26.9 | 967 | 18 | 134 | 100 | 27.4 | 2 743 | 34 | 26.5 | 901 | 19 | |
| February | 138 | 102 | 27.3 | 2 783 | 36 | 25.3 | 911 | 19 | 146 | 109 | 27.2 | 2 961 | 37 | 25 | 924 | 19 | |
| March | 125 | 90 | 26.8 | 2 414 | 35 | 24.6 | 863 | 18 | 147 | 113 | 26.4 | 2 987 | 34 | 23.1 | 785 | 10.5 | |
| April | 147 | 108 | 25.4 | 2 748 | 39 | 23.3 | 908 | 14 | 155 | 118 | 25.2 | 2 971 | 37 | 23.7 | 878 | 14 | |
| May | 141 | 101 | 24.4 | 2 460 | 40 | 24.1 | 964 | 13 | 154 | 118 | 24.2 | 2 855 | 36 | 24.5 | 883 | 13.9 | |
| June | 139 | 103 | 23.9 | 2 458 | 36 | 24.4 | 878 | 17 | 151 | 117 | 24 | 2 803 | 34 | 24.7 | 838 | 14 | |
| July | 140 | 105 | 23.8 | 2 498 | 35 | 25.7 | 901 | 15 | 152 | 117 | 23.9 | 2 795 | 35 | 26.2 | 917 | 18 | |
| August | 130 | 97 | 24.5 | 2 377 | 33 | 26.5 | 874 | 18 | 145 | 112 | 24.7 | 2 771 | 33 | 26.8 | 885 | 17 | |
| September | 125 | 89 | 25.2 | 2 242 | 36 | 27 | 973 | 18 | 145 | 110 | 25.5 | 2 808 | 35 | 27.6 | 966 | 18 | |
| October | 123 | 88 | 26.2 | 2 304 | 35 | 27.8 | 973 | 18 | 144 | 110 | 26.5 | 2 918 | 34 | 28.2 | 957 | 18 | |
| November | 118 | 83 | 27 | 2 245 | 35 | 28.2 | 986 | 18 | 134 | 99 | 27.2 | 2 690 | 35 | 27.8 | 974 | 18 | |
| December | 125 | 90 | 27.7 | 2 492 | 35 | 27.8 | 974 | 18 | 135 | 101 | 27.6 | 2 787 | 34 | 27.6 | 939 | 18 | |
| Mean | 131 | 95 | 25.8 | 2 451 | 36 | 26 | 931 | 17 | 145 | 110 | 25.8 | 2 841 | 35 | 26 | 904 | 16.5 | |
| SD | 9 | 8.3 | 1.5 | 171 | 2 | 1.6 | 46 | 1.9 | 7 | 7 | 1.4 | 97 | 1 | 1.7 | 55 | 2.7 | |
Table 1 Growth duration, mean and accumulated temperatures of NERICA1, Wahiwahi, IR64 and TXD306 transplanted monthly from January to December 2011.
| Month | NERICA1 | Wahiwahi | |||||||||||||||
|---|---|---|---|---|---|---|---|---|---|---|---|---|---|---|---|---|---|
| Daywhole | Daypre | MTpre | ATpre | Daypost | MTpost | ATpost | TMinPI | Daywhole | Daypre | MTpre | ATpre | Daypost | MTpost | ATpost | TMinPI | ||
| (d) | (d) | (ºC) | (ºC) | (d) | (ºC) | (ºC) | (ºC) | (d) | (d) | (ºC) | (ºC) | (d) | (ºC) | (ºC) | (ºC) | ||
| January | 112 | 78 | 27.5 | 2 149 | 34 | 27.2 | 924 | 18 | 116 | 80 | 27.5 | 2 203 | 36 | 27 | 974 | 18 | |
| February | 117 | 82 | 27.6 | 2 259 | 35 | 25.8 | 904 | 20 | 117 | 83 | 27.5 | 2 286 | 34 | 25.8 | 877 | 20 | |
| March | 116 | 81 | 27 | 2 184 | 35 | 25 | 877 | 19 | 116 | 81 | 27 | 2 184 | 35 | 25 | 877 | 19 | |
| April | 126 | 84 | 26 | 2 187 | 42 | 23.3 | 978 | 10.5 | 126 | 87 | 26 | 2 261 | 39 | 23.2 | 905 | 10.5 | |
| May | 130 | 91 | 24.4 | 2 222 | 39 | 23.8 | 930 | 15 | 144 | 93 | 24.4 | 2 270 | 51 | 24.1 | 1228 | 16 | |
| June | 123 | 88 | 23.7 | 2 089 | 35 | 24.5 | 858 | 13.9 | 137 | 87 | 23.7 | 2 065 | 50 | 24.4 | 1221 | 13.9 | |
| July | 123 | 89 | 23.7 | 2 112 | 34 | 25.3 | 861 | 14 | 131 | 98 | 23.7 | 2 327 | 33 | 25.1 | 835 | 13 | |
| August | 112 | 79 | 24.1 | 1 907 | 33 | 26.2 | 863 | 17 | 116 | 80 | 24.1 | 1 932 | 36 | 26.2 | 943 | 18 | |
| September | 110 | 76 | 25 | 1 902 | 34 | 26.6 | 906 | 17 | 112 | 80 | 25.1 | 2 007 | 32 | 26.7 | 856 | 17 | |
| October | 110 | 76 | 26 | 1 978 | 34 | 27.6 | 940 | 18 | 123 | 91 | 26.2 | 2 385 | 32 | 27.8 | 891 | 18 | |
| November | 104 | 70 | 26.9 | 1 881 | 34 | 28.1 | 955 | 18 | 118 | 84 | 27 | 2 272 | 34 | 28.2 | 959 | 18 | |
| December | 110 | 75 | 27.6 | 2 068 | 35 | 27.7 | 971 | 18 | 119 | 82 | 27.7 | 2 268 | 37 | 27.8 | 1029 | 18 | |
| Mean | 116 | 81 | 25.8 | 2 078 | 35 | 25.9 | 914 | 16.5 | 123 | 86 | 25.8 | 2 205 | 37 | 26 | 966 | 16.6 | |
| SD | 8 | 6.3 | 1.5 | 132 | 3 | 1.6 | 43 | 2.7 | 10 | 5.9 | 1.5 | 136 | 6 | 1.6 | 132 | 2.8 | |
| Month | IR64 | TXD306 | |||||||||||||||
| Daywhole | Daypre | MTpre | ATpre | Daypost | MTpost | ATpost | TMinPI | Daywhole | Daypre | MTpre | ATpre | Daypost | MTpost | ATpost | TMinPI | ||
| (d) | (d) | (ºC) | (ºC) | (d) | (ºC) | (ºC) | (ºC) | (d) | (d) | (ºC) | (ºC) | (d) | (ºC) | (ºC) | (ºC) | ||
| January | 123 | 87 | 27.5 | 2 394 | 36 | 26.9 | 967 | 18 | 134 | 100 | 27.4 | 2 743 | 34 | 26.5 | 901 | 19 | |
| February | 138 | 102 | 27.3 | 2 783 | 36 | 25.3 | 911 | 19 | 146 | 109 | 27.2 | 2 961 | 37 | 25 | 924 | 19 | |
| March | 125 | 90 | 26.8 | 2 414 | 35 | 24.6 | 863 | 18 | 147 | 113 | 26.4 | 2 987 | 34 | 23.1 | 785 | 10.5 | |
| April | 147 | 108 | 25.4 | 2 748 | 39 | 23.3 | 908 | 14 | 155 | 118 | 25.2 | 2 971 | 37 | 23.7 | 878 | 14 | |
| May | 141 | 101 | 24.4 | 2 460 | 40 | 24.1 | 964 | 13 | 154 | 118 | 24.2 | 2 855 | 36 | 24.5 | 883 | 13.9 | |
| June | 139 | 103 | 23.9 | 2 458 | 36 | 24.4 | 878 | 17 | 151 | 117 | 24 | 2 803 | 34 | 24.7 | 838 | 14 | |
| July | 140 | 105 | 23.8 | 2 498 | 35 | 25.7 | 901 | 15 | 152 | 117 | 23.9 | 2 795 | 35 | 26.2 | 917 | 18 | |
| August | 130 | 97 | 24.5 | 2 377 | 33 | 26.5 | 874 | 18 | 145 | 112 | 24.7 | 2 771 | 33 | 26.8 | 885 | 17 | |
| September | 125 | 89 | 25.2 | 2 242 | 36 | 27 | 973 | 18 | 145 | 110 | 25.5 | 2 808 | 35 | 27.6 | 966 | 18 | |
| October | 123 | 88 | 26.2 | 2 304 | 35 | 27.8 | 973 | 18 | 144 | 110 | 26.5 | 2 918 | 34 | 28.2 | 957 | 18 | |
| November | 118 | 83 | 27 | 2 245 | 35 | 28.2 | 986 | 18 | 134 | 99 | 27.2 | 2 690 | 35 | 27.8 | 974 | 18 | |
| December | 125 | 90 | 27.7 | 2 492 | 35 | 27.8 | 974 | 18 | 135 | 101 | 27.6 | 2 787 | 34 | 27.6 | 939 | 18 | |
| Mean | 131 | 95 | 25.8 | 2 451 | 36 | 26 | 931 | 17 | 145 | 110 | 25.8 | 2 841 | 35 | 26 | 904 | 16.5 | |
| SD | 9 | 8.3 | 1.5 | 171 | 2 | 1.6 | 46 | 1.9 | 7 | 7 | 1.4 | 97 | 1 | 1.7 | 55 | 2.7 | |
| Month | NERICA1 (kg/m2) | Wahiwahi (kg/m2) | IR64 (kg/m2) | TXD306 (kg/m2) | Mean rank | |||||||||||||||||||
|---|---|---|---|---|---|---|---|---|---|---|---|---|---|---|---|---|---|---|---|---|---|---|---|---|
| DWpre | DWpost | DWwhole | Y | DWpre | DWpost | DWwhole | Y | DWpre | DWpost | DWwhole | Y | DWpre | DWpost | DWwhole | Y | DWpre | DWpost | DWwhole | Y | |||||
| January | 1.38 | 0.16 | 1.54 | 0.39 | 1.59 | 0.39 | 1.98 | 0.45 | 1.01 | 0.61 | 1.62 | 0.29 | 1.81 | 0.29 | 2.1 | 0.17 | 5 | 7.8 | 7 | 8.5 | ||||
| February | 1.08 | 0.61 | 1.68 | 0.45 | 1.73 | 0.39 | 2.13 | 0.54 | 1.45 | 0.81 | 2.26 | 0.43 | 1.44 | 0.19 | 1.63 | 0.28 | 5.3 | 6.8 | 5.3 | 5.5 | ||||
| March | 1.57 | 0.41 | 1.98 | 0.37 | 2.12 | 0.47 | 2.59 | 0.38 | 1.19 | 1.04 | 2.23 | 0.57 | 1.25 | 0.33 | 1.59 | 0.2 | 5.8 | 5.5 | 3.8 | 7 | ||||
| April | 1.15 | 0.73 | 1.89 | 0.31 | 1.61 | 0.91 | 2.52 | 0.07 | 1.57 | 0.42 | 1.99 | 0.19 | 1.5 | 0.11 | 1.61 | 0.22 | 4.5 | 6.3 | 5.3 | 10.5 | ||||
| May | 1.3 | 0.7 | 1.99 | 0.37 | 1.32 | 1 | 2.32 | 0.02 | 1.4 | 0.31 | 1.71 | 0.15 | 1.79 | 0.43 | 2.22 | 0.38 | 4.8 | 4.8 | 3 | 9.8 | ||||
| June | 1.21 | 0.77 | 1.97 | 0.53 | 1.26 | 0.7 | 1.96 | 0.05 | 1.29 | 0.79 | 2.07 | 0.46 | 1.63 | 0.54 | 2.18 | 0.62 | 6.8 | 2.3 | 4.3 | 5.3 | ||||
| July | 1.21 | 0.77 | 1.98 | 0.53 | 1.52 | 0.38 | 1.9 | 0.5 | 1.68 | 0.44 | 2.13 | 0.57 | 1.69 | 0.45 | 2.14 | 0.5 | 4 | 5.5 | 4.5 | 2.5 | ||||
| August | 0.97 | 0.09 | 1.07 | 0.39 | 0.95 | 0.46 | 1.41 | 0.55 | 1.35 | 0.3 | 1.65 | 0.42 | 1.11 | 0.21 | 1.32 | 0.48 | 10.5 | 9 | 11.3 | 4.5 | ||||
| September | 0.76 | 0.48 | 1.24 | 0.36 | 1.04 | 0.39 | 1.43 | 0.41 | 1.53 | 0.29 | 1.82 | 0.53 | 1.15 | 0.44 | 1.58 | 0.4 | 9.3 | 7.5 | 9.5 | 6.3 | ||||
| October | 1.05 | 0.18 | 1.23 | 0.21 | 1.5 | 0.34 | 1.84 | 0.33 | 1.28 | 0.22 | 1.5 | 0.48 | 1.46 | 0.2 | 1.66 | 0.25 | 7.8 | 10.8 | 10 | 8.8 | ||||
| November | 1.04 | 0.42 | 1.46 | 0.37 | 1.71 | 0.53 | 2.24 | 0.61 | 1.39 | 0.21 | 1.6 | 0.51 | 1.35 | 0.43 | 1.78 | 0.37 | 6.8 | 7.3 | 7.5 | 5 | ||||
| December | 0.99 | 0.83 | 1.83 | 0.54 | 1.4 | 0.54 | 1.94 | 0.51 | 1.2 | 0.5 | 1.71 | 0.32 | 1.71 | 0.21 | 1.91 | 0.43 | 7.8 | 4.8 | 6.8 | 4.5 | ||||
| Mean | 1.14 | 0.51 | 1.65 | 0.4 | 1.48 | 0.54 | 2.02 | 0.37 | 1.36 | 0.5 | 1.86 | 0.41 | 1.49 | 0.32 | 1.81 | 0.36 | ||||||||
| SD | 0.21 | 0.26 | 0.34 | 0.1 | 0.32 | 0.22 | 0.37 | 0.21 | 0.18 | 0.26 | 0.26 | 0.14 | 0.24 | 0.14 | 0.29 | 0.14 | ||||||||
| P-value | 0.25 | 0.122 | 0.014 | 0.046 | ||||||||||||||||||||
Table 2 Shoot dry weight produced before flowering (DWpre), from flowering to maturity (DWpost) and during the whole growth period (DWwhole) and grain yields (Y) of NERICA1, Wahiwahi, IR64 and TXD306 transplanted monthly from January to December 2011.
| Month | NERICA1 (kg/m2) | Wahiwahi (kg/m2) | IR64 (kg/m2) | TXD306 (kg/m2) | Mean rank | |||||||||||||||||||
|---|---|---|---|---|---|---|---|---|---|---|---|---|---|---|---|---|---|---|---|---|---|---|---|---|
| DWpre | DWpost | DWwhole | Y | DWpre | DWpost | DWwhole | Y | DWpre | DWpost | DWwhole | Y | DWpre | DWpost | DWwhole | Y | DWpre | DWpost | DWwhole | Y | |||||
| January | 1.38 | 0.16 | 1.54 | 0.39 | 1.59 | 0.39 | 1.98 | 0.45 | 1.01 | 0.61 | 1.62 | 0.29 | 1.81 | 0.29 | 2.1 | 0.17 | 5 | 7.8 | 7 | 8.5 | ||||
| February | 1.08 | 0.61 | 1.68 | 0.45 | 1.73 | 0.39 | 2.13 | 0.54 | 1.45 | 0.81 | 2.26 | 0.43 | 1.44 | 0.19 | 1.63 | 0.28 | 5.3 | 6.8 | 5.3 | 5.5 | ||||
| March | 1.57 | 0.41 | 1.98 | 0.37 | 2.12 | 0.47 | 2.59 | 0.38 | 1.19 | 1.04 | 2.23 | 0.57 | 1.25 | 0.33 | 1.59 | 0.2 | 5.8 | 5.5 | 3.8 | 7 | ||||
| April | 1.15 | 0.73 | 1.89 | 0.31 | 1.61 | 0.91 | 2.52 | 0.07 | 1.57 | 0.42 | 1.99 | 0.19 | 1.5 | 0.11 | 1.61 | 0.22 | 4.5 | 6.3 | 5.3 | 10.5 | ||||
| May | 1.3 | 0.7 | 1.99 | 0.37 | 1.32 | 1 | 2.32 | 0.02 | 1.4 | 0.31 | 1.71 | 0.15 | 1.79 | 0.43 | 2.22 | 0.38 | 4.8 | 4.8 | 3 | 9.8 | ||||
| June | 1.21 | 0.77 | 1.97 | 0.53 | 1.26 | 0.7 | 1.96 | 0.05 | 1.29 | 0.79 | 2.07 | 0.46 | 1.63 | 0.54 | 2.18 | 0.62 | 6.8 | 2.3 | 4.3 | 5.3 | ||||
| July | 1.21 | 0.77 | 1.98 | 0.53 | 1.52 | 0.38 | 1.9 | 0.5 | 1.68 | 0.44 | 2.13 | 0.57 | 1.69 | 0.45 | 2.14 | 0.5 | 4 | 5.5 | 4.5 | 2.5 | ||||
| August | 0.97 | 0.09 | 1.07 | 0.39 | 0.95 | 0.46 | 1.41 | 0.55 | 1.35 | 0.3 | 1.65 | 0.42 | 1.11 | 0.21 | 1.32 | 0.48 | 10.5 | 9 | 11.3 | 4.5 | ||||
| September | 0.76 | 0.48 | 1.24 | 0.36 | 1.04 | 0.39 | 1.43 | 0.41 | 1.53 | 0.29 | 1.82 | 0.53 | 1.15 | 0.44 | 1.58 | 0.4 | 9.3 | 7.5 | 9.5 | 6.3 | ||||
| October | 1.05 | 0.18 | 1.23 | 0.21 | 1.5 | 0.34 | 1.84 | 0.33 | 1.28 | 0.22 | 1.5 | 0.48 | 1.46 | 0.2 | 1.66 | 0.25 | 7.8 | 10.8 | 10 | 8.8 | ||||
| November | 1.04 | 0.42 | 1.46 | 0.37 | 1.71 | 0.53 | 2.24 | 0.61 | 1.39 | 0.21 | 1.6 | 0.51 | 1.35 | 0.43 | 1.78 | 0.37 | 6.8 | 7.3 | 7.5 | 5 | ||||
| December | 0.99 | 0.83 | 1.83 | 0.54 | 1.4 | 0.54 | 1.94 | 0.51 | 1.2 | 0.5 | 1.71 | 0.32 | 1.71 | 0.21 | 1.91 | 0.43 | 7.8 | 4.8 | 6.8 | 4.5 | ||||
| Mean | 1.14 | 0.51 | 1.65 | 0.4 | 1.48 | 0.54 | 2.02 | 0.37 | 1.36 | 0.5 | 1.86 | 0.41 | 1.49 | 0.32 | 1.81 | 0.36 | ||||||||
| SD | 0.21 | 0.26 | 0.34 | 0.1 | 0.32 | 0.22 | 0.37 | 0.21 | 0.18 | 0.26 | 0.26 | 0.14 | 0.24 | 0.14 | 0.29 | 0.14 | ||||||||
| P-value | 0.25 | 0.122 | 0.014 | 0.046 | ||||||||||||||||||||
| Month | NERICA1 | Wahiwahi | IR64 | TXD306 | Mean rank | |||||||||||||||||||
|---|---|---|---|---|---|---|---|---|---|---|---|---|---|---|---|---|---|---|---|---|---|---|---|---|
| P | S | F (%) | G (g) | P | S | F (%) | G (g) | P | S | F (%) | G (g) | P | S | F (%) | G (g) | P | S | F | G | |||||
| January | 333 | 81.5 | 53.7 | 26.7 | 350 | 43.6 | 94.2 | 31.3 | 510 | 52.3 | 43.4 | 24.6 | 400 | 30.8 | 51.4 | 26.9 | 5.3 | 8.5 | 8.5 | 8 | ||||
| February | 243 | 89.1 | 77.5 | 27 | 280 | 71.1 | 81.3 | 33.3 | 493 | 51.1 | 65.5 | 26.1 | 277 | 63.3 | 59.3 | 26.7 | 9.5 | 3 | 6 | 5 | ||||
| March | 200 | 86.9 | 79.3 | 26.9 | 253 | 67.4 | 71.2 | 31.6 | 400 | 84.4 | 64.2 | 26.1 | 270 | 52.9 | 68.9 | 29.6 | 11.5 | 3.8 | 5.5 | 4.5 | ||||
| April | 293 | 50 | 77.8 | 27 | 260 | 80.8 | 10.2 | 32.3 | 587 | 33.2 | 39.2 | 24.7 | 333 | 53.8 | 46.6 | 26.7 | 7.5 | 8 | 9.8 | 7 | ||||
| May | 307 | 68.3 | 65.5 | 26.6 | 423 | 60 | 2.2 | 30.1 | 423 | 50.5 | 30.6 | 23.3 | 333 | 62.2 | 68 | 27.1 | 6.3 | 6.5 | 10 | 8.8 | ||||
| June | 313 | 81.5 | 75.4 | 17.2 | 727 | 60.8 | 3.6 | 32.4 | 480 | 56 | 66.3 | 25.6 | 380 | 76.1 | 75.5 | 28.3 | 5.3 | 3.8 | 4.8 | 6.3 | ||||
| July | 360 | 78.9 | 66.5 | 28.1 | 407 | 50.8 | 70.2 | 34.5 | 343 | 70.8 | 86.5 | 27.1 | 333 | 68.5 | 76.3 | 28.6 | 6.3 | 5.8 | 4.8 | 1.3 | ||||
| August | 220 | 80.3 | 81.2 | 27.5 | 357 | 66.5 | 72.1 | 31.9 | 387 | 73.9 | 60 | 24.3 | 413 | 56.5 | 72.1 | 28.3 | 7.8 | 5 | 5 | 5.8 | ||||
| September | 273 | 82.1 | 89.5 | 17.8 | 307 | 58.5 | 70.1 | 32.6 | 570 | 48.1 | 71.2 | 27 | 387 | 61.4 | 61.8 | 26.9 | 7 | 6.3 | 5.3 | 6.3 | ||||
| October | 253 | 43.4 | 73.6 | 25.8 | 317 | 58.3 | 61.8 | 28.6 | 727 | 40.8 | 67 | 24.4 | 497 | 35.7 | 55.2 | 25 | 4.8 | 10.5 | 7.8 | 10.8 | ||||
| November | 320 | 64.1 | 69 | 26.1 | 423 | 66.9 | 72.2 | 29.6 | 597 | 48.2 | 76.1 | 23.2 | 480 | 42.6 | 66.7 | 27 | 2.8 | 7.8 | 5.3 | 9.8 | ||||
| December | 360 | 62.1 | 86.8 | 27.6 | 393 | 52.8 | 75.5 | 32.8 | 617 | 38.9 | 52.3 | 25.1 | 403 | 61.2 | 64 | 27.2 | 3 | 9.3 | 5.5 | 4 | ||||
| Mean | 290 | 72.4 | 74.7 | 25.4 | 375 | 61.5 | 57.1 | 31.8 | 511 | 54 | 60.2 | 25.1 | 376 | 55.4 | 63.8 | 27.4 | ||||||||
| SD | 52 | 14.7 | 9.9 | 3.7 | 126 | 9.9 | 32.2 | 1.7 | 113 | 15.2 | 16.1 | 1.3 | 71 | 13.3 | 9.4 | 1.2 | ||||||||
| P-value | 0.034 | 0.062 | 0.296 | 0.014 | ||||||||||||||||||||
Table 3 Panicle number per unit area (P), spikelet number per panicle (S), grain-filling ratio (F), and 1000-grain weight (G) of NERICA1, Wahiwahi, IR64 and TXD306 transplanted monthly from January to December 2011.
| Month | NERICA1 | Wahiwahi | IR64 | TXD306 | Mean rank | |||||||||||||||||||
|---|---|---|---|---|---|---|---|---|---|---|---|---|---|---|---|---|---|---|---|---|---|---|---|---|
| P | S | F (%) | G (g) | P | S | F (%) | G (g) | P | S | F (%) | G (g) | P | S | F (%) | G (g) | P | S | F | G | |||||
| January | 333 | 81.5 | 53.7 | 26.7 | 350 | 43.6 | 94.2 | 31.3 | 510 | 52.3 | 43.4 | 24.6 | 400 | 30.8 | 51.4 | 26.9 | 5.3 | 8.5 | 8.5 | 8 | ||||
| February | 243 | 89.1 | 77.5 | 27 | 280 | 71.1 | 81.3 | 33.3 | 493 | 51.1 | 65.5 | 26.1 | 277 | 63.3 | 59.3 | 26.7 | 9.5 | 3 | 6 | 5 | ||||
| March | 200 | 86.9 | 79.3 | 26.9 | 253 | 67.4 | 71.2 | 31.6 | 400 | 84.4 | 64.2 | 26.1 | 270 | 52.9 | 68.9 | 29.6 | 11.5 | 3.8 | 5.5 | 4.5 | ||||
| April | 293 | 50 | 77.8 | 27 | 260 | 80.8 | 10.2 | 32.3 | 587 | 33.2 | 39.2 | 24.7 | 333 | 53.8 | 46.6 | 26.7 | 7.5 | 8 | 9.8 | 7 | ||||
| May | 307 | 68.3 | 65.5 | 26.6 | 423 | 60 | 2.2 | 30.1 | 423 | 50.5 | 30.6 | 23.3 | 333 | 62.2 | 68 | 27.1 | 6.3 | 6.5 | 10 | 8.8 | ||||
| June | 313 | 81.5 | 75.4 | 17.2 | 727 | 60.8 | 3.6 | 32.4 | 480 | 56 | 66.3 | 25.6 | 380 | 76.1 | 75.5 | 28.3 | 5.3 | 3.8 | 4.8 | 6.3 | ||||
| July | 360 | 78.9 | 66.5 | 28.1 | 407 | 50.8 | 70.2 | 34.5 | 343 | 70.8 | 86.5 | 27.1 | 333 | 68.5 | 76.3 | 28.6 | 6.3 | 5.8 | 4.8 | 1.3 | ||||
| August | 220 | 80.3 | 81.2 | 27.5 | 357 | 66.5 | 72.1 | 31.9 | 387 | 73.9 | 60 | 24.3 | 413 | 56.5 | 72.1 | 28.3 | 7.8 | 5 | 5 | 5.8 | ||||
| September | 273 | 82.1 | 89.5 | 17.8 | 307 | 58.5 | 70.1 | 32.6 | 570 | 48.1 | 71.2 | 27 | 387 | 61.4 | 61.8 | 26.9 | 7 | 6.3 | 5.3 | 6.3 | ||||
| October | 253 | 43.4 | 73.6 | 25.8 | 317 | 58.3 | 61.8 | 28.6 | 727 | 40.8 | 67 | 24.4 | 497 | 35.7 | 55.2 | 25 | 4.8 | 10.5 | 7.8 | 10.8 | ||||
| November | 320 | 64.1 | 69 | 26.1 | 423 | 66.9 | 72.2 | 29.6 | 597 | 48.2 | 76.1 | 23.2 | 480 | 42.6 | 66.7 | 27 | 2.8 | 7.8 | 5.3 | 9.8 | ||||
| December | 360 | 62.1 | 86.8 | 27.6 | 393 | 52.8 | 75.5 | 32.8 | 617 | 38.9 | 52.3 | 25.1 | 403 | 61.2 | 64 | 27.2 | 3 | 9.3 | 5.5 | 4 | ||||
| Mean | 290 | 72.4 | 74.7 | 25.4 | 375 | 61.5 | 57.1 | 31.8 | 511 | 54 | 60.2 | 25.1 | 376 | 55.4 | 63.8 | 27.4 | ||||||||
| SD | 52 | 14.7 | 9.9 | 3.7 | 126 | 9.9 | 32.2 | 1.7 | 113 | 15.2 | 16.1 | 1.3 | 71 | 13.3 | 9.4 | 1.2 | ||||||||
| P-value | 0.034 | 0.062 | 0.296 | 0.014 | ||||||||||||||||||||
| 1 | Abbate P E, Andrade F H, Culot J P, Bindraban P S.1997. Grain yield in wheat: Effects of radiation during spike growth period.Field Crops Res, 54: 245-257. |
| 2 | Abbate P E, Andrade F H, Lázaro L, Bariffi J H, Berardocco H G, Inza V H, Marturano F.1998. Grain yield increase in recent Argentine wheat cultivars.Crop Sci, 38: 1203-1209. |
| 3 | AfricaRice. 2008.. |
| 4 | Bray R H, Kurtz L T.1945. Determination of total, organic, and available forms of phosphorus in soils.Soil Sci, 59: 39-45. |
| 5 | Bremner J M.1996. Nitrogen-Total. In: Soil Science Society of America ed., Methods of Soil Analysis Part 3-Mineralogical Methods, SSSA Book Series 5. SSSA Inc. Wisconsin: 1085-1121. |
| 6 | Kadigi R M J, Kashaigili J J, Mdoe N S.2004. The economics of irrigated paddy in Usangu Basin in Tanzania: Water utilization, productivity, income and livelihood implications.Phys Chem Earth, 29: 1091-1100. |
| 7 | Kanyeka Z L, Msomba S W, Kihupi A N, Penza M S F.1995. Rice ecosystems in Tanzania: Characterization and classification. In: Rice and People in Tanzania. Tanzania, Moshi: Kilimanjaro Agricultural Training Centre. |
| 8 | Katsura K, Maeda S, Horie T, Shiraiwa T.2007. Analysis of yield attributes and crop physiological traits of Liangyoupeijiu, a hybrid rice recently bred in China.Field Crops Res, 103: 170-177. |
| 9 | Laza M R C, Peng S B, Akita S, Saka H.2003. Contribution of biomass portioning and translocation to grain yield under sub-optimum growing conditions in irrigated rice.Plant Prod Sci, 6: 28-35. |
| 10 | MAFC (Ministry of Agriculture Food Security and Cooperatives). 2009. National Rice Development Strategy. The United Republic of Tanzania Ministry of Agriculture Food Security and Cooperatives. |
| 11 | Matsushima S, Tanaka T, Hoshino T.1966. Analysis of yield-determining process and its application to yield-prediction and culture improvement of lowland rice: LXXV. Temperature effects on tillering in case of leaves and culm, culm-bases, and roots being independently treated.Jpn J Crop Sci, 37: 169-174. (in Japanese with English abstract) |
| 12 | Mdemu M V, Magayane M D, Lankford B, Hatibu N, Kadigi R M J.2004. Conjoining rainfall and irrigation seasonality to enhance productivity of water in rice irrigated farms in the Upper Ruaha River Basin, Tanzania.Phys Chem Earth, 29: 1119-1124. |
| 13 | Meertens H C C, Ndege L J, Lupeja P M.1999. The cultivation of rainfed, lowland rice in Sukumaland, Tanzania.Agric Ecosyst Environ, 76: 31-45. |
| 14 | Msomba S W, Kibanda J M, Penza H, Tusekelege H, Mkuya M, Kafiriti E, Mbapila J C, Kanyeka Z.2004. TXD306: A high-yielding and medium-maturing aromatic rice for the rainfed lowland and irrigated ecosystems in Tanzania.Int Rice Res Notes, 29: 30. |
| 15 | Mwakalila S.2005. Water resource use in the Great Ruaha Basin of Tanzania.Phys Chem Earth, 30: 903-912. |
| 16 | Osada A, Takahashi H, Dhammanuvong S, Sasiprapa V, Gunthararom S.1973. Seasonal changes in growth pattern of tropical rice: I. Environmental factors affecting plant height, tillering, weight and leaf area. Jpn J Crop Sci, 42: 343-350. (in Japanese with English abstract) |
| 17 | Owen P C.1969. The growth of four rice varieties as affected by temperature and photoperiod with uniform daily periods of daylight.Exp Agric, 5: 85-90. |
| 18 | Raes D, Kafiriti E M, Wellens J, Deckers J, Maertens A, Mugogo S, Dondeyne S, Descheemaeker K.2007. Can soil bunds increase the production of rain-fed lowland rice in south eastern Tanzania?Agric Water Manage, 89: 229-235. |
| 19 | Rowhani P, Lobell D B, Linderman M, Ramankutty N.2011. Climate variability and crop production in Tanzania.Agric Forest Meteorol, 151: 449-460. |
| 20 | Satake T, Lee S Y, Koike S.1988. Male sterility caused by cooling treatment at the young microspore stage in rice plants: XXVIII. Prevention of cool injury with the newly devised water management practices: Effects of the temperature and depth of water before the critical stage.Jpn J Crop Sci, 57: 234-241. (in Japanese with English abstract) |
| 21 | Satake T, Yoshida S.1978. High temperature-induced sterility in Indica rices at flowering.Jpn J Crop Sci, 47: 6-17. (in Japanese with English abstract) |
| 22 | Sato K.1974. Growth responses of rice plant to environmental conditions: III. The effects of photoperiod and temperature on the growth and chemical composition.Jpn J Crop Sci, 43: 402-409. (in Japanese with English abstract) |
| 23 | Sekiya N, Khatib K J, Makame S M, Tomitaka M, Oizumi N, Araki H.2013. Performance of a number of NERICA cultivars in Zanzibar, Tanzania: Yield, yield components and grain quality.Plant Prod Sci, 16: 141-153. |
| 24 | Shimono H, Okada M, Kanda E, Arakawa I.2007. Low temperature-induced sterility in rice: Evidence for the effects of temperature before panicle initiation.Field Crops Res, 101: 221-231. |
| 25 | Suarez D L.1996. Beryllium, magnesium, calcium, strontium, and barium. In: Soil Science Society of America ed., Methods of Soil Analysis Part 3-Mineralogical Methods, SSSA Book Series 5. SSSA Inc. Wisconsin: 575-601. |
| 26 | Suzuki M.1980. Studies on the growth characteristics of rice plants in warmer regions of Japan viewed from the aspect of dry matter production.Bull Kyusyu Nat Agric Exp Stn, 20: 429-494. (in Japanese with English abstract) |
| 27 | Takeda T, Oka M, Agata W.1983. Characteristics of dry matter and grain production of rice cultivars in the warmer part of Japan: I. Comparison of dry matter production between old and new types of rice cultivars.Jpn J Crop Sci, 52: 299-306. (in Japanese with English abstract) |
| 28 | Terao H, Otani Y, Shiraki M, Yamasaki M.1940. Physiological studies of the rice plant with special reference to the crop failure caused by the occurrence of unseasonable low temperature: II. Panicles affected by low temperature at different stages of their development.Jpn J Crop Sci, 12: 177-195. (in Japanese with English abstract) |
| 29 | Terao H, Otani Y, Doi Y, Izumi S.1941. Physiological studies of the rice plant with special reference to the crop failure caused by the occurrence of unseasonable low temperature: VIII. The effect of various low temperatures on the panicle differentiation, heading and ripening in the different stages after transplanting to heading.Jpn J Crop Sci, 13: 317-336. (in Japanese with English abstract) |
| 30 | Tokimasa F, Suedomi M.1971. Effect of the night-illumination by electric lamps on the growth and the yields of paddy rice.Jpn J Crop Sci, 40: 241-246. (in Japanese with English abstract) |
| 31 | USDA. 2013. Production, Supply and Distribution Online.. |
| 32 | Vergara B S, Chang T T.1985. The Flowering Response of the Rice Plant to Photoperiod: A Review of the Literature. 4th ed. Manila, the Philippines: International Rice Research Institute. |
| 33 | Weng J, Takeda T, Agata W, Hakoyama S.1982a. Studies on dry matter and grain production of rice plants: I. Influence of the reserved carbohydrate until heading stage and the assimilation products during the ripening period on grain production.Jpn J Crop Sci, 51: 500-509. (in Japanese with English abstract) |
| 34 | Weng J, Takeda T, Agata W, Hakoyama S.1982b. Studies on dry matter and grain production of rice plants: III. Analysis of dry matter productivity before heading stage.Jpn J Crop Sci, 51: 519-528. (in Japanese with English abstract) |
| 35 | Ying J P, Peng S B, He Q R, Yang H, Yang C D, Visperas R M, Cassman K G.1998. Comparison of high-yield rice in tropical and subtropical environments: I. Determinants of grain and dry matter yields. Field Crops Res, 57: 71-84. |
| 36 | Yoshida S.1981. Fundamentals of Rice Crop Science. Manila, the Philippines: International Rice Research Institute. |
| No related articles found! |
| 阅读次数 | ||||||
|
全文 |
|
|||||
|
摘要 |
|
|||||