Rice Science ›› 2018, Vol. 25 ›› Issue (5): 261-269.DOI: 10.1016/j.rsci.2018.08.002
收稿日期:2018-01-12
接受日期:2018-04-09
出版日期:2018-09-28
发布日期:2018-06-11
. [J]. Rice Science, 2018, 25(5): 261-269.
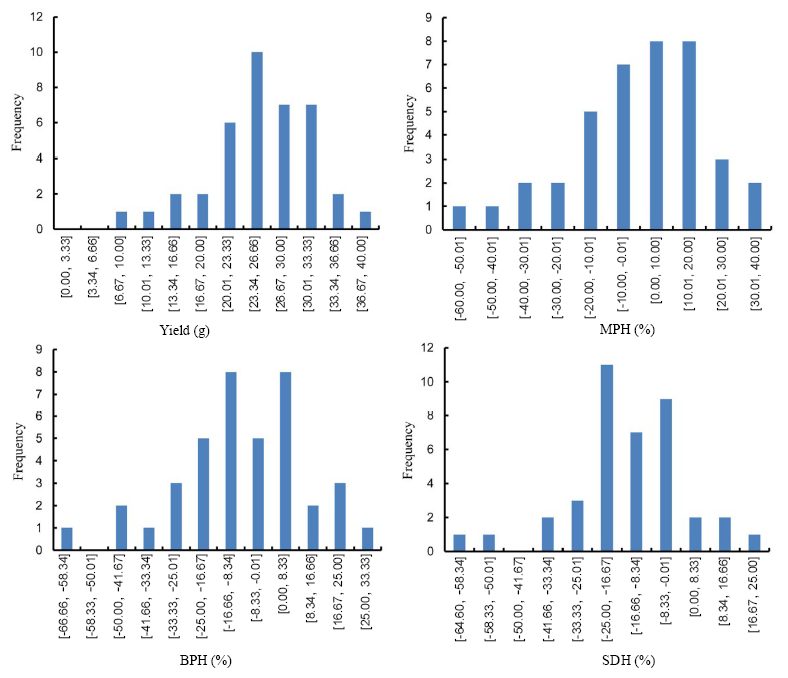
Fig. 1. Frequency distribution of yield and heterosis for 39 hybrids. A, Yield; B, Mid parent heterosis (MPH); C, Better parent heterosis (BPH); D, Standard heterosis over check (SDH).
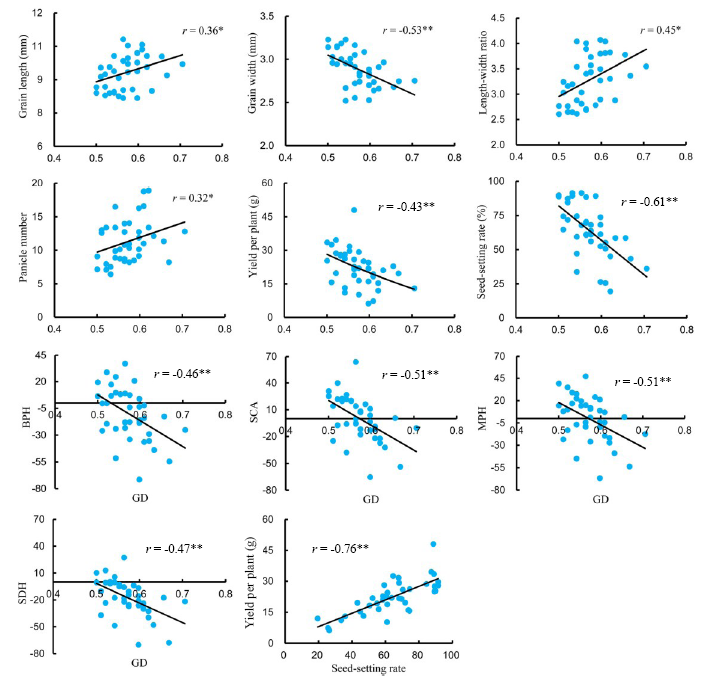
Fig. 2. Correlation between genetic distance (GD) and yield traits or heterosis. MPH, Mid parent heterosis; SCA, Specific combining ability; BPH, Better parent heterosis; SDH, Standard heterosis over check.
| Accession | Pedigree | Group | Yield per plant (g) | GCA (g) |
|---|---|---|---|---|
| IR79532-21-2-2-1 | IR79532-21-2-2-1 | G2 | 31.07 a | -20.60 |
| Shuhui 527 | 1318 / 88-R3360 | G4 | 30.81 ab | 5.33 |
| IR68058-64-1-2 | IR68058-64-1-2 | G2 | 30.01 abc | -21.63 |
| Minghui 70 | IR54 / Minghui 63 | G3 | 29.14 abc | 4.29 |
| Minhui 3139 | Minghui 70 / Yanhui 559 | G5 | 29.08 abc | 20.32 |
| IR71701-28-1-4 | IR71701-28-1-4 | G2 | 28.73 abc | -47.06 |
| Minghui 86 | P18 / Minghui 75 | G4 | 28.01 abc | 16.42 |
| Fuhui 7018 | (Minghui 86 / Tainong 67 // Duoxi 1 /// Chuan R) / (Yunyin / Minghui 86) | G5 | 27.23 abc | 19.26 |
| Minghui 63 | IR30 / Gui 630 | G4 | 25.59 abc | -8.42 |
| Gui 99 | Longye 5-3 / IR661 / IR2061 | G7 | 25.54 abc | 19.39 |
| CNR2 | Luhui 6 / Zhonghui 9560 | G5 | 25.24 abc | -5.38 |
| II-32B | Zhenshan 97 / IR665 | G1 | 24.81 abc | 10.86 |
| Shuhui 881 | R6323 / japonica | G4 | 23.21 bc | 5.19 |
| R453 | 93-11 / B5-10 | G6 | 22.92 c | 12.88 |
| Tianfeng B | Mi 31 // Bo B / Zhe 9248 | G1 | 22.71 c | -4.41 |
| Taifeng B | Bo B / G9248 | G1 | 22.51 c | -6.45 |
| Mean | 26.66 | |||
| R | 27.43 a | |||
| B | 23.64 b | |||
| CK | Yiyou 673 | 31.02 |
Table 1 Pedigree, group, yield, and general combining ability (GCA) for yield trait of 16 parental lines.
| Accession | Pedigree | Group | Yield per plant (g) | GCA (g) |
|---|---|---|---|---|
| IR79532-21-2-2-1 | IR79532-21-2-2-1 | G2 | 31.07 a | -20.60 |
| Shuhui 527 | 1318 / 88-R3360 | G4 | 30.81 ab | 5.33 |
| IR68058-64-1-2 | IR68058-64-1-2 | G2 | 30.01 abc | -21.63 |
| Minghui 70 | IR54 / Minghui 63 | G3 | 29.14 abc | 4.29 |
| Minhui 3139 | Minghui 70 / Yanhui 559 | G5 | 29.08 abc | 20.32 |
| IR71701-28-1-4 | IR71701-28-1-4 | G2 | 28.73 abc | -47.06 |
| Minghui 86 | P18 / Minghui 75 | G4 | 28.01 abc | 16.42 |
| Fuhui 7018 | (Minghui 86 / Tainong 67 // Duoxi 1 /// Chuan R) / (Yunyin / Minghui 86) | G5 | 27.23 abc | 19.26 |
| Minghui 63 | IR30 / Gui 630 | G4 | 25.59 abc | -8.42 |
| Gui 99 | Longye 5-3 / IR661 / IR2061 | G7 | 25.54 abc | 19.39 |
| CNR2 | Luhui 6 / Zhonghui 9560 | G5 | 25.24 abc | -5.38 |
| II-32B | Zhenshan 97 / IR665 | G1 | 24.81 abc | 10.86 |
| Shuhui 881 | R6323 / japonica | G4 | 23.21 bc | 5.19 |
| R453 | 93-11 / B5-10 | G6 | 22.92 c | 12.88 |
| Tianfeng B | Mi 31 // Bo B / Zhe 9248 | G1 | 22.71 c | -4.41 |
| Taifeng B | Bo B / G9248 | G1 | 22.51 c | -6.45 |
| Mean | 26.66 | |||
| R | 27.43 a | |||
| B | 23.64 b | |||
| CK | Yiyou 673 | 31.02 |
| Group | II-32B | Taifeng B | Tianfeng B | G1 |
|---|---|---|---|---|
| G2 | 0.5910 | 0.5909 | 0.6498 | 0.6106 |
| G3 | 0.5005 | 0.5643 | 0.5213 | 0.5287 |
| G4 | 0.5510 | 0.5896 | 0.5785 | 0.5730 |
| G5 | 0.5427 | 0.6173 | 0.5398 | 0.5666 |
| G6 | 0.5005 | 0.5754 | 0.5319 | 0.5359 |
| G7 | 0.5534 | 0.5978 | 0.5426 | 0.5646 |
| Mean | 0.5398 | 0.5892 | 0.5607 | 0.5632 |
Table 2 Genetic distances between maintainer and restorer lines.
| Group | II-32B | Taifeng B | Tianfeng B | G1 |
|---|---|---|---|---|
| G2 | 0.5910 | 0.5909 | 0.6498 | 0.6106 |
| G3 | 0.5005 | 0.5643 | 0.5213 | 0.5287 |
| G4 | 0.5510 | 0.5896 | 0.5785 | 0.5730 |
| G5 | 0.5427 | 0.6173 | 0.5398 | 0.5666 |
| G6 | 0.5005 | 0.5754 | 0.5319 | 0.5359 |
| G7 | 0.5534 | 0.5978 | 0.5426 | 0.5646 |
| Mean | 0.5398 | 0.5892 | 0.5607 | 0.5632 |
| Source | Parental yield | Hybrid | |||||||||||||
|---|---|---|---|---|---|---|---|---|---|---|---|---|---|---|---|
| df | MS | F | df | Yield | MPH | BPH | SDH | ||||||||
| MS | F | MS | F | MS | F | MS | F | ||||||||
| Genotype | 15 | 53.175 | 4.351*** | 38 | 235.369 | 14.012*** | 3 905.300 | 8.600*** | 3 301.240 | 8.686*** | 2 445.018 | 13.672*** | |||
| Environment | 1 | 459.437 | 6.366 | 1 | 2 348.255 | 18.717* | 24 225.640 | 25.257* | 9 376.344 | 6.193 | 48 758.570 | 36.745* | |||
| Replication | 2 | 41.293 | 0.658 | 2 | 22.754 | 0.185 | 348.081 | 0.333 | 2 261.802 | 1.411 | 256.743 | 0.197 | |||
| GEI | 15 | 55.606 | 2.567* | 38 | 148.397 | 7.725*** | 1 983.740 | 5.389*** | 1 511.473 | 5.199*** | 1 538.787 | 7.544*** | |||
| Error | 30 | 21.665 | 76 | 19.210 | 368.138 | 290.714 | 203.967 | ||||||||
| Total | 95 | 233 | |||||||||||||
Table 3 Analysis of variance for parent and hybrid yields, hybrid yield standard heterosis over check (SDH), mid parent heterosis (MPH) and better parent heterosis (BPH).
| Source | Parental yield | Hybrid | |||||||||||||
|---|---|---|---|---|---|---|---|---|---|---|---|---|---|---|---|
| df | MS | F | df | Yield | MPH | BPH | SDH | ||||||||
| MS | F | MS | F | MS | F | MS | F | ||||||||
| Genotype | 15 | 53.175 | 4.351*** | 38 | 235.369 | 14.012*** | 3 905.300 | 8.600*** | 3 301.240 | 8.686*** | 2 445.018 | 13.672*** | |||
| Environment | 1 | 459.437 | 6.366 | 1 | 2 348.255 | 18.717* | 24 225.640 | 25.257* | 9 376.344 | 6.193 | 48 758.570 | 36.745* | |||
| Replication | 2 | 41.293 | 0.658 | 2 | 22.754 | 0.185 | 348.081 | 0.333 | 2 261.802 | 1.411 | 256.743 | 0.197 | |||
| GEI | 15 | 55.606 | 2.567* | 38 | 148.397 | 7.725*** | 1 983.740 | 5.389*** | 1 511.473 | 5.199*** | 1 538.787 | 7.544*** | |||
| Error | 30 | 21.665 | 76 | 19.210 | 368.138 | 290.714 | 203.967 | ||||||||
| Total | 95 | 233 | |||||||||||||
| Hybrid group | Genetic distance | Hybrid yield (g) | MPH (%) | BPH (%) | SDH (%) | SCA (%) |
|---|---|---|---|---|---|---|
| II-32A × G5 | 0.5427 | 35.14 a | 34.77 | 25.21 | 13.29 | 41.83 |
| II-32A × G6 | 0.5005 | 33.69 a | 39.07 | 19.30 | 10.29 | 30.88 |
| Tianfeng A × G7 | 0.5426 | 32.36 ab | 27.44 | 24.46 | 5.62 | 26.72 |
| II-32A × G3 | 0.5005 | 30.91 abc | 14.47 | 6.37 | -0.52 | 25.29 |
| Tianfeng A × G6 | 0.5319 | 30.24 abc | 29.06 | 17.32 | -1.80 | 19.55 |
| II-32A × G7 | 0.5534 | 30.06 abc | 19.50 | 8.25 | -2.78 | 20.38 |
| II-32A × G4 | 0.5510 | 30.01 abc | 16.37 | 8.99 | -2.48 | 18.65 |
| Taifeng A × G7 | 0.5978 | 28.55 abc | 21.18 | 3.92 | -6.61 | 11.08 |
| Tianfeng A × G4 | 0.5785 | 24.99 bcd | -2.65 | -7.99 | -19.17 | 0.09 |
| Taifeng A × G5 | 0.6173 | 24.66 bcd | 2.06 | -11.63 | -19.71 | -2.87 |
| Taifeng A × G4 | 0.5896 | 24.25 bcd | 1.04 | -10.96 | -20.85 | -4.84 |
| Taifeng A × G3 | 0.5643 | 23.99 bcd | -4.52 | -17.82 | -22.05 | -4.99 |
| Tianfeng A × G5 | 0.5398 | 23.88 bcd | -8.47 | -14.22 | -22.72 | -4.77 |
| Tianfeng A × G3 | 0.5213 | 23.56 bcd | -13.18 | -19.43 | -23.21 | -7.44 |
| Taifeng A × G6 | 0.5754 | 22.79 bcd | 1.01 | -17.76 | -25.30 | -11.78 |
| Taifeng A × G2 | 0.5909 | 22.13 cd | -16.07 | -32.06 | -26.58 | -16.73 |
| Tianfeng A × G2 | 0.6498 | 18.69 de | -32.39 | -37.89 | -38.85 | -27.39 |
| II-32A × G2 | 0.5910 | 13.68 e | -50.21 | -55.66 | -55.64 | -45.16 |
| Summarized by restorer | ||||||
| G1 × G7 | 0.5426 | 30.32 a | 22.71 | 12.21 | -1.26 | 19.39 |
| G1 × G6 | 0.5319 | 28.91 a | 23.05 | 6.29 | -5.60 | 12.88 |
| G1 × G5 | 0.5398 | 27.89 a | 9.45 | -0.21 | -9.71 | 11.40 |
| G1 × G4 | 0.5785 | 26.42 a | 4.92 | -3.32 | -14.17 | 4.63 |
| G1 × G3 | 0.5213 | 26.15 a | -1.08 | -10.29 | -15.26 | 4.29 |
| G1 × G2 | 0.6106 | 18.17 b | -32.89 | -41.87 | -40.36 | -29.76 |
| Summarized by maintainer | ||||||
| II-32A × R | 27.78 a | 7.09 | -1.65 | -10.00 | 10.86 | |
| Tianfeng A × R | 24.14 a | -6.91 | -12.76 | -21.60 | -4.41 | |
| Taifeng A × R | 24.05 a | -1.55 | -15.89 | -21.25 | -6.45 | |
| Summarized by environment | ||||||
| 2015 Fujian | 28.50 a | 9.07 | -4.76 | -3.17 | ||
| 2016 Hainan | 22.16 b | -9.98 | -15.45 | -32.06 | ||
Table 4 Genetic distances, hybrid yield performance, and yield heterosis among groups.
| Hybrid group | Genetic distance | Hybrid yield (g) | MPH (%) | BPH (%) | SDH (%) | SCA (%) |
|---|---|---|---|---|---|---|
| II-32A × G5 | 0.5427 | 35.14 a | 34.77 | 25.21 | 13.29 | 41.83 |
| II-32A × G6 | 0.5005 | 33.69 a | 39.07 | 19.30 | 10.29 | 30.88 |
| Tianfeng A × G7 | 0.5426 | 32.36 ab | 27.44 | 24.46 | 5.62 | 26.72 |
| II-32A × G3 | 0.5005 | 30.91 abc | 14.47 | 6.37 | -0.52 | 25.29 |
| Tianfeng A × G6 | 0.5319 | 30.24 abc | 29.06 | 17.32 | -1.80 | 19.55 |
| II-32A × G7 | 0.5534 | 30.06 abc | 19.50 | 8.25 | -2.78 | 20.38 |
| II-32A × G4 | 0.5510 | 30.01 abc | 16.37 | 8.99 | -2.48 | 18.65 |
| Taifeng A × G7 | 0.5978 | 28.55 abc | 21.18 | 3.92 | -6.61 | 11.08 |
| Tianfeng A × G4 | 0.5785 | 24.99 bcd | -2.65 | -7.99 | -19.17 | 0.09 |
| Taifeng A × G5 | 0.6173 | 24.66 bcd | 2.06 | -11.63 | -19.71 | -2.87 |
| Taifeng A × G4 | 0.5896 | 24.25 bcd | 1.04 | -10.96 | -20.85 | -4.84 |
| Taifeng A × G3 | 0.5643 | 23.99 bcd | -4.52 | -17.82 | -22.05 | -4.99 |
| Tianfeng A × G5 | 0.5398 | 23.88 bcd | -8.47 | -14.22 | -22.72 | -4.77 |
| Tianfeng A × G3 | 0.5213 | 23.56 bcd | -13.18 | -19.43 | -23.21 | -7.44 |
| Taifeng A × G6 | 0.5754 | 22.79 bcd | 1.01 | -17.76 | -25.30 | -11.78 |
| Taifeng A × G2 | 0.5909 | 22.13 cd | -16.07 | -32.06 | -26.58 | -16.73 |
| Tianfeng A × G2 | 0.6498 | 18.69 de | -32.39 | -37.89 | -38.85 | -27.39 |
| II-32A × G2 | 0.5910 | 13.68 e | -50.21 | -55.66 | -55.64 | -45.16 |
| Summarized by restorer | ||||||
| G1 × G7 | 0.5426 | 30.32 a | 22.71 | 12.21 | -1.26 | 19.39 |
| G1 × G6 | 0.5319 | 28.91 a | 23.05 | 6.29 | -5.60 | 12.88 |
| G1 × G5 | 0.5398 | 27.89 a | 9.45 | -0.21 | -9.71 | 11.40 |
| G1 × G4 | 0.5785 | 26.42 a | 4.92 | -3.32 | -14.17 | 4.63 |
| G1 × G3 | 0.5213 | 26.15 a | -1.08 | -10.29 | -15.26 | 4.29 |
| G1 × G2 | 0.6106 | 18.17 b | -32.89 | -41.87 | -40.36 | -29.76 |
| Summarized by maintainer | ||||||
| II-32A × R | 27.78 a | 7.09 | -1.65 | -10.00 | 10.86 | |
| Tianfeng A × R | 24.14 a | -6.91 | -12.76 | -21.60 | -4.41 | |
| Taifeng A × R | 24.05 a | -1.55 | -15.89 | -21.25 | -6.45 | |
| Summarized by environment | ||||||
| 2015 Fujian | 28.50 a | 9.07 | -4.76 | -3.17 | ||
| 2016 Hainan | 22.16 b | -9.98 | -15.45 | -32.06 | ||
| 1 | Fischer S, Maurer H P, Würschum T, Möhring J, Piepho H P, Schön C C, Thiemt E M, Dhillo B S, Weissmann E A, Melchinger A E, Reif J C.2010. Development of heterotic groups in triticale.Crop Sci, 50(2): 584-590. |
| 2 | Gai J Y, Dai J R, Li J S, Sun Q X.2016. Utilization of Heterosis in Crops. Beijing, China: High Education Press. (in Chinese) |
| 3 | Lee M, Godshalk E B, Lamkey K R, Woodman W W.1989. Association of restriction fragment length polymorphisms among maize inbreds with agronomic performance of their crosses.Crop Sci, 29(4): 1067-1071. |
| 4 | Liu K J, Muse S V.2005. PowerMarker: An integrated analysis environment for genetic marker analysis.Bioinformatics, 21: 2128-2129. |
| 5 | Lu Z M, Xu B Q.2010. On significance of heterotic group theory in hybrid rice breeding.Rice Sci, 17(2): 94-98. |
| 6 | Luo X J, He H H, Peng X S, Yu Q Y, Sun J L, Zhang H L, Li Z C.2006. Analysis on correlation between genetic distance of rice parents and heterosis with SSR molecular marker.J Plant Genet Resour: 209-214. (in Chinese with English abstract) |
| 7 | Melchinger A E, Gumber R K.1998. Overview of heterosis and heterotic groups in agronomic crops. In: Concepts and Breeding of Heterosis in Crop Plants. USA: Crop Spciety of America: 29-44. |
| 8 | Menz M A, Klein R R, Unruh N C, Rooney W L, Klein P E, Mullet J E.2004. Genetic diversity of public inbreds of sorghum determined by mapped AFLP and SSR markers.Crop Sci, 44: 1236-1244. |
| 9 | R Development Core Team. 2011. R: A language and environment for statistical computing. Vienna, Austria (). |
| 10 | Reif J C, Melchinger A E, Xia X C, Warburton M L, Hoisington D A, Vasal S K, Beck D, Bohn M, Frisch M.2003. Use of SSRs for establishing heterotic groups in subtropical maize.Theor Appl Genet, 107(5): 947-957. |
| 11 | Singh V K, Upadhyay P, Sinha P, Mall A K, Ellur R K, Singh A, Jaiswal S K, Biradar S, Ramakrishna S, Sundaram R M, Ahmed I, Viraktamath B C, Kole C, Singh S.2011. Prediction of hybrid performance based on the genetic distance of parental lines in two-line rice (Oryza sativa L.) hybrids.J Crop Sci Biotechnol, 14: 1. |
| 12 | Smith J S C, Chin E C L, Shu H, Smith O S, Wall S J, Senior M L, Mitchell S E, Kresovich S, Ziegle J.1997. An evaluation of the utility of SSR loci as molecular markers in maize (Zea mays L.): Comparisons with data from RFLPS and pedigree.Theor Appl Genet, 95: 163-173. |
| 13 | Sun C Q, Jiang T B, Chen L, Wu C M, Li Z C, Wang X K.2000. Studies on the relationship between heterosis and genetic differentiation in hybrid rice (Oryza sativa L.).Acta Agron Sin, 26(6): 641-649. (in Chinese with English abstract) |
| 14 | Tamura K, Dudley J, Nei M, Kumar S.2007. MEGA4: Molecular evolutionary genetics analysis (MEGA) software version 4.0.Mol Biol Evol, 24(8): 1596-1599. |
| 15 | Wang S J, Lu Z M.2006. Evolvement and analysis of genetic diversity in indica hybrid rice(Oryza sativa L.) in China. Jiangsu J Agric Sci, 22: 192-198. (in Chinese with English abstract) |
| 16 | Wang S J, Lu Z M, Wan J M.2006a. Genetic diversity of parental lines in indica hybrid rice based on phenotypic characters and SSR cluster analysis.Chin J Rice Sci, 20: 475-480. (in Chinese with English abstract) |
| 17 | Wang S J, Wan J M, Lu Z M.2006b. Parental cluster analysis in indica hybrid rice(Oryza sativa L.) by SSR analysis.Acta Agron Sin, 32: 1437-1443. (in Chinese with English abstract) |
| 18 | Wang S J, Lu Z M.2007. Study on heterosis groups of key parental lines in indica hybrid rice(Oryza sativa L.) in China.Nanjing Agric Univ, 30: 14-18. (in Chinese with English abstract) |
| 19 | Wang K, Qiu F L, Larazo W, Paz M A, Xie F M.2015. Heterotic groups of tropical indica rice germplasm.Theor Appl Genet, 128(3): 421-430. |
| 20 | Wang Y H, Zheng Y M, Cai Q H, Liao C J, Mao X H, Xie H G, Zhu Y S, Lian L, Luo X, Xie H A, Zhang J F.2016. Population structure and association analysis of yield and grain quality traits in hybrid rice primal parental lines.Euphytica, 212: 261-273. |
| 21 | Xie F M, Guo L B, Ren G J, Hu P S, Wang F, Xu J L, Li X, Qiu F L, Paz M A.2012. Genetic diversity and structure of indica rice varieties from two heterotic pools of southern China and IRRI.Plant Genet Resour, 10: 186-193. |
| 22 | Xie F M, He Z Z, Esguerra M Q, Qiu F L, Ramanathan V.2014. Determination of heterotic groups for tropical indica hybrid rice germplasm.Theor Appl Genet, 127(2): 407-417. |
| 23 | Xu W J, Virmani S S, Hernandez J E, Sebastian L S, Redoña E D, Li Z K.2002. Genetic diversity in the parental lines and heterosis of the tropical rice hybrids.Euphytica, 127(1): 139-148. |
| 24 | Yu Y H, Liu Y, Li Z Y, Chen G H, Xu Z J, Tang L, Mao T, Xu H.2016. Relationship between indica-japonica index of parents and heterosis of hybrid and its genetic basis in japonica two line hybrid rice.Acta Agron Sin, 42: 648-657. (in Chinese with English abstract) |
| 25 | Zha R M, Ling Y H, Yang Z L, Zhao F M, Zhong B Q, Xie R, Sang X C, He G H.2008. Prediction of hybrid grain yield performances in indica rice(Oryza sativa L.) with effect- increasing loci.Mol Breeding, 22(3): 467-476. (in Chinese with English abstract) |
| 26 | Zeng M Q, Ji H L, Li J Y, Sansen J.2007. Formation and development on the conception of heterotic group and their heterotic pattern in maize ( Zea may L.).Acta Agric Boreali-Sin, 22: 30-37. (in Chinese with English abstract) |
| 27 | Zhao M F, Li X H, Yang J B, Xu C G, Hu R Y, Liu D J, Zhang Q.1999. Relationship between molecular marker heterozygosity and hybrid performance in intro- and inter-subspecific crosses of rice.Plant Breeding, 118: 139-144. |
| 28 | Zhao Q Y, Zhu Z, Zhang Y D, Zhao L, Chen T, Zhang Q F, Wang C L.2009. Analysis on correlation between heterosis and genetic distance based on simple sequence repeat markers in japonica rice.Chin J Rice Sci, 23: 141-147. (in Chinese with English abstract) |
| 29 | Zhu Z F, Sun C Q, Jiang T B, Fu Q, Wang X K.2001. The comparison of genetic divergences and its relationships to heterosis revealed by SSR and RFLP markers in rice (Oryza sativa L.).Acta Genet Sin, 28(8): 738-745. (in Chinese with English abstract) |
| No related articles found! |
| 阅读次数 | ||||||
|
全文 |
|
|||||
|
摘要 |
|
|||||