Rice Science ›› 2021, Vol. 28 ›› Issue (4): 402-408.DOI: 10.1016/j.rsci.2021.05.010
收稿日期:2020-05-01
接受日期:2020-06-23
出版日期:2021-07-28
发布日期:2021-07-28
. [J]. Rice Science, 2021, 28(4): 402-408.

Fig. 1. Boxplot comparison of total arsenic (As, A) and inorganic arsenic (iAs, B) contents in PR (polished rice grains), UR (unpolished rice grains), PPR (parboiled polished rice grains) and PUR (parboiled unpolished rice grains).
| Rice type | Number | Total As (μg/kg) | Inorganic As (μg/kg) | |||||||
|---|---|---|---|---|---|---|---|---|---|---|
| Mean | SD | Min | Max | Mean | SD | Min | Max | |||
| PR | 53 | 108 | 33 | 55 | 219 | 70 | 19 | 40 | 117 | |
| UR | 53 | 159 | 46 | 83 | 328 | 113 | 30 | 60 | 191 | |
| PPR | 53 | 145 | 42 | 85 | 296 | 108 | 29 | 60 | 214 | |
| PUR | 53 | 145 | 44 | 78 | 286 | 110 | 27 | 61 | 184 | |
Table S1. Contents of total arsenic (As) and inorganic As in rice grains by different treatments.
| Rice type | Number | Total As (μg/kg) | Inorganic As (μg/kg) | |||||||
|---|---|---|---|---|---|---|---|---|---|---|
| Mean | SD | Min | Max | Mean | SD | Min | Max | |||
| PR | 53 | 108 | 33 | 55 | 219 | 70 | 19 | 40 | 117 | |
| UR | 53 | 159 | 46 | 83 | 328 | 113 | 30 | 60 | 191 | |
| PPR | 53 | 145 | 42 | 85 | 296 | 108 | 29 | 60 | 214 | |
| PUR | 53 | 145 | 44 | 78 | 286 | 110 | 27 | 61 | 184 | |
| ice type | Number (n) | As3+ | DMA5+ | MMA5+ | As5+ | |||||||||||||||
|---|---|---|---|---|---|---|---|---|---|---|---|---|---|---|---|---|---|---|---|---|
| Mean | SD | Min | Max | Mean | SD | Min | Max | Mean | SD | Min | Max | Mean | SD | Min | Max | |||||
| PR | 53 | 69 | 18 | 40 | 116 | 29 | 16 | 8 | 90 | < 3 | < 3 | 4 | < 3 | < 3 | 7 | |||||
| UR | 53 | 104 | 26 | 55 | 165 | 31 | 16 | 8 | 90 | < 3 | < 3 | 8 | 10 | 5 | < 3 | 26 | ||||
| PPR | 53 | 95 | 25 | 54 | 180 | 28 | 15 | 11 | 91 | < 3 | < 3 | 5 | 14 | 6 | < 3 | 34 | ||||
| PUR | 53 | 90 | 21 | 61 | 145 | 28 | 14 | 12 | 74 | < 3 | < 3 | 6 | 20 | 7 | < 3 | 46 | ||||
Table 1 Contents of arsenic (As) species in rice grains with mean, standard deviation (SD), minimum (Min) and maximum (Max) divided by different treatments. μg/kg
| ice type | Number (n) | As3+ | DMA5+ | MMA5+ | As5+ | |||||||||||||||
|---|---|---|---|---|---|---|---|---|---|---|---|---|---|---|---|---|---|---|---|---|
| Mean | SD | Min | Max | Mean | SD | Min | Max | Mean | SD | Min | Max | Mean | SD | Min | Max | |||||
| PR | 53 | 69 | 18 | 40 | 116 | 29 | 16 | 8 | 90 | < 3 | < 3 | 4 | < 3 | < 3 | 7 | |||||
| UR | 53 | 104 | 26 | 55 | 165 | 31 | 16 | 8 | 90 | < 3 | < 3 | 8 | 10 | 5 | < 3 | 26 | ||||
| PPR | 53 | 95 | 25 | 54 | 180 | 28 | 15 | 11 | 91 | < 3 | < 3 | 5 | 14 | 6 | < 3 | 34 | ||||
| PUR | 53 | 90 | 21 | 61 | 145 | 28 | 14 | 12 | 74 | < 3 | < 3 | 6 | 20 | 7 | < 3 | 46 | ||||
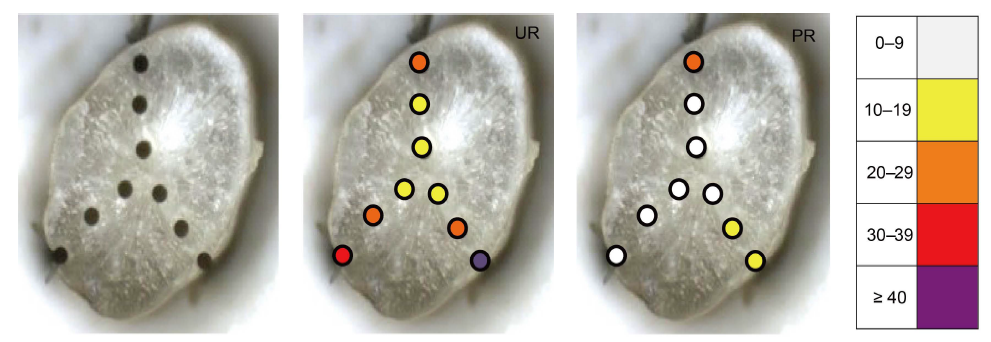
Fig. 2. Sections of unpolished (UR) and polished (PR) rice grains achieved for LA-ICP-MS (Laser ablation-inductively coupled plasma-mass spectrometry). Different colours represents the counts per second (CPS) divided into classes of 75As/13C intensity ratio (×10-4).
| Parameter | Rice bran (μg/kg) | Parboiled rice bran (μg/kg) | P-value |
|---|---|---|---|
| Total As | 646 ± 198 | 214 ± 78 | < 0.001 |
| Inorganic As (iAs) | 503 ± 155 | 155 ± 58 | < 0.001 |
| Percentage of iAs (%) | 78 ± 4 | 72 ± 5 | < 0.001 |
| As3+ | 413 ± 113 | 70 ± 32 | < 0.001 |
| As5+ | 91 ± 44 | 85 ± 37 | 0.4064 |
| Organic As | 57 ± 22 | 28 ± 15 | < 0.001 |
| DMA5+ | 42 ± 18 | 24 ± 14 | < 0.001 |
| MMA5+ | 16 ± 5 | 4 ± 2 | < 0.001 |
Table 2 Content of arsenic (As) species in untreated rice bran and parboiled rice bran.
| Parameter | Rice bran (μg/kg) | Parboiled rice bran (μg/kg) | P-value |
|---|---|---|---|
| Total As | 646 ± 198 | 214 ± 78 | < 0.001 |
| Inorganic As (iAs) | 503 ± 155 | 155 ± 58 | < 0.001 |
| Percentage of iAs (%) | 78 ± 4 | 72 ± 5 | < 0.001 |
| As3+ | 413 ± 113 | 70 ± 32 | < 0.001 |
| As5+ | 91 ± 44 | 85 ± 37 | 0.4064 |
| Organic As | 57 ± 22 | 28 ± 15 | < 0.001 |
| DMA5+ | 42 ± 18 | 24 ± 14 | < 0.001 |
| MMA5+ | 16 ± 5 | 4 ± 2 | < 0.001 |
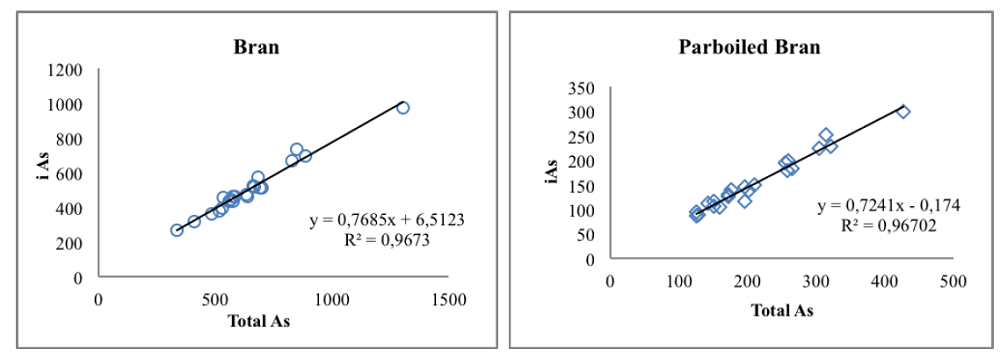
Fig. S1. Correlation between total As and inorganic arsenic (iAs) concentrations in bran and parboiled bran (n = 22).
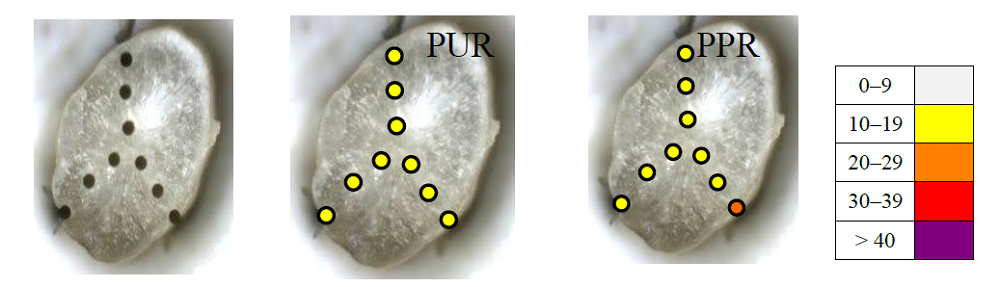
Fig. S2. Rice sections of parboiled unpolished (PUR) and parboiled polished (PPR) rice achieved by laser ablation-inductively coupled plasma-mass spectrometry.Different colours represents the counts per second (CPS) divided into classes of 75As/13C intensity ratio (×10-4).

Fig. 3. Comparison of distribution of arsenic (As) species between different rice processes divided by two rice categories, Long A and Long B.Long A and Long B are established by the Regulation (EU) No 1308/2013. PR, Polished rice grains; PPR, Parboiled polished rice grains; UR, Unpolished rice grains; PUR, Parboiled unpolished rice grains. Means followed by the same lowercase letter were not significantly different at P < 0.05 according to the Tukey’s test.
| Regulation (EU) No. 1308/2013 | Rice type | Number | Total As (μg/kg) | Inorganic As (μg/kg) | |
|---|---|---|---|---|---|
| Long A | PR | 32 | 115 ± 36 cd | 73 ± 21 a | |
| PPR | 32 | 154 ± 44 ab | 113 ± 33 b | ||
| UR | 32 | 170 ± 52 a | 120 ± 33 b | ||
| PUR | 32 | 154 ± 47 ab | 114 ± 30 b | ||
| Long B | PR | 21 | 98 ± 24 d | 67 ± 14 a | |
| PPR | 21 | 131 ± 34 ac | 101 ± 21 b | ||
| UR | 21 | 142 ± 30 ab | 103 ± 22 b | ||
| PUR | 21 | 131 ± 34 bc | 103 ± 21 b |
Table S2. Total and inorganic arsenic (As) distribution in rice grains divided by European classification and treatments.
| Regulation (EU) No. 1308/2013 | Rice type | Number | Total As (μg/kg) | Inorganic As (μg/kg) | |
|---|---|---|---|---|---|
| Long A | PR | 32 | 115 ± 36 cd | 73 ± 21 a | |
| PPR | 32 | 154 ± 44 ab | 113 ± 33 b | ||
| UR | 32 | 170 ± 52 a | 120 ± 33 b | ||
| PUR | 32 | 154 ± 47 ab | 114 ± 30 b | ||
| Long B | PR | 21 | 98 ± 24 d | 67 ± 14 a | |
| PPR | 21 | 131 ± 34 ac | 101 ± 21 b | ||
| UR | 21 | 142 ± 30 ab | 103 ± 22 b | ||
| PUR | 21 | 131 ± 34 bc | 103 ± 21 b |
| Parameter | Operating condition | |
|---|---|---|
| HPLC parameter | ||
| Anion exchange column: | Hamilton, PRP-X100, 250 mm × 4.6 mm, 5 μm particle size | |
| Mobile phase | 1)13.2 mmol/L NH4H2PO4 at pH 6 | |
| Injection volume | 30 μL | |
| Flow rate | 1 mL/min | |
| Column temperature | Room temperature | |
| Acquisition Time | 13 min | |
| ICP-MS parameter | ||
| RF power | 1550 W | |
| RF Matching | 1.70 V | |
| Plasma gas Carrier gas | Ar 15 L/min Ar 1.10 L/min | |
| Dilution mode | ON | |
| Dilution gas | Ar 0.1 L/min | |
| Sampling depth | 8 mm | |
| S/C temperature | - 1 ºC | |
| Isotope monitored | 35Cl, 72Ge, 75As | |
| Integration time/Mass | 0.6 s | |
Table S3. Instrumental operating condition for high performance liquid chromatography-inductively coupled plasma-mass spectrometry (HPLC-ICP-MS) system.
| Parameter | Operating condition | |
|---|---|---|
| HPLC parameter | ||
| Anion exchange column: | Hamilton, PRP-X100, 250 mm × 4.6 mm, 5 μm particle size | |
| Mobile phase | 1)13.2 mmol/L NH4H2PO4 at pH 6 | |
| Injection volume | 30 μL | |
| Flow rate | 1 mL/min | |
| Column temperature | Room temperature | |
| Acquisition Time | 13 min | |
| ICP-MS parameter | ||
| RF power | 1550 W | |
| RF Matching | 1.70 V | |
| Plasma gas Carrier gas | Ar 15 L/min Ar 1.10 L/min | |
| Dilution mode | ON | |
| Dilution gas | Ar 0.1 L/min | |
| Sampling depth | 8 mm | |
| S/C temperature | - 1 ºC | |
| Isotope monitored | 35Cl, 72Ge, 75As | |
| Integration time/Mass | 0.6 s | |
| Parameter | Condition |
|---|---|
| LA parameter | |
| Laser warm-up time (s) | 40 |
| Laser output (%) | 60 |
| Repetition rate (Hz) | 10 |
| Spot size (μm) | 100 |
| Energy delivered (%) | 100 |
| Fluence (J/cm2) | 7.2 |
| ICP-MS parameter | |
| RF power (kW) | 1.45 |
| Lens voltage (V) | 5.5 |
| Plasma gas (Ar L/min) | 15 |
| Carrier gas (Ar L/min) | 0.5 |
| Auxiliary gas (Ar L/min) | 1.2 |
| Dwell time (ms) | 100 |
| Isotopes monitored (m/z) | 75As, 13C |
Table S4. Operational parameters for inductively coupled plasma-mass (ICP-MS) and laser ablation (LA)-ICP-MS determinations.
| Parameter | Condition |
|---|---|
| LA parameter | |
| Laser warm-up time (s) | 40 |
| Laser output (%) | 60 |
| Repetition rate (Hz) | 10 |
| Spot size (μm) | 100 |
| Energy delivered (%) | 100 |
| Fluence (J/cm2) | 7.2 |
| ICP-MS parameter | |
| RF power (kW) | 1.45 |
| Lens voltage (V) | 5.5 |
| Plasma gas (Ar L/min) | 15 |
| Carrier gas (Ar L/min) | 0.5 |
| Auxiliary gas (Ar L/min) | 1.2 |
| Dwell time (ms) | 100 |
| Isotopes monitored (m/z) | 75As, 13C |
| [1] | Araullo E V, de Padua D B, Graham M. 1976. Rice: Postharvest Technology. Ottawa, Canda: International Development Research Centre. |
| [2] | Babu P D, Subhasree R S, Bhakyaraj R, Vidhyalakshmi R. 2009. Brown rice: Beyond the color reviving a lost health food: A review. Am-Eur J Agron, 2(2): 67-72. |
| [3] | Batista B L, Souza J M O, de Souza S S, Barbosa Jr F. 2011. Speciation of arsenic in rice and estimation of daily intake of different arsenic species by Brazilians through rice consumption. J Hazard Mater, 191: 342-348. |
| [4] | Bhattacharya P, Samal A C, Majumdar J, Santra S C. 2010. Accumulation of arsenic and its distribution in rice plant (Oryza sativa L.) in Gangetic West Bengal, India. Paddy Water Environ, 8(1): 63-70. |
| [5] | Behera G, Sutar P P. 2018. A comprehensive review of mathematical modeling of paddy parboiling and drying: Effects of modern techniques on process kinetics and rice quality. Trends Food Sci Technol, 75: 206-230. |
| [6] | Choi S H, Kim J S, Lee J Y, Jeon J S, Kim J W, Russo R E, Gonzalez J, Yoo J H, Kim K S, Jung Yang S, Park K S. 2014. Analysis of arsenic in rice grains using ICP-MS and fs LA-ICP-MS. J Anal At Spectrom, 29(7): 1233-1237. |
| [7] | Cubadda F, Jackson B P, Cottingham K L, van Horne Y O, Kurzius-Spencer M. 2017. Human exposure to dietary inorganic arsenic and other arsenic species: State of knowledge, gaps and uncertainties. Sci Total Environ, 579: 1228-1239. |
| [8] | Dai S, Yang H U I, Mao X F, Qiu J, Liu Q J, Wang F H, Wang M I N. 2014. Evaluation of arsenate content of rice and rice bran purchased from local markets in the People’s Republic of China. J Food Prot, 77(4): 665-669. |
| [9] | FAO (Food and Agriculture Organization). 2018. World Food and Agriculture: Statistical Pocketbook 2018. Rome: Food and Agriculture Organization. |
| [10] | Guzmán Mar J L, Hinojosa Reyes L, Mizanur Rahman G M, Kingston H M S. 2009. Simultaneous extraction of arsenic and selenium species from rice products by microwave-assisted enzymatic extraction and analysis by ion chromatography- inductively coupled plasma-mass spectrometry. J Agric Food Chem, 57(8): 3005-3013. |
| [11] | Heinemann R J B, Fagundes P L, Pinto E A, Penteado M V C, Lanfer-Marquez U M. 2005. Comparative study of nutrient composition of commercial brown, parboiled and milled rice from Brazil. J Food Compos Anal, 18(4): 287-296. |
| [12] | Heinemann R J B, Behrens J H, Lanfer-Marquez U M. 2006. A study on the acceptability and consumer attitude towards parboiled rice. Intl J Food Sci Technol, 41(6): 627-634. |
| [13] | Heitkemper D T, Vela N P, Stewart K R, Westphal C S. 2001. Determination of total and speciated arsenic in rice by ion chromatography and inductively coupled plasma mass spectrometry. J Anal At Spectrom, 16(4): 299-306. |
| [14] | IARC (International Agency for Research on Cancer). 2012. A Review of Human Carcinogens: Arsenic, Metals, Fibres, and Dusts. Lyon: World Health Organization Press. |
| [15] | Jorhem L, Åstrand C, Sundström B, Baxter M. Stokes P, Lewis J, Grawé K P. 2008. Elements in rice from the Swedish market: 1. Cadmium, lead and arsenic (total and inorganic). Food Addit Contam: Part A Chem Anal Control Expo Risk Assess, 25(3): 284-292. |
| [16] | Khan M A, Islam M R, Panaullah G M, Duxbury J M, Jahiruddin M, Loeppert R H. 2010. Accumulation of arsenic in soil and rice under wetland condition in Bangladesh. Plant Soil, 333(1): 263-274. |
| [17] | Kwofie E M, Ngadi M. 2017. A review of rice parboiling systems, energy supply, and consumption. Renewable Sustainable Energy Rev, 72: 465-472. |
| [18] | Lombi E, Scheckel K G, Pallon J, Carey A M, Zhu Y G, Meharg A A. 2009. Speciation and distribution of arsenic and localization of nutrients in rice grains. New Phytol, 184(1): 193-201. |
| [19] | Lu Y, Dong F, Deacon C, Chen H J, Raab A, Meharg A A. 2010. Arsenic accumulation and phosphorus status in two rice (Oryza sativa L.) cultivars surveyed from fields in South China. Environm Pollut, 158(5): 1536-1541. |
| [20] | Luh B S, Mickus R R. 1991. Parboiled rice. In: Luh B S. Rice: Volume I. Production/Volume II. Utilization. Boston, USA:Springer : 470-507. |
| [21] | Meharg A A, Lombi E, Williams P N, Scheckel K G, Feldmann J, Raab A, Islam R. 2008. Speciation and localization of arsenic in white and brown rice grains. Environ Sci Technol, 42(4): 1051-1057. |
| [22] | Meharg A A, Williams P N, Adomako E, Lawgali Y Y, Deacon C, Villada A, Cambell R C J, Sun G, Zhu Y G, Feldmann J, Raab A, Zhao F J, Islam R, Hossain S, Yanai J. 2009. Geographical variation in total and inorganic arsenic content of polished (white) rice. Environ Sci Technol, 43(5): 1612-1617. |
| [23] | Monks J L F, Vanier N L, Casaril J, Berto R M, de Oliveira M, Gomes C B, Carvalho M P, Dias A R G, Elias M C. 2013. Effects of milling on proximate composition, folic acid, fatty acids and technological properties of rice. J Food Compos Anal, 30(2): 73-79. |
| [24] | Munera-Picazo S, Burló F, Carbonell-Barrachina Á A. 2014. Arsenic speciation in rice-based food for adults with celiac disease. Food Additi Contam: Part A Chem Anal Control Expo Risk Assess, 31(8): 1358-1366. |
| [25] | Mwale T, Rahman M M, Mondal D. 2018. Risk and benefit of different cooking methods on essential elements and arsenic in rice. Int J Environ Res Public Health, 15(6): 1056. |
| [26] | Naito S, Matsumoto E, Shindoh K, Nishimura T. 2015. Effects of polishing, cooking, and storing on total arsenic and arsenic species concentrations in rice cultivated in Japan. Food Chem, 168: 294-301. |
| [27] | Narukawa T, Matsumoto E, Nishimura T, Hioki A. 2014. Determination of sixteen elements and arsenic species in brown, polished and milled rice. Anal Sci, 30(2): 245-250. |
| [28] | Nishimura T, Hamano-Nagaoka M, Sakakibara N, Abe T, Maekawa Y, Maitani T. 2010. Determination method for total arsenic and partial-digestion method with nitric acid for inorganic arsenic speciation in several varieties of rice. J Food Hyg Soc Japan, 51(4): 178-181. |
| [29] | Oli P, Ward R, Adhikari B, Torley P. 2014. Parboiled rice: Understanding from a materials science approach. J Food Eng, 124: 173-183. |
| [30] | Padua A B, Juliano B O. 1974. Effect of parboiling on thiamin, protein and fat of rice. J Sci Food Agric, 25(6): 697-701. |
| [31] | Rahman M A, Hasegawa H, Rahman M M, Rahman M A, Miah M A M. 2007. Accumulation of arsenic in tissues of rice plant (Oryza sativa L.) and its distribution in fractions of rice grain. Chemosphere, 69(6): 942-948. |
| [32] | Ren X L, Liu Q L, Wu D X, Shu Q Y. 2006. Variations in concentration and distribution of health-related elements affected by environmental and genotypic differences in rice grains. Rice Sci, 13: 170-l78. |
| [33] | Runge J, Heringer O A, Ribeiro J S, Biazati L B. 2019. Multi- element rice grain s analysis by ICP-OES and classification by processing types. Food Chem, 271: 419-424. |
| [34] | Sanz E, Muñoz-Olivas R. Cámara C. 2005. A rapid and novel alternative to conventional sample treatment for arsenic speciation in rice using enzymatic ultrasonic probe. Anal Chim Acta, 535(1/2): 227-235. |
| [35] | Smith E, Kempson I, Juhasz A L, Weber J, Skinner W M, Gräfe M. 2009. Localization and speciation of arsenic and trace elements in rice tissues. Chemosphere, 76(4): 529-535. |
| [36] | Sun G X, Williams P N, Carey A M, Zhu Y G, Deacon C, Raab A. Feldmann J, Islam R M, Meharg A A. 2008. Inorganic arsenic in rice bran and its products are an order of magnitude higher than in bulk grain. Environ Sci Technol, 42(19): 7542-7546. |
| [37] | Tenni D, Martin M, Barberis E, Beone G M, Miniotti E, Sodano M, Zanzo E, Fontanella M C, Romani M. 2017. Total As and As speciation in Italian rice as related to producing areas and paddy soils properties. J Agric Food Chem, 65(17): 3443-3452. |
| [38] | The European Commission.2013. Regulation (EU) No 1308/2013 of the European Parliament and of the Council of 17 December 2013 establishing a common organisation of the markets in agricultural products and repealing Council Regulations (EEC) No 922/72, EEC No 234/79, EC No 1037/2001 and EC No 1234/2007. |
| [39] | The European Commission. 2015. Commission regulation (EU) 2015/1006 of 25 June 2015 amending regulation (EC) No. 1881/2006 as regards maximum levels of inorganic arsenic in foodstuff. . |
| [40] | Williams P N, Price A H, Raab A, Hossain S A, Feldmann J, Meharg A A. 2005. Variation in arsenic speciation and concentration in paddy rice related to dietary exposure. Environ Sci Technol, 39(15): 5531-5540. |
| No related articles found! |
| 阅读次数 | ||||||
|
全文 |
|
|||||
|
摘要 |
|
|||||