Rice Science ›› 2022, Vol. 29 ›› Issue (4): 353-362.DOI: 10.1016/j.rsci.2021.12.009
收稿日期:2021-08-24
接受日期:2021-12-13
出版日期:2022-07-28
发布日期:2022-06-01
. [J]. Rice Science, 2022, 29(4): 353-362.
| Gene name | MSU ID | RAP ID | ORF length (bp) | Protein length (aa) | Molecular weight (kDa) |
|---|---|---|---|---|---|
| OsCUT1 | LOC_Os01g34560 | Os01g0529800 | 1 437 | 479 | 52.2 |
| OsCUT2 | LOC_Os02g49920 | Os02g0731900 | 1 458 | 486 | 53.3 |
| OsCUT3 | LOC_Os03g06705 | Os03g0162800 | 1 143 | 308 | 33.8 |
| OsCUT4 | LOC_Os03g08360 | Os03g0181500 | 1 629 | 543 | 60.1 |
| OsCUT5 | LOC_Os06g14810 | Os06g0260500 | 1 479 | 493 | 54.3 |
| OsCUT6 | LOC_Os06g15020 | Os06g0262200 | 1 476 | 492 | 54.0 |
| OsCUT7 | LOC_Os06g15170 | Os06g0262800 | 1 485 | 495 | 54.3 |
| OsCUT8 | LOC_Os06g15250 | Os06g0263400 | 1 515 | 505 | 54.8 |
| OsCUT9 | LOC_Os10g28060 | Os10g0416200 | 822 | 274 | 30.3 |
Table 1. Details of nine CUT proteins in rice.
| Gene name | MSU ID | RAP ID | ORF length (bp) | Protein length (aa) | Molecular weight (kDa) |
|---|---|---|---|---|---|
| OsCUT1 | LOC_Os01g34560 | Os01g0529800 | 1 437 | 479 | 52.2 |
| OsCUT2 | LOC_Os02g49920 | Os02g0731900 | 1 458 | 486 | 53.3 |
| OsCUT3 | LOC_Os03g06705 | Os03g0162800 | 1 143 | 308 | 33.8 |
| OsCUT4 | LOC_Os03g08360 | Os03g0181500 | 1 629 | 543 | 60.1 |
| OsCUT5 | LOC_Os06g14810 | Os06g0260500 | 1 479 | 493 | 54.3 |
| OsCUT6 | LOC_Os06g15020 | Os06g0262200 | 1 476 | 492 | 54.0 |
| OsCUT7 | LOC_Os06g15170 | Os06g0262800 | 1 485 | 495 | 54.3 |
| OsCUT8 | LOC_Os06g15250 | Os06g0263400 | 1 515 | 505 | 54.8 |
| OsCUT9 | LOC_Os10g28060 | Os10g0416200 | 822 | 274 | 30.3 |
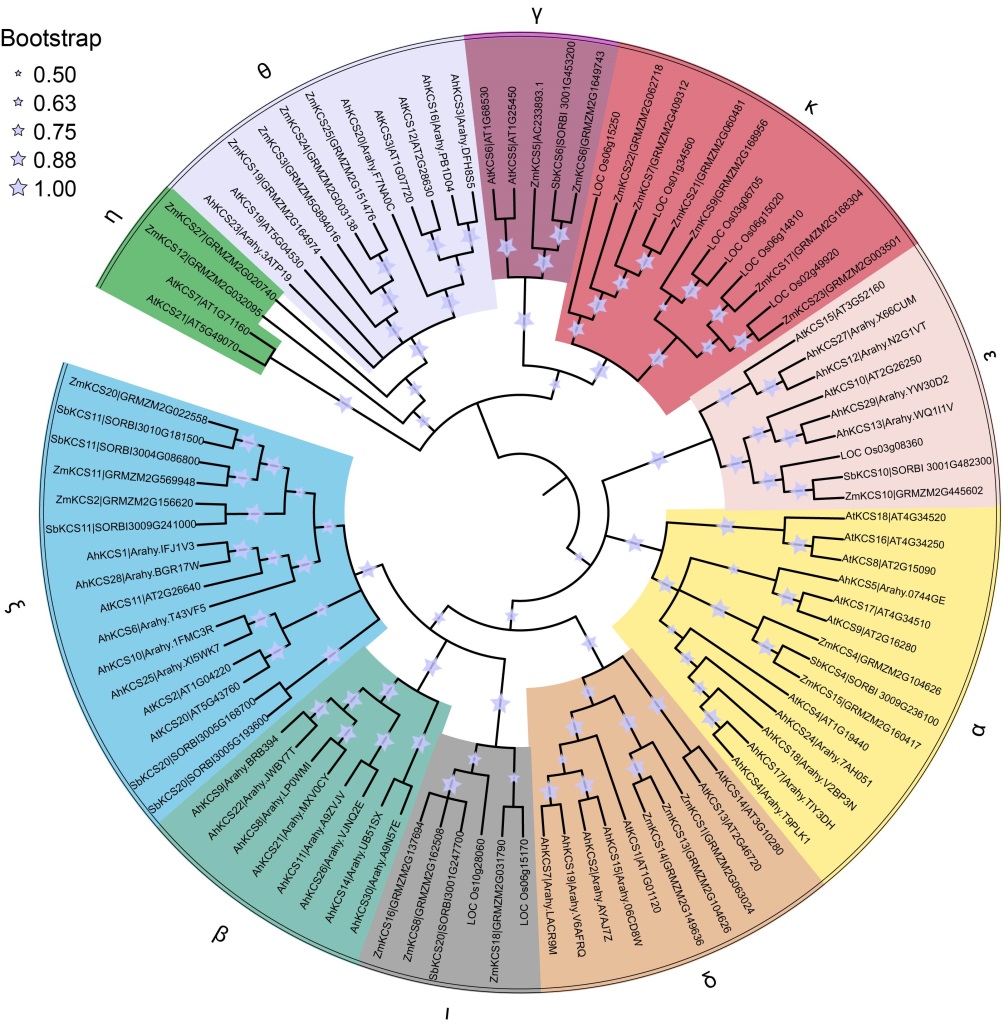
Fig. 1. Phylogenetic tree of CUT family. The phylogenetic tree was constructed by MEGAX using the maximum likelihood method. Different subfamilies are highlighted with different colors.
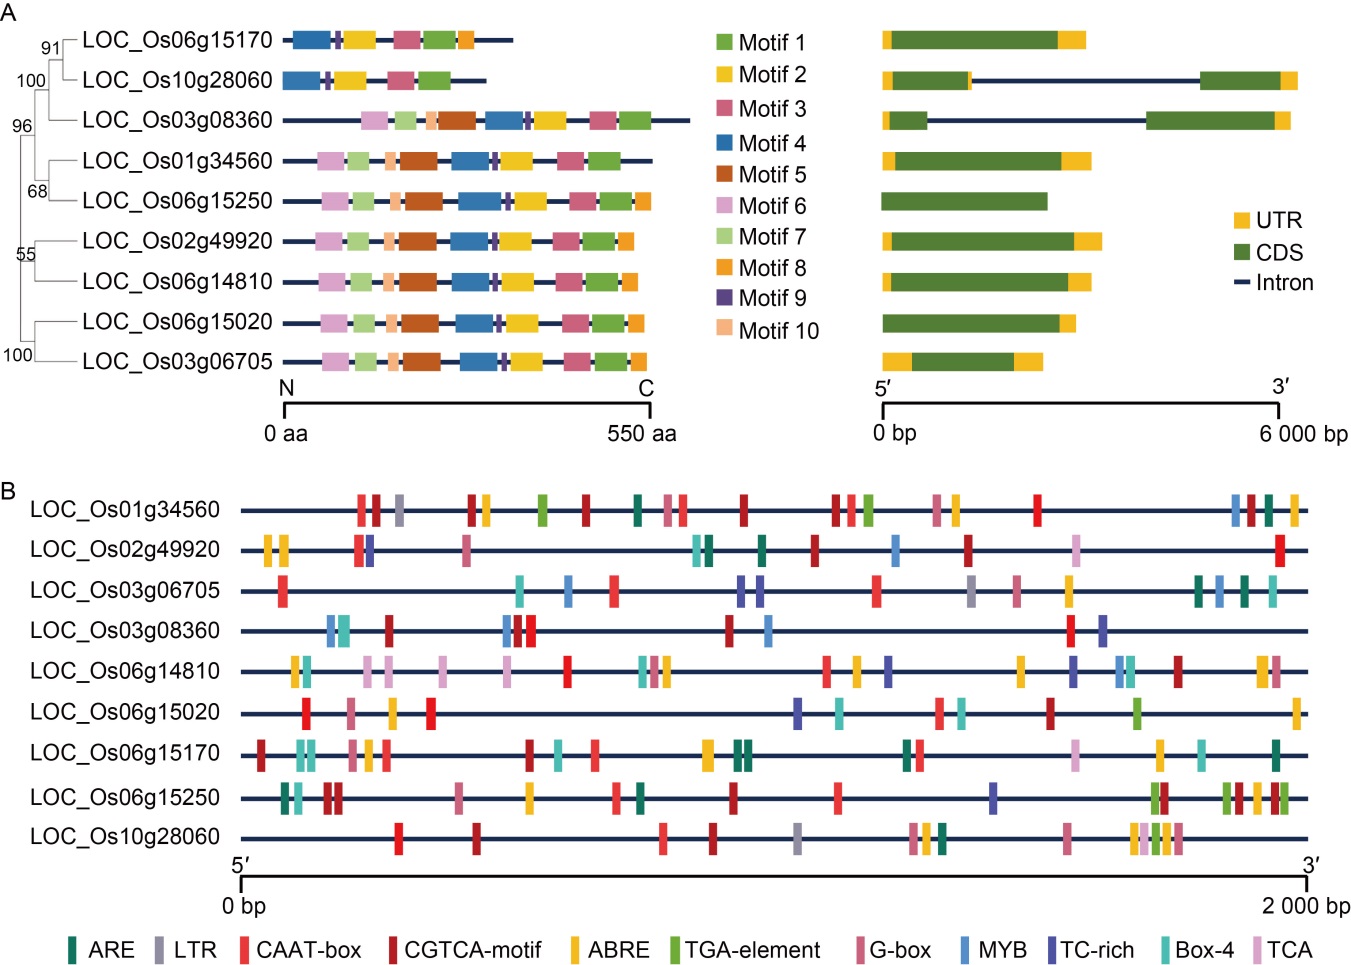
Fig. 2. Gene structure, conserved motif and predicted cis-regulatory element in OsCUT genes. A, Distributions of conserved motifs in OsCUT genes. Ten putative motifs are indicated in different colored boxes. The sequence information of the 10 motifs was in Table S1. The right figure shows exon/intron organization of OsCUT genes. Green boxes represent exons and black lines with the same length represent introns. The upstream/downstream regions of OsCUT genes are indicated with yellow boxes. The length of exons can be inferred by the scale at the bottom. UTR, Untranslated region; CDS, Coding sequence. B, Predicted cis-regulatory element in OsCUT promoters. The sequence information of the 11 motifs was in Table S2. ARE, Elements for the anaerobic induction; LTR, Low-temperature-responsive element; ABRE, ABA-responsive element; MYB, MYB-binding site.
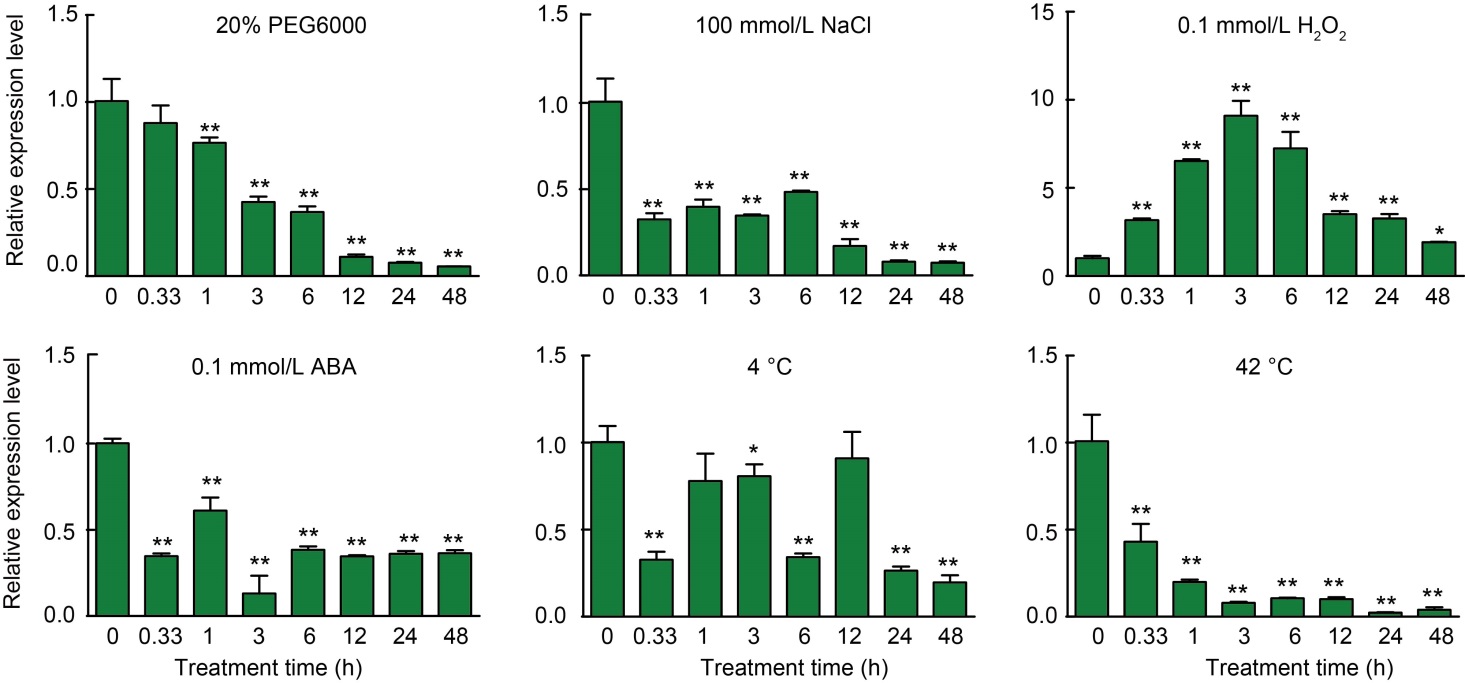
Fig. 3. Expression patterns of OsCUT1 after 20% PEG6000, 100 mmol/L NaCl, 0.1 mmol/L H2O2, 0.1 mmol/L abscisic acid (ABA), 4 ºC and 42 ºC treatments. The relative expression of OsCUT1 in different periods was verified by qRT-PCR. Total RNAs were extracted from rice seedlings of two-week-old plants. OsActin gene was used as a control. The transcript level at 0 h was defined as ‘1’. Data were Mean ± SE (n = 3), and compared by the Student’s t-test. *, P < 0.05; **, P < 0.01.
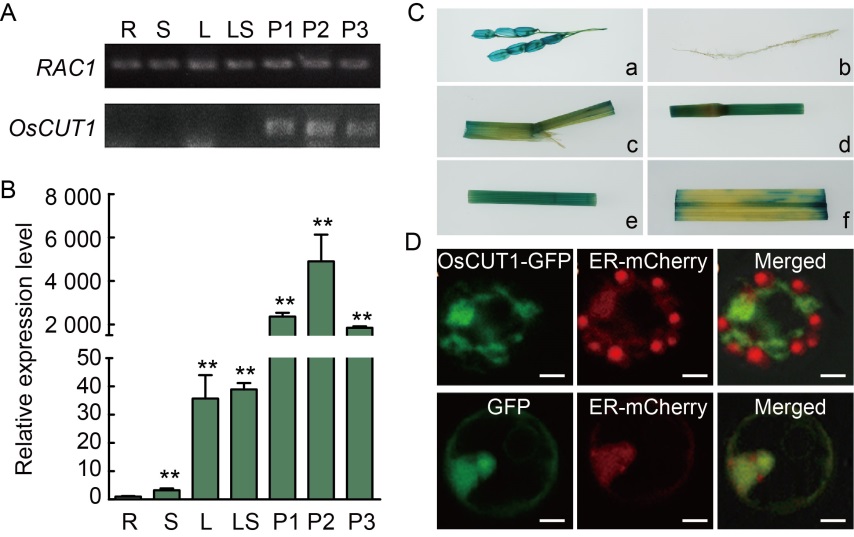
Fig. 4. Spatial expression pattern and subcellular location of OsCUT1. A, OsCUT1 expression in different tissues by reverse transcription semi-quantitative PCR. RAC1 gene was used as a control. B, OsCUT1 expression in different tissues by qRT-PCR. OsActin gene was used as a control. Data were Mean ± SE (n = 3), and compared by the Student’s t-test. **, P < 0.01. C, GUS expression patterns of OsCUT1:GUS transgenic rice plants. GUS activity was detected in different tissues: glume (a), root (b), lamina joint (c), stem (d), sheath (e) and leaf (f). D, Co-expression of OsCUT1-GFP fusion protein and ER-mCherry fusion protein in rice protoplasts was imaged by a confocal microscopy with a Zeiss LSM780 fitted with green (OsCUT1-GFP) and red filters (ER-mCherry). Scale bars, 5 μm. R, Root; S, Stem; L, Leaf; LS, Leaf sheath; P1, Panicle (~3 cm); P2, Panicle (~8 cm); P3, Panicle (~12 cm); GUS, β-Glucuronidase; GFP, Green fluorescent protein; ER, Endoplasmic reticulum.
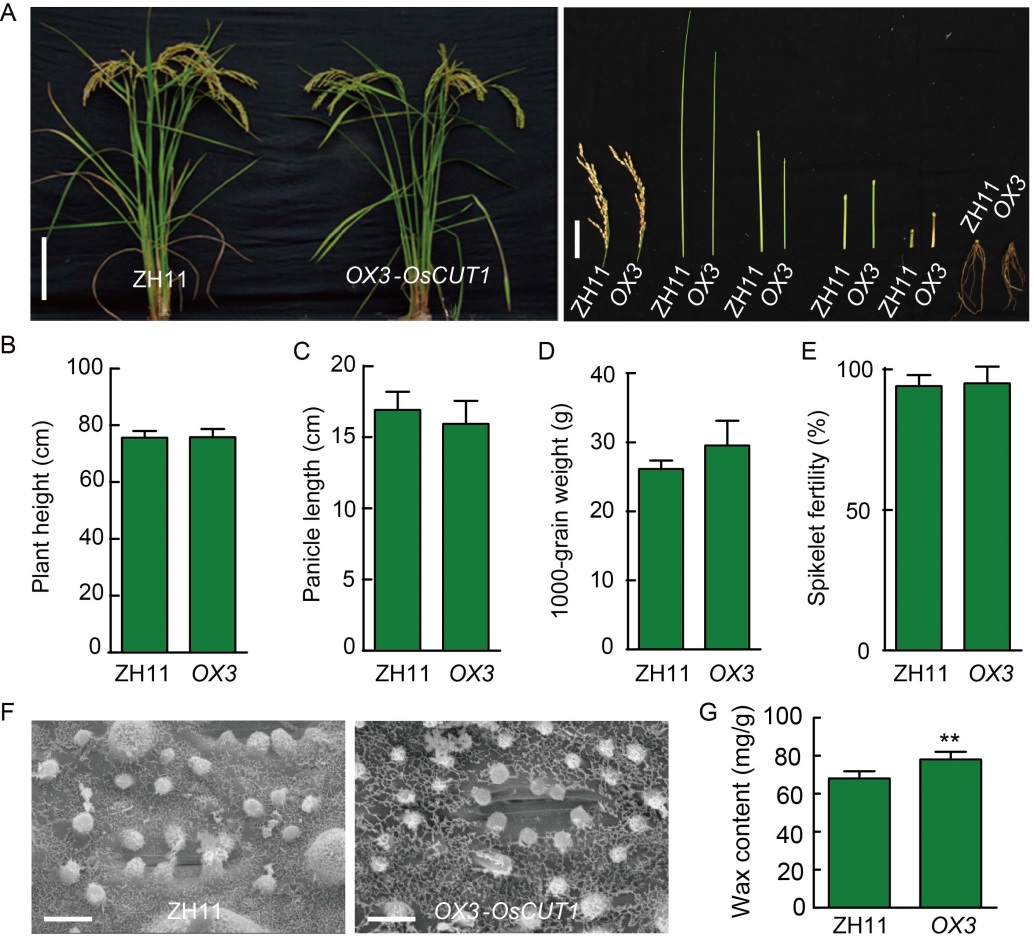
Fig. 5. Phenotypes of OsCUT1 over- expression OX-OsCUT1 plants. A, Morphology of OX-OsCUT1 (OX3) and wild type Zhonghua 11 (ZH11) plants at the reproductive stage. Scale bars are 20 cm and 5 cm for the left and right figures, respectively. B?E, Quantification of plant height (B), panicle length (C), 1000-grain weight (D) and spikelet fertility (E) of the OX- OsCUT1 plants (OX3) compared with wild type ZH11. For quantification of plant height, panicle length and spikelet fertility, data were Mean ± SE (n = 10). For quantification of 1000-grain weight, data were Mean ± SE (n = 3). All data were compared by the Student’s t-test. F, Scanning electron microscopy of epicuticular wax on leaf surface of OX-OsCUT1 and wild type ZH11. Scale bars, 10 μm. G, OX-OsCUT1 transgenic plants in ZH11 background show significantly increased wax crystals on leaf surface compared to ZH11. Data were Mean ± SE (n = 3), and compared by the Student’s t-test. **, P < 0.01.
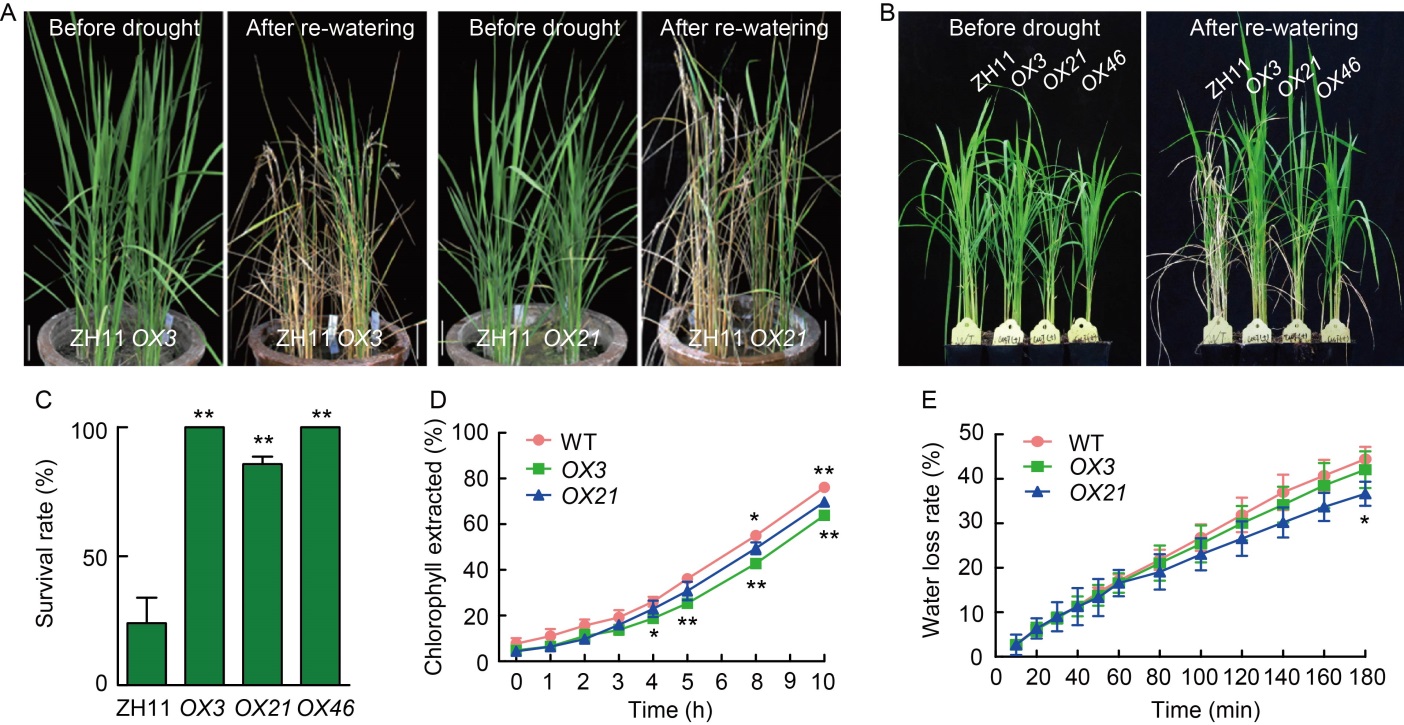
Fig. 6. Effects of drought stress and altered cuticular permeability in OsCUT1 overexpression plants (OX-OsCUT1). A, Two-month-old wild type (WT) Zhonghua 11 (ZH11) and OX-OsCUT1 transgenic plants before drought stress and after re-watering for 14 d. Scale bars, 10 cm. B, Three-week-old WT and OX-OsCUT1 transgenic plants before drought stress and after re-watering for 14 d. C, Survival rates of WT and OX-OsCUT1 transgenic plants for drought stress and re-watering for 14 d. D, Ratios of total chlorophyll extracted from WT and OX-OsCUT1. E, Water loss rates in WT and OX-OsCUT1 transgenic leaves. Data were Mean ± SE (n = 3), and compared by the Student’s t-test. *, P < 0.05; **, P < 0.01.
| [1] | Buschhaus C, Jetter R. 2012. Composition and physiological function of the wax layers coating Arabidopsis leaves: β-amyrin negatively affects the intracuticular water barrier. Plant Physiol, 160(2): 1120-1129. |
| [2] |
Fiebig A, Mayfield J A, Miley N L, Chau S, Fischer R L, Preuss D. 2000. Alterations in CER6, a gene identical to CUT1, differentially affect long-chain lipid content on the surface of pollen and stems. Plant Cell, 12(10): 2001-2008.
PMID |
| [3] | Franke R, Höfer R, Briesen I, Emsermann M, Efremova N, Yephremov A, Schreiber L. 2009. The DAISY gene from Arabidopsis encodes a fatty acid elongase condensing enzyme involved in the biosynthesis of aliphatic suberin in roots and the chalaza- micropyle region of seeds. Plant J, 57(1): 80-95. |
| [4] |
Gan L, Wang X L, Cheng Z J, Liu L L, Wang J L, Zhang Z, Ren Y L, Lei C L, Zhao Z C, Zhu S S, Lin Q B, Wu F Q, Guo X P, Wang J, Zhang X, Wan J M. 2016. Wax crystal-sparse leaf 3encoding a β-ketoacyl-CoA reductase is involved in cuticular wax biosynthesis in rice. Plant Cell Rep, 35(8): 1687-1698.
PMID |
| [5] |
Gan L, Zhu S S, Zhao Z C, Liu L L, Wang X L, Zhang Z, Zhang X, Wang J, Wang J L, Guo X P, Wan J M. 2017. Wax Crystal- Sparse Leaf 4, encoding a β-ketoacyl-coenzyme A synthase 6, is involved in rice cuticular wax accumulation. Plant Cell Rep, 36(10): 1655-1666.
PMID |
| [6] | Gray J E, Holroyd G H, van der Lee F M, Bahrami A R, Sijmons P C, Woodward F I, Schuch W, Hetherington A M. 2000. The HIC signalling pathway links CO2 perception to stomatal development. Nature, 408: 713-716. |
| [7] |
Haslam T M, Kunst L. 2013. Extending the story of very-long- chain fatty acid elongation. Plant Sci, 210: 93-107.
PMID |
| [8] |
Hooker T S, Millar A A, Kunst L. 2002. Significance of the expression of the CER6 condensing enzyme for cuticular wax production in Arabidopsis. Plant Physiol, 129(4): 1568-1580.
PMID |
| [9] | Islam M A, Du H, Ning J, He H Y, Xiong L Z. 2009. Characterization of Glossy1-homologous genes in rice involved in leaf wax accumulation and drought resistance. Plant Mol Biol, 70(4): 443-456. |
| [10] |
James D W Jr, Lim E, Keller J, Plooy I, Ralston E, Dooner H K. 1995. Directed tagging of the Arabidopsis FATTY ACID ELONGATION1 (FAE1) gene with the maize transposon activator. Plant Cell, 7(3): 309-319.
PMID |
| [11] | Joubès J, Raffaele S, Bourdenx B, Garcia C, Laroche-Traineau J, Moreau P, Domergue F, Lessire R. 2008. The VLCFA elongase gene family in Arabidopsis thaliana: Phylogenetic analysis, 3D modelling and expression profiling. Plant Mol Biol, 67(5): 547-566. |
| [12] | Kunst L, Samuels L. 2009. Plant cuticles shine: Advances in wax biosynthesis and export. Curr Opin Plant Biol, 12(6): 721-727. |
| [13] | Lee S B, Suh M C. 2013. Recent advances in cuticular wax biosynthesis and its regulation in Arabidopsis. Mol Plant, 6(2): 246-249. |
| [14] | Lee S B, Jung S J, Go Y S, Kim H U, Kim J K, Cho H J, Park O K, Suh M C. 2009. Two Arabidopsis 3-ketoacyl CoA synthase genes, KCS20and KCS2/DAISY, are functionally redundant in cuticular wax and root suberin biosynthesis, but differentially controlled by osmotic stress. Plant J, 60(3): 462-475. |
| [15] |
Lolle S J, Berlyn G P, Engstrom E M, Krolikowski K A, Reiter W D, Pruitt R E. 1997. Developmental regulation of cell interactions in the Arabidopsis fiddlehead-1 mutant: A role for the epidermal cell wall and cuticle. Dev Biol, 189(2): 311-321.
PMID |
| [16] | Mao B G, Cheng Z J, Lei C L, Xu F H, Gao S W, Ren Y L, Wang J L, Zhang X, Wang J, Wu F Q, Guo X P, Liu X L, Wu C Y, Wang H Y, Wan J M. 2012. Wax crystal-sparse leaf2, a rice homologue of WAX2/GL1, is involved in synthesis of leaf cuticular wax. Planta, 235(1): 39-52. |
| [17] |
Millar A A, Clemens S, Zachgo S, Giblin E M, Taylor D C, Kunst L. 1999. CUT1, an Arabidopsis gene required for cuticular wax biosynthesis and pollen fertility, encodes a very-long-chain fatty acid condensing enzyme. Plant Cell, 11(5): 825-838.
PMID |
| [18] | Pruitt R E, Vielle-Calzada J P, Ploense S E, Grossniklaus U, Lolle S J. 2000. FIDDLEHEAD, a gene required to suppress epidermal cell interactions in Arabidopsis, encodes a putative lipid biosynthetic enzyme. Proc Natl Acad Sci USA, 97(3): 1311-1316. |
| [19] | Qi C H, Zhao X Y, Jiang H, Zheng P F, Liu H T, Li Y Y, Hao Y J. 2018. Isolation and functional identification of an apple MdCER1 gene. Plant Cell Tissue Organ Cult, 136(1): 1-13. |
| [20] | Qin B X, Tang D, Huang J, Li M, Wu X R, Lu L L, Wang K J, Yu H X, Chen J M, Gu M H, Cheng Z K. 2011. Rice OsGL1-1 is involved in leaf cuticular wax and cuticle membrane. Mol Plant, 4(6): 985-995. |
| [21] | Qin Y M, Pujol F M, Hu C Y, Feng J X, Kastaniotis A J, Hiltunen J K, Zhu Y X. 2007. Genetic and biochemical studies in yeast reveal that the cotton fibre-specific GhCER6 gene functions in fatty acid elongation. J Exp Bot, 58(3): 473-481. |
| [22] |
Samuels L, Kunst L, Jetter R. 2008. Sealing plant surfaces: Cuticular wax formation by epidermal cells. Annu Rev Plant Biol, 59: 683-707.
PMID |
| [23] |
Shepherd T, Wynne Griffiths D. 2006. The effects of stress on plant cuticular waxes. New Phytol, 171(3): 469-499.
PMID |
| [24] | Suh M C, Samuels A L, Jetter R, Kunst L, Pollard M, Ohlrogge J, Beisson F. 2005. Cuticular lipid composition, surface structure, and gene expression in Arabidopsis stem epidermis. Plant Physiol, 139(4): 1649-1665. |
| [25] | Wang X C, Guan Y Y, Zhang D, Dong X B, Tian L H, Qu L Q. 2017. A β-ketoacyl-CoA synthase is involved in rice leaf cuticular wax synthesis and requires a CER2-LIKE protein as a cofactor. Plant Physiol, 173(2): 944-955. |
| [26] | Wei H B, Chen C, Ma X S, Zhang Y, Han J, Mei H W, Yu S W. 2017. Comparative analysis of expression profiles of panicle development among tolerant and sensitive rice in response to drought stress. Front Plant Sci, 8: 437. |
| [27] | Ye W J, Hu S K, Wu L W, Ge C W, Cui Y T, Chen P, Wang X W, Xu J, Ren D Y, Dong G J, Qian Q, Guo L B. 2016. White stripe leaf 12 (WSL12), encoding a nucleoside diphosphate kinase 2 (OsNDPK2), regulates chloroplast development and abiotic stress response in rice (Oryza sativa L.). Mol Breed, 36: 57. |
| [28] | Yeats T H, Rose J K C. 2013. The formation and function of plant cuticles. Plant Physiol, 163(1): 5-20. |
| [29] |
Yephremov A, Wisman E, Huijser P, Huijser C, Wellesen K, Saedler H. 1999. Characterization of the FIDDLEHEAD gene of Arabidopsis reveals a link between adhesion response and cell differentiation in the epidermis. Plant Cell, 11(11): 2187-2201.
PMID |
| [30] | Yu D M, Ranathunge K, Huang H S, Pei Z Y, Franke R, Schreiber L, He C Z. 2008. Wax Crystal-Sparse Leaf1 encodes a β-ketoacyl CoA synthase involved in biosynthesis of cuticular waxes on rice leaf. Planta, 228(4): 675-685. |
| [31] |
Yuan X, Huang P, Wang R Q, Li H Y, Lv X Q, Duan M, Tang H J, Zhang H S, Huang J. 2018. A zinc finger transcriptional repressor confers pleiotropic effects on rice growth and drought tolerance by down-regulating stress-responsive genes. Plant Cell Physiol, 59(10): 2129-2142.
PMID |
| [32] | Zhang C L, Hu X, Zhang Y L, Liu Y, Wang G L, You C X, Li Y Y, Hao Y J. 2020a. An apple long-chain acyl-CoA synthetase 2 gene enhances plant resistance to abiotic stress by regulating the accumulation of cuticular wax. Tree Physiol, 40(10): 1450-1465. |
| [33] | Zhang C L, Zhang Y L, Hu X, Xiao X, Wang G L, You C X, Li Y Y, Hao Y J. 2020b. An apple long-chain acyl-CoA synthetase, MdLACS4, induces early flowering and enhances abiotic stress resistance in Arabidopsis. Plant Sci, 297: 110529. |
| [34] |
Zhang D, Yang H F, Wang X C, Qiu Y J, Tian L H, Qi X Q, Qu L Q. 2020. Cytochrome P450 family member CYP96B5 hydroxylates alkanes to primary alcohols and is involved in rice leaf cuticular wax synthesis. New Phytol, 225(5): 2094-2107.
PMID |
| [35] | Zhong M S, Jiang H, Cao Y, Wang Y X, You CX, Li Y Y, Hao Y J. 2020. MdCER2 conferred to wax accumulation and increased drought tolerance in plants. Plant Physiol Biochem, 149: 277-285. |
| No related articles found! |
| 阅读次数 | ||||||
|
全文 |
|
|||||
|
摘要 |
|
|||||