Rice Science ›› 2018, Vol. 25 ›› Issue (5): 286-292.DOI: 10.1016/j.rsci.2018.08.003
收稿日期:2017-08-11
接受日期:2018-03-21
出版日期:2018-09-28
发布日期:2018-06-11
. [J]. Rice Science, 2018, 25(5): 286-292.
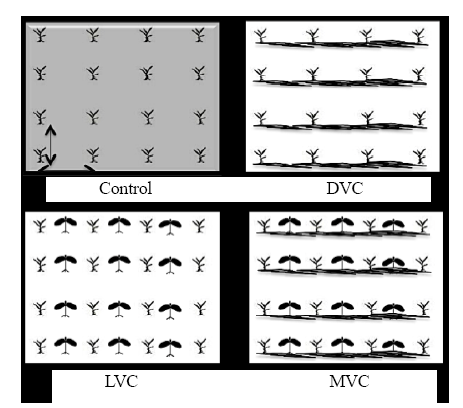
Fig. 1. Different sowing patterns in the experimental design.Control, Plowed soil without vegetation cover; DVC, Unplowed soil with dead vegetation cover; LVC, Unplowed soil with live vegetation cover; MVC, Unplowed soil with mixed vegetation cover.
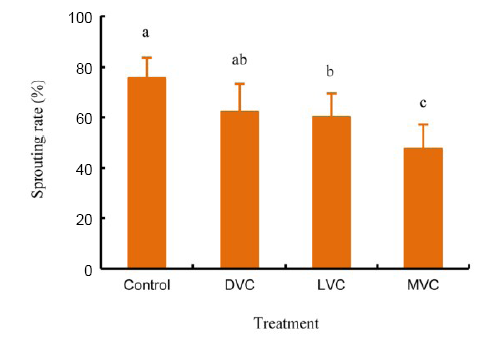
Fig. 2. Influence of tillage and direct seeding on NERICA sprouting rate.
| Variety | Treatment | Time (week) | Regression equation for plant height (cm) | R2 | Time (week) | Regression equation for number of leaves per plant | R2 |
|---|---|---|---|---|---|---|---|
| NERICA 3 | Control | - | Y = 5.01e^0.32x | 0.98 | - | Y' = 3.3x - 1.24 | 0.99 |
| DVC | - | Y = 5.17e^0.31x | 0.99 | - | Y' = 3.3x - 1.24 | 0.99 | |
| LVC | - | Y = 5.25e^0.31x | 0.98 | 4-7 | Y' = 2.73e^0.23x (*) | 0.98 | |
| MVC | - | Y = 5.71e^0.23x | 0.98 | 4-7 | Y' = 2.06e^0.24x (*) | 0.94 | |
| NERICA 8 | Control | - | Y = 5.41e^0.31x | 0.98 | - | Y' = 5x - 5.04 | 0.97 |
| DVC | 10 | Y = 5.49e^0.32x (**) | 0.98 | 4-10 | Y' = 4.02x - 2.31 (*) | 0.97 | |
| LVC | - | Y = 5.95e^0.27x | 0.99 | 4-7 | Y' = 2.3e^0.24x (**) | 0.96 | |
| MVC | - | Y = 6.61e^0.27x | 0.98 | 4-7 | Y' = 2.38e^0.24x (**) | 0.99 |
Table 1 Relationship between plant height (Y) or number of leaves per plant (Y′) and time after sowing of rice.
| Variety | Treatment | Time (week) | Regression equation for plant height (cm) | R2 | Time (week) | Regression equation for number of leaves per plant | R2 |
|---|---|---|---|---|---|---|---|
| NERICA 3 | Control | - | Y = 5.01e^0.32x | 0.98 | - | Y' = 3.3x - 1.24 | 0.99 |
| DVC | - | Y = 5.17e^0.31x | 0.99 | - | Y' = 3.3x - 1.24 | 0.99 | |
| LVC | - | Y = 5.25e^0.31x | 0.98 | 4-7 | Y' = 2.73e^0.23x (*) | 0.98 | |
| MVC | - | Y = 5.71e^0.23x | 0.98 | 4-7 | Y' = 2.06e^0.24x (*) | 0.94 | |
| NERICA 8 | Control | - | Y = 5.41e^0.31x | 0.98 | - | Y' = 5x - 5.04 | 0.97 |
| DVC | 10 | Y = 5.49e^0.32x (**) | 0.98 | 4-10 | Y' = 4.02x - 2.31 (*) | 0.97 | |
| LVC | - | Y = 5.95e^0.27x | 0.99 | 4-7 | Y' = 2.3e^0.24x (**) | 0.96 | |
| MVC | - | Y = 6.61e^0.27x | 0.98 | 4-7 | Y' = 2.38e^0.24x (**) | 0.99 |
| Variety | Treatment | No. of panicles per hill | No. of spikelets per panicle | 1000-grain weight (g) | Dry matter content (%) | Yield (t/hm2) |
|---|---|---|---|---|---|---|
| NERICA3 | Control | 16 ± 5 | 143.7 ± 54.6 | 32.08 ± 0.02 | 50.44 ± 19.27 | 3.05 ± 0.82 |
| DVC | 17 ± 4 | 89.3 ± 23.0 | 31.65 ± 0.01 | 40.43 ± 4.78 | 2.62 ± 0.88 | |
| LVC | 15 ± 2 | 88.7 ± 42.4 | 29.74 ± 0.03 | 53.87 ± 9.42 | 2.42 ± 1.42 | |
| MVC | 15 ± 7 | 50.2 ± 43.8 | 30.28 ± 0.03 | 42.88 ± 3.88 | 2.16 ± 1.50 | |
| Mean | 16 ± 5 a | 93.0 ± 40.9 a | 30.94 ± 0.02 a | 46.91 ± 9.33 a | 2.50 ± 1.40 a | |
| NERICA8 | Control | 20 ± 5 | 43.4 ± 14.7 | 27.83 ± 0.01 | 33.51 ± 6.04 | 1.21 ± 0.95 |
| DVC | 14 ± 2 | 44.1 ± 10.9 | 28.52 ± 0.01 | 33.88 ± 8.12 | 1.02 ± 0.40 | |
| LVC | 16 ± 7 | 25.2 ± 14.5 | 24.65 ± 0.06 | 32.61 ± 2.04 | 0.71 ± 0.21 | |
| MVC | 19 ± 3 | 30.5 ± 1.8 | 30.31 ± 0.03 | 37.26 ± 3.85 | 0.93 ± 0.34 | |
| Mean | 17 ± 4 a | 35.8 ± 10.4 b | 27.83 ± 0.03 b | 34.32 ± 5.01 b | 0.97 ± 0.59 b | |
| Cultivation system | ns | ns | ns | ns | ns | |
| Variety | ns | *** | * | ** | * | |
| Cultivation system × variety | ns | ns | ns | ns | ns | |
Table 2 Yield traits of NERICA 3 and NERICA 8.
| Variety | Treatment | No. of panicles per hill | No. of spikelets per panicle | 1000-grain weight (g) | Dry matter content (%) | Yield (t/hm2) |
|---|---|---|---|---|---|---|
| NERICA3 | Control | 16 ± 5 | 143.7 ± 54.6 | 32.08 ± 0.02 | 50.44 ± 19.27 | 3.05 ± 0.82 |
| DVC | 17 ± 4 | 89.3 ± 23.0 | 31.65 ± 0.01 | 40.43 ± 4.78 | 2.62 ± 0.88 | |
| LVC | 15 ± 2 | 88.7 ± 42.4 | 29.74 ± 0.03 | 53.87 ± 9.42 | 2.42 ± 1.42 | |
| MVC | 15 ± 7 | 50.2 ± 43.8 | 30.28 ± 0.03 | 42.88 ± 3.88 | 2.16 ± 1.50 | |
| Mean | 16 ± 5 a | 93.0 ± 40.9 a | 30.94 ± 0.02 a | 46.91 ± 9.33 a | 2.50 ± 1.40 a | |
| NERICA8 | Control | 20 ± 5 | 43.4 ± 14.7 | 27.83 ± 0.01 | 33.51 ± 6.04 | 1.21 ± 0.95 |
| DVC | 14 ± 2 | 44.1 ± 10.9 | 28.52 ± 0.01 | 33.88 ± 8.12 | 1.02 ± 0.40 | |
| LVC | 16 ± 7 | 25.2 ± 14.5 | 24.65 ± 0.06 | 32.61 ± 2.04 | 0.71 ± 0.21 | |
| MVC | 19 ± 3 | 30.5 ± 1.8 | 30.31 ± 0.03 | 37.26 ± 3.85 | 0.93 ± 0.34 | |
| Mean | 17 ± 4 a | 35.8 ± 10.4 b | 27.83 ± 0.03 b | 34.32 ± 5.01 b | 0.97 ± 0.59 b | |
| Cultivation system | ns | ns | ns | ns | ns | |
| Variety | ns | *** | * | ** | * | |
| Cultivation system × variety | ns | ns | ns | ns | ns | |
| Variety | Treatment | Total protein content (%) | Total soluble carbohydrate (%) |
|---|---|---|---|
| NERICA 3 | Control | 4.28 ± 0.16 D | 3.58 ± 0.03 C |
| DVC | 7.91 ± 0.19 A | 3.55 ± 0.04 C | |
| LVC | 7.05 ± 0.12 C | 5.55 ± 0.25 AB | |
| MVC | 7.49 ± 0.24 B | 3.22 ± 0.05 C | |
| Mean | 6.68 ± 1.49 a | 3.97 ± 0.97 b | |
| NERICA 8 | Control | 2.31 ± 0.15 F | 3.96 ± 0.07 C |
| DVC | 4.52 ± 0.17 D | 5.09 ± 0.03 B | |
| LVC | 3.54 ± 0.17 E | 6.86 ± 0.84 A | |
| MVC | 3.68 ± 0.03 F | 6.23 ± 0.31 A | |
| Mean | 3.52 ± 0.84 b | 5.53 ± 2.38 a | |
| Cultivation system | *** | *** | |
| Variety | *** | *** | |
| Cultivation system × variety | *** | *** | |
Table 3 Total protein and soluble carbohydrates of NERICA 3 and NERICA 8.
| Variety | Treatment | Total protein content (%) | Total soluble carbohydrate (%) |
|---|---|---|---|
| NERICA 3 | Control | 4.28 ± 0.16 D | 3.58 ± 0.03 C |
| DVC | 7.91 ± 0.19 A | 3.55 ± 0.04 C | |
| LVC | 7.05 ± 0.12 C | 5.55 ± 0.25 AB | |
| MVC | 7.49 ± 0.24 B | 3.22 ± 0.05 C | |
| Mean | 6.68 ± 1.49 a | 3.97 ± 0.97 b | |
| NERICA 8 | Control | 2.31 ± 0.15 F | 3.96 ± 0.07 C |
| DVC | 4.52 ± 0.17 D | 5.09 ± 0.03 B | |
| LVC | 3.54 ± 0.17 E | 6.86 ± 0.84 A | |
| MVC | 3.68 ± 0.03 F | 6.23 ± 0.31 A | |
| Mean | 3.52 ± 0.84 b | 5.53 ± 2.38 a | |
| Cultivation system | *** | *** | |
| Variety | *** | *** | |
| Cultivation system × variety | *** | *** | |
| PH | NL | DMC | Yield | TSC | |
|---|---|---|---|---|---|
| NL | 0.53** | ||||
| DMC | -0.01 | -0.37 | |||
| Yield | 0.40 | 0.02 | 0.71*** | ||
| TSC | -0.29 | -0.42* | 0.16 | -0.03 | |
| Protein | 0.12 | -0.36 | 0.37 | 0.33 | -0.019 |
Table 4 Correlation matrix of the measured variables on NERICA.
| PH | NL | DMC | Yield | TSC | |
|---|---|---|---|---|---|
| NL | 0.53** | ||||
| DMC | -0.01 | -0.37 | |||
| Yield | 0.40 | 0.02 | 0.71*** | ||
| TSC | -0.29 | -0.42* | 0.16 | -0.03 | |
| Protein | 0.12 | -0.36 | 0.37 | 0.33 | -0.019 |
| 1 | Abdellaoui Z, Teskrat H, Belhadj A, Zaghouane O.2006. Comparative study of the effect of conventional tillage, direct seeding and minimum tillage on the behavior of a durum wheat crop in the subhumid zone. In: Bouzerzour H, Irekti H, Vadon B. Third Mediterranean Meetings of Direct Seeding. Ciheam Zaragoza-Spain: 71-87. |
| 2 | Adjahossou B S, Adjahossou V N, Adjahossou D F, Edorh P, Sinsin B, Boko M.2009. Nutritional aspects of optimizing a cropping system combining maize and groundnuts in South Benin.Int J Biol Chem Sci, 3(5): 1141-1150. |
| 3 | AFD.2006. Direct seeding on permanent vegetation cover, an alternative solution to conventional farming systems in Southern countries. France: 68. |
| 4 | Corbeels M, Scopel E, Cardoso A, Bernoux M, Douzet J M, Siqueira Neto M.2006. Soil carbon storage potential of direct seeding mulch-based cropping systems in the Cerrados of Brazil.Global Change Biol, 12(9): 1773-1787. |
| 5 | Davidson E A, Suddick E C, Rice C W, Prokopy L S.2015. More food, low pollution (Mo Fo Lo Po): A grand challenge for the 21st century.J Environ Qual, 44(2): 305-311. |
| 6 | de Vita P, di Paolo E, Fecondo G, di Fonzo N, Pisante M.2007. No-tillage and conventional tillage effects on durum wheat yield, grain quality and soil moisture content in southern Italy. Soil Till Res, 92: 69-78. |
| 7 | Dorel M, Lakhia S, Pététin C, Bouamer S, Risède J M.2010. Banana planting without tillage on a mulch of crop residues: Effect on soil quality and crop functioning.Fruits, 65(2): 55-68. |
| 8 | Dubois O. 2011. The state of the world’s land and water resources for food and agriculture: Managing systems at risk. Rome: FAO. 2011. |
| 9 | Fortas B, Mekhlouf A, Hamsi K, Boudiar R, Laouar A M, Djaïdjaa Z.2013. Impacts of cultivation techniques on the physical behavior of the soil and the cultivation of durum wheat (Triticum durum Desf.) under the semi-arid conditions of the Sétif region.Rev Agric, 6: 12-20. |
| 10 | Hornick S B.1992. Factors affecting the nutritional quality of crops.Am J Altern Agric, 7: 63-68. |
| 11 | Kaur A, Brar A S.2016. Influence of mulching and irrigation scheduling on productivity and water use of turmeric (Curcuma longa L.) in north-western India.Irrig Sci, 34(4): 261-269. |
| 12 | Mbaye M S, Kane A, Gueye M, Bassene C, Ba N, Diop D, Sylla S N, Noba K.2014. Optimum date and density of cowpea seed [Vigna unguiculata(L.) Walp.] in association with millet [Pennisetum glaucum (L.) R. Br.].J Appl Biosci, 76: 6305-6315. |
| 13 | MʼBiandoun M, Dongmo A L, Balarabe O, Nchoutnji I.2009. Crop cover systems in Central Africa: Technical and socio- economic conditions for its development. In: Seiny-Boukar L, Boumard P. African Savannahs in Development: Innovate to Last. Cirad, Garoua: 1-10. |
| 14 | Mekhlouf A, Makhlouf M, Achiri A, Ait-Ouali A, Kourougli S.2011. Comparative study of the effect of tillage systems and previous crops on the soil and the behavior of common wheat (Triticum aestivum L.) under semi-arid conditions.Agriculture, 2: 52-65. |
| 15 | Mohammed B, Rachid M, Rachid M, Oumaima I, Mohamed B, Mohamed G, Bouchaib B.2013. Impact of agricultural practices on structural stability and soil organic matter in semi-arid Moroccan areas.Int J Inno Appl Stud, 4(2): 322-333. |
| 16 | Muthayya S, Sugimoto J D, Montgomery S, Maberly G F.2014. An overview of global rice production, supply, trade, and consumption.Ann New York Acad Sci, 1324: 7-14. |
| 17 | Pimentel D, Michael B.2013. Soil erosion threatens food production.Agriculture, 3(3): 443-463. |
| 18 | Rakotoarisoa J, Oliver R, Dusserre J, Muller B, Douzet J M, Michellon R, Moussa N, Razafinjara L A, Rajeriarison C, Scopel E.2010. Assessment of mineral nitrogen during the rainfed rice cycle under-cropping subsystems under vegetal cover in ferralitic clay soil in Madagascar.Etud Gest Sols, 2(17): 169-186. |
| 19 | Rodenburg J, Cissoko M, Kayeke J, Dieng I, Khan Z R,., Midega C A O, Onyuka E A, Scholes J D.2015. Do NERICA rice cultivars express resistance toStriga hermonthica(Del.) Benth. and Striga asiatica (L.) Kuntze under field conditions?Field Crops Res, 170: 83-94. |
| 20 | SAS.2004. SAS Base 9.3.1: Procedures Guide. Cary, NC: SAS Institute Inc., USA. |
| 21 | Sihi D, Dari B, Sharma D K, Pathak H, Nain L, Sharma O P.2017. Evaluation of soil health in organic vs. conventional farming of basmati rice in North India.J Plant Nutr Soil Sci, 180: 389-406. |
| 22 | Shaon K D.2014. Role of micronutrient in rice cultivation and management strategy in organic agriculture: A reappraisal.Agric Sci, 5: 765-769. |
| 23 | Smogyi M.1952. Notes on sugar determination.J Biol Chem, 195(1): 19-23. |
| 24 | Sokei Y, Shinya Y, Kosaka M M, Inoue K M, Koimaru T.2011. NERICA Culture Guide. Cotonou, Benin: Rice Center for Africa, JICA: 43. |
| 25 | Thirze H.2016. Modelling Grain Surplus/Deficit in Cameroon for 2030. Master degree thesis INES 393. Lund University, Sweden: 59. |
| 26 | Tonfack L B, Bernadac A, Youmbi E, Mbouapouognigni V P, Ngueguim M, Akoa A.2009. Impact of organic and inorganic fertilizers on tomato vigour, yield and fruit composition under tropical andosol soil conditions.Fruits, 64: 167-177. |
| 27 | Tonfack L B, Youmbi E, Amougou A, Bernadac A.2013. Effect of organic/inorganic-cation balanced fertilizers on yield and temporal nutrient allocation of tomato fruits under andosol soil conditions in sub-Saharan Africa.Int J Agric Food Res, 2(2): 27-37. |
| 28 | van Ittersum M K, van Bussel L G J, Wolf J, Grassini P, van Wart J, Guilpart N, Claessens L, de Groot H, Wiebe K, Mason- D’Croz D, Yang H S, Boogaard H, van Oort P A J, van Loon M P, Saito K, Adimo O, Adjei-Nsiah S, Agali A, Bala A, Chikowo R, Kaizzi K, Kouressy M, Makoi J H J R, Ouattara K, Tesfaye K, Cassman K G.2016. Can sub-Saharan Africa feed itself?Proc Natl Acad Sci USA, 113(52): 14964-14969. |
| 29 | Yengoh G T, Ardö J.2014. Crop yield gaps in Cameroon.Ambio, 43(2): 175-190. |
| 30 | Wang Z H, Li S X, Malhi S.2008. Effects of fertilization and other agronomic measures on nutritional quality of crops.J Sci Food Agric, 88(1): 7-23. |
| 31 | Williams S W.1980. Official Methods of Analysis, Association of Official Analytical Chemists. Washington, AOAC: 5-9. |
| 32 | Zhou W, Lv T F, Chen Y, Westby A P, Ren W J.2014. Soil physicochemical and biological properties of paddy-upland rotation: A review.Sci World J, 2014: 1-8. |
| No related articles found! |
| 阅读次数 | ||||||
|
全文 |
|
|||||
|
摘要 |
|
|||||