
Rice Science ›› 2021, Vol. 28 ›› Issue (3): 209-211.DOI: 10.1016/j.rsci.2020.10.001
• • 下一篇
收稿日期:2020-05-02
接受日期:2020-10-09
出版日期:2021-05-28
发布日期:2021-05-28
. [J]. Rice Science, 2021, 28(3): 209-211.
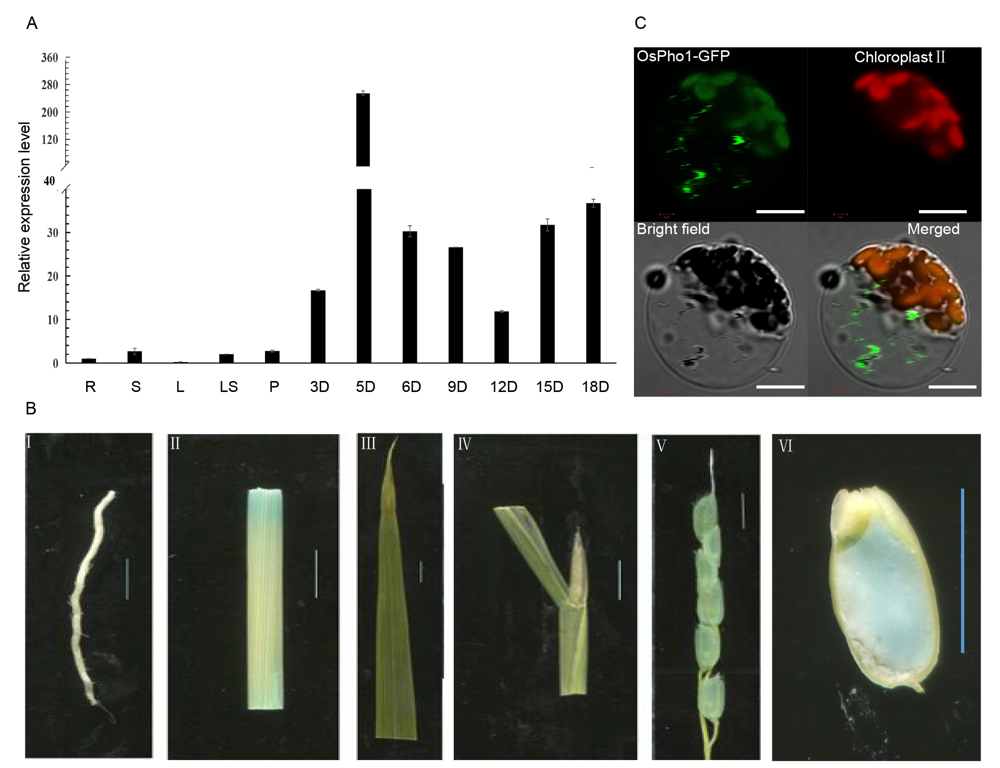
Fig. S1. Expression at different tissues (A), β-glucuronidase staining (B) and subcellular localization in rice protoplasts (C).R, Root; S, Stem; L, Leaf; LS, Leaf sheath; P, Panicle; 3D, 3 d after fertilization; 5D, 5 d after fertilization; 6D, 6 d after fertilization; 9D, 9 d after fertilization; 12D, 12 d after fertilization; 15D, 15 d after fertilization; 18D, 18 d after fertilization. mRNA expression levels at the root of the wild-type were set as the reference values of ubiquitin 1. Data are Mean ± SD (n = 3). In B, scale bars are 5 mm. (I) Root; (II) Stem; (III) Leaf; (IV) Leaf sheath; (V) Spikelet; (VI) Seed transection of 5 d after fertilization. In C, scale bars are 10 μm.
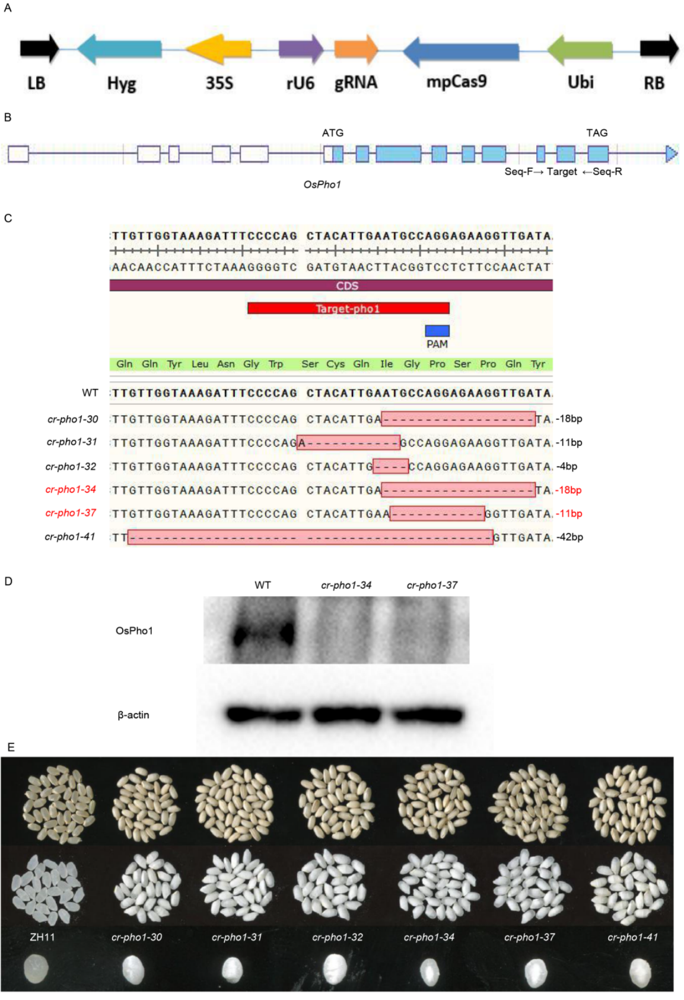
Fig. S2. Vector map of Cas9/guide RNA and clustered regularly interspaced short palindromic repeats-associated endonuclease 9 (CRISPR/Cas9)-mediated editing of OsPho1 and phenotype identification.A, Map of the VK005-01 Cas9/gRNA vector. LB, Left border; Hyg, Hygromycin; 35S, 35S promoter; rU6, Rice U6 promoter; gRNA, Guide RNA; mpCas9, Cas9 protein; ubi, Ubi promoter; RB, Right border; Seq-F and Seq-R, Primer pairs; PAM, Protospacer adjacent motif.B, Structure of OsPho1 gene and target site.C, Mutation forms of OsPho1 in T1 transgenic events. D, Western blot analysis OsPho1 protein in wild-type (WT), cr-pho1-34 and cr-pho1-37. β-actin is used as an internal reference.E, Different cr-pho1 mutation types all displayed a white-core chalky endosperm phenotypes.
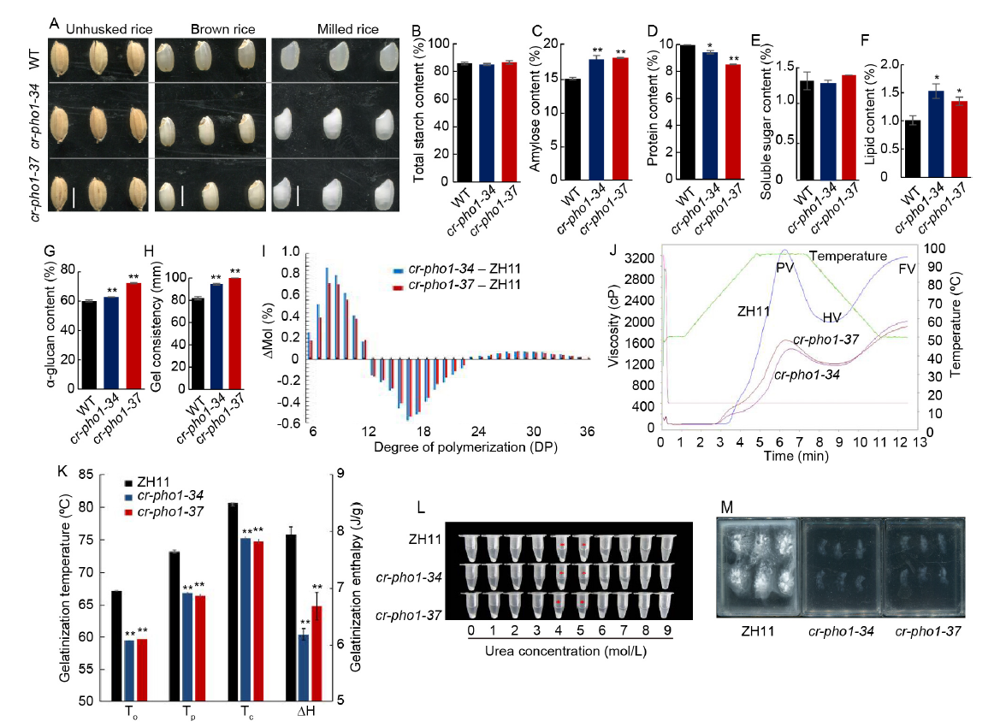
Fig. 1. Phenotype identification and physicochemical characteristics analyses of Zhonghua 11 (ZH11) and mutants in T1 generation. A, Appearance of unhusked rice, brown rice and milled rice for ZH11 and mutants. WT, Wild type. Scale bar is 0.5 cm. B-H, Total starch content, amylose content, total protein content, total soluble sugar content, total lipid content, α-glucan content and gel consistency for ZH11 and the mutants. I, Chain length distribution differences of amylopectin in ZH11 and mutants. J, Pasting properties of endosperm starches for ZH11 and mutants. PV, Peak viscosity; HV, Hold through viscosity; FV, Final viscosity. The viscosity value at each temperature is the average of three replicates. The green line indicates the temperature changes during the measurement. K, Thermal characteristics presented using modulated differential scanning calorimetry curves. To, Onset temperature; Tp, Peak temperature; Tc, Conclusion temperature; ∆H, Gelatinization enthalpy.L, Gelatinization characteristics of starch from mutant seeds using urea. M, Alkali spreading value of starch from mutant seeds in 1.7% KOH solution. Data are shown as Mean ± SD (n = 3). Asterisks indicate statistical significance as determined by the Student’s t-test (*, P < 0.05; **, P < 0.01).
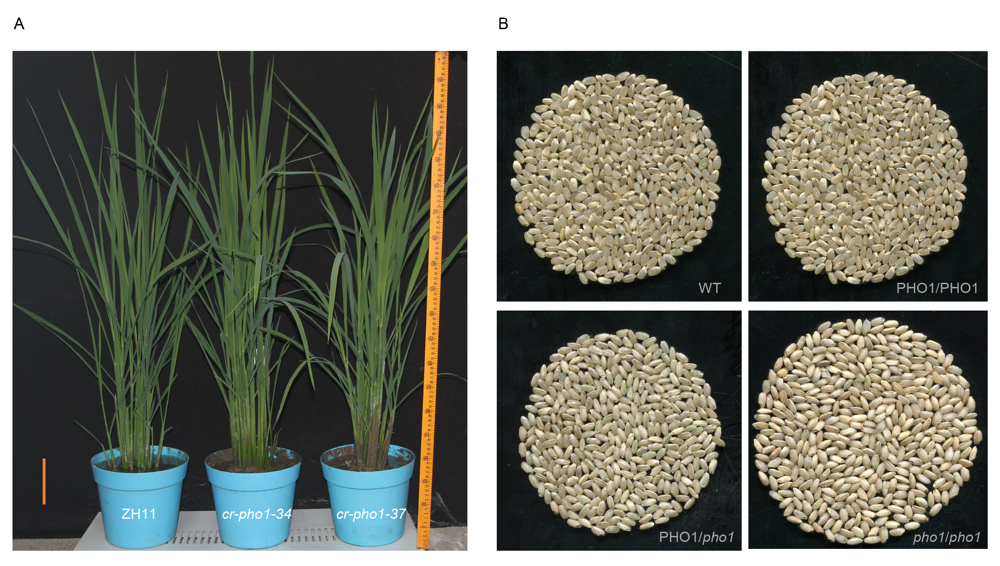
Fig. S3. Plant architecture pictures at booting stage and co-segregated genetic analysis.A, Plant architecture pictures at the booting stage. Scale bar is 10 cm.B, Co-segregated genetic analysis (brown rice from T1 plants).
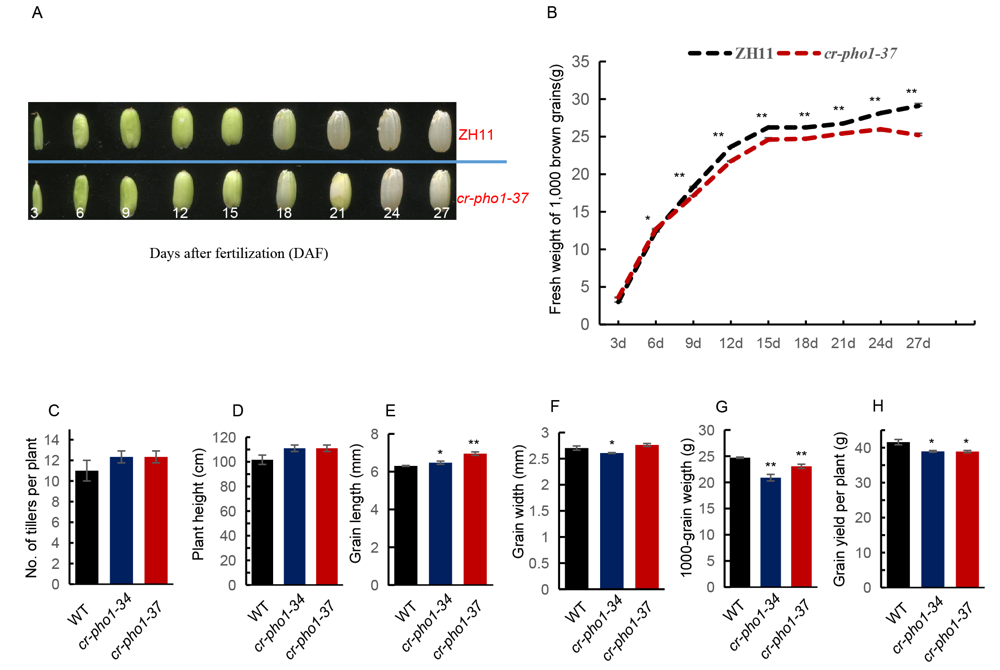
Fig. S4. Phenotype identification of the ZH11 and mutants in the T1 generation. A, Grain filling from 3 d to 27 d for ZH11 and cr-pho1-37. B, Grain filling rates for ZH11 and cr-pho1-37. C, No. of tillers per plant of ZH11 and mutants. D, Plant heights of ZH11 and mutants. E, Grain lengths of ZH11 and mutants. F, Grain widths of ZH11 and mutants. G, 1000-grain weights of ZH11 and mutants. H, Grain yields per plant of ZH11 and mutants. Values in E-G are Mean ± SD from three biological replicates, with no less than 50, 50 and 200 seeds in each replication and no less than 10 plants for C, D and H. Asterisks indicate statistical significance according to Student’s t-test (*, P < 0.05; **, P < 0.01).

Fig. S5. Scanning and transmission electron microscopy images of ZH11 and mutants in T1 generation. A-I, Scanning electron microscopy (SEM) analysis of mature endosperm of the wild-type and mutants at different positions. J-L, Amyloplast in endosperm cells of wild-type and mutants at 9 d after fertilization visualized by transmission electron microscopy analysis. Scale bars are 0.5 mm in A-C, 5 μm in D-I, and 1 μm in J-L.
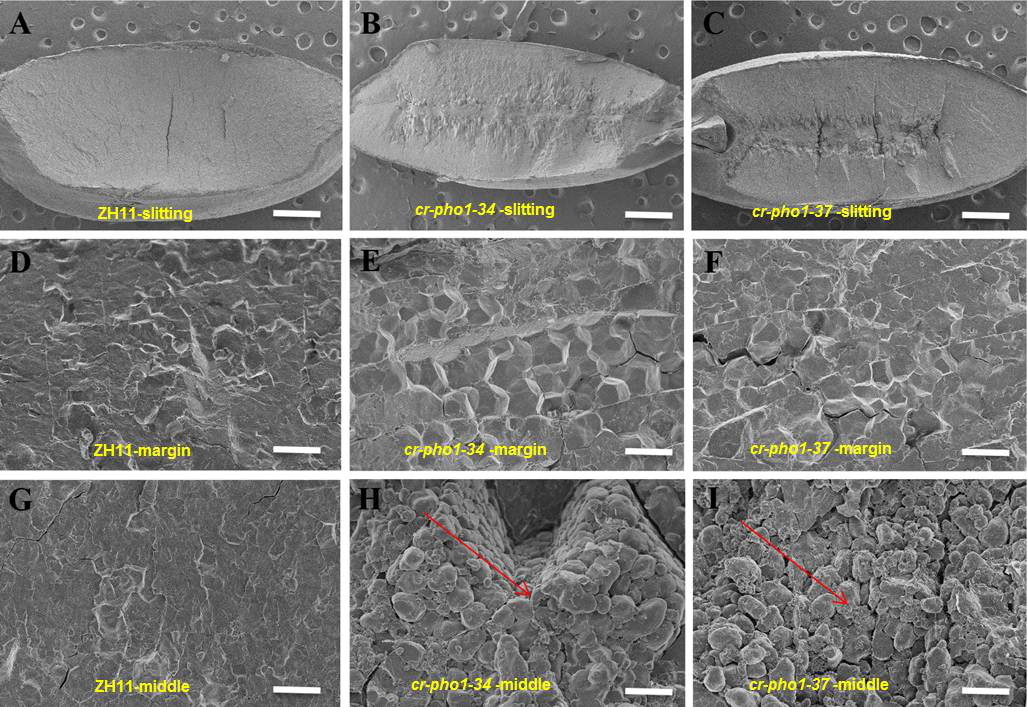
Fig. S6. Scanning electron microscope slitting observation of wild-type and mutants.A-I, Scanning electron microscopy (SEM) analysis of mature endosperm of ZH11 and mutants (cr-pho1-34 and cr-pho1-37) at different positions. Scale bars are 0.5 mm in slittering pictures (A-C), 5 μm in margin (D-F) and middle position pictures (G-I). The arrows represent abnormal rice starch granules in mutants.

Fig. S7. Relative expression level of starch synthesis related genes.
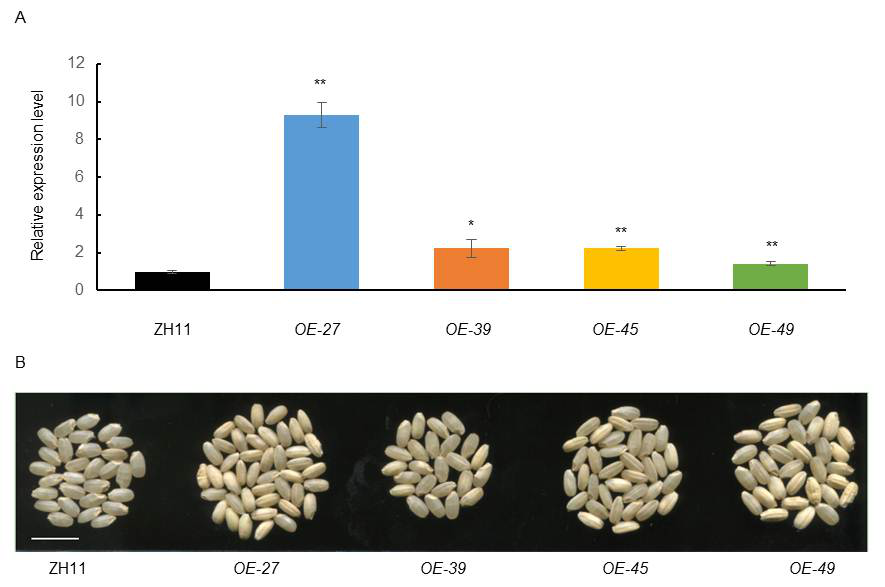
Fig. S8. qRT-PCR analysis and brown rice phenotype of overexpression transgenic lines.A, Expression level of OsPho1 in ZH11 was set as reference value of 1. Data are Mean ± SD (n = 3). Asterisks indicate the statistical significance between ZH11 and the OE-pho1 transgenic lines as determined by the Student’s t-test at the 0.01 level. B, Brown rice of overexpression transgenic lines. Scale bar is 1 cm in B.
| Primer name | Forward (5′-3′) | Reverse (5′-3′) |
|---|---|---|
| Target | CAGCCCCAGCTACATTGAATGCC | AACGGCATTCAATGTAGCTGGGG |
| Seq | TTGGTGCTGAGGCACATGAAATTGCT | GCCTGAAGTGAATGGCCAGCTATGTA |
| Hyg | GCTGTTATGCGGCCATTGTC | GACGTCTGTCGAGAAGTTTC |
| Sq-primer | CTCCTTCCTTCCGTCCACTTCATC | |
| GUS | CCATGATTACGAATTCAGCTCTCACTAATGCCGTTG | CTCAGATCTACCATGGCTGGTGGAACACTGAACACA |
| Overexpression | TTACTTCTGCACTAGGTACCATGAATGACACTCACC CAAC | TGGCTAGCGTTAACACTAGTCTAGGGCAGGATGACAG GCTTGA |
| Ubiquitin | GCTCCGTGGCGGTATCAT | CGGCAGTTGACAGCCCTAG |
| pho1 | TTGGCAGGAAGGTTTCGCT | TTGGCAGGAAGGTTTCGCT |
| GIF2 | AAGAGGTGCTTTGGTGATG | AAGAGGTGCTTTGGTGATG |
| OsAGPS1 | GTGCCACTTAAAGGCACCATT | CCCACATTTCAGACACGGTTT |
| OsAGPS2a | ACTCCAAGAGCTCGCAGACC | GCCTGTAGTTGGCACCCAGA |
| OsAGPS2b | AACAATCGAAGCGCGAGAAA | GCCTGTAGTTGGCACCCAGA |
| OsAGPL1 | GGAAGACGGATGATCGAGAAAG | CACATGAGATGCACCAACGA |
| OsAGPL3 | AAGCCAGCCATGACCATTTG | CACACGGTAGATTCACGAGACAA |
| OsAGPL4 | TCAACGTCGATGCAGCAAAT | ATCCCTCAGTTCCTAGCCTCATT |
| OsSSI | GGGCCTTCATGGATCAACC | CCGCTTCAAGCATCCTCATC |
| OsSSIIa | GCTTCCGGTTTGTGTGTTCA | CTTAATACTCCCTCAACTCCACCAT |
| OsGBSSI | AACGTGGCTGCTCCTTGAA | TTGGCAATAAGCCACACACA |
| OsBEI | TGGCCATGGAAGAGTTGGC | CAGAAGCAACTGCTCCACC |
| OsBEIIb | ATGCTAGAGTTTGACCGC | AGTGTGATGGATCCTGCC |
| OsIAS1 | TGCTCAGCTACTCCTCCATCATC | AGGACCGCACAACTTCAACATA |
| OsIAS2 | TAGAGGTCCTCTTGGAGG | AATCAGCTTCTGAGTCACCG |
| OsIAS3 | ACAGCTTGAGACACTGGGTTGAG | GCATCAAGAGGACAACCATCTG |
| OsPUL | ACCTTTCTTCCATGCTGG | CAAAGGTCTGAAAGATGGG |
| OsBT1 | GGCATCTCCTTCATGTGCTA | CGCAACCTTCTCCTTGATCT |
| OsPK2 | CATGAGGAACTGGAACTTAAA | GACGAAAACGGCATCTAC |
Table S1. Primers used in this study.
| Primer name | Forward (5′-3′) | Reverse (5′-3′) |
|---|---|---|
| Target | CAGCCCCAGCTACATTGAATGCC | AACGGCATTCAATGTAGCTGGGG |
| Seq | TTGGTGCTGAGGCACATGAAATTGCT | GCCTGAAGTGAATGGCCAGCTATGTA |
| Hyg | GCTGTTATGCGGCCATTGTC | GACGTCTGTCGAGAAGTTTC |
| Sq-primer | CTCCTTCCTTCCGTCCACTTCATC | |
| GUS | CCATGATTACGAATTCAGCTCTCACTAATGCCGTTG | CTCAGATCTACCATGGCTGGTGGAACACTGAACACA |
| Overexpression | TTACTTCTGCACTAGGTACCATGAATGACACTCACC CAAC | TGGCTAGCGTTAACACTAGTCTAGGGCAGGATGACAG GCTTGA |
| Ubiquitin | GCTCCGTGGCGGTATCAT | CGGCAGTTGACAGCCCTAG |
| pho1 | TTGGCAGGAAGGTTTCGCT | TTGGCAGGAAGGTTTCGCT |
| GIF2 | AAGAGGTGCTTTGGTGATG | AAGAGGTGCTTTGGTGATG |
| OsAGPS1 | GTGCCACTTAAAGGCACCATT | CCCACATTTCAGACACGGTTT |
| OsAGPS2a | ACTCCAAGAGCTCGCAGACC | GCCTGTAGTTGGCACCCAGA |
| OsAGPS2b | AACAATCGAAGCGCGAGAAA | GCCTGTAGTTGGCACCCAGA |
| OsAGPL1 | GGAAGACGGATGATCGAGAAAG | CACATGAGATGCACCAACGA |
| OsAGPL3 | AAGCCAGCCATGACCATTTG | CACACGGTAGATTCACGAGACAA |
| OsAGPL4 | TCAACGTCGATGCAGCAAAT | ATCCCTCAGTTCCTAGCCTCATT |
| OsSSI | GGGCCTTCATGGATCAACC | CCGCTTCAAGCATCCTCATC |
| OsSSIIa | GCTTCCGGTTTGTGTGTTCA | CTTAATACTCCCTCAACTCCACCAT |
| OsGBSSI | AACGTGGCTGCTCCTTGAA | TTGGCAATAAGCCACACACA |
| OsBEI | TGGCCATGGAAGAGTTGGC | CAGAAGCAACTGCTCCACC |
| OsBEIIb | ATGCTAGAGTTTGACCGC | AGTGTGATGGATCCTGCC |
| OsIAS1 | TGCTCAGCTACTCCTCCATCATC | AGGACCGCACAACTTCAACATA |
| OsIAS2 | TAGAGGTCCTCTTGGAGG | AATCAGCTTCTGAGTCACCG |
| OsIAS3 | ACAGCTTGAGACACTGGGTTGAG | GCATCAAGAGGACAACCATCTG |
| OsPUL | ACCTTTCTTCCATGCTGG | CAAAGGTCTGAAAGATGGG |
| OsBT1 | GGCATCTCCTTCATGTGCTA | CGCAACCTTCTCCTTGATCT |
| OsPK2 | CATGAGGAACTGGAACTTAAA | GACGAAAACGGCATCTAC |
| [1] | Fettke J, Albrecht T, Hejazi M, Mahlow S, Nakamura Y, Steup M. 2010. Glucose 1-phosphate is efficiently taken up by potato ( Solanum tuberosum) tuber parenchyma cells and converted to reserve starch granules. New Phytol, 185(3): 663-675. |
| [2] | Du Y M, Pan T, Tian Y L, Liu S J, Liu X, Jiang L, Zhang W W, Wang Y H, Wan J M. 2019. Phenotypic analysis and gene cloning of rice floury endosperm mutant fse4. Chin J Rice Sci, 33(6): 499-512. (in Chinese with English abstract) |
| [3] | Hwang S K, Koper K, Satoh H, Okita T W. 2016. Rice endosperm starch phosphorylase (Pho1) assembles with disproportionating enzyme (Dpe1) to form a protein complex that enhances synthesis of malto-oligosaccharides. J Biol Chem, 291: 19994-20007. |
| [4] | Satoh H, Shibahara K, Tokunaga T, Nishi A, Tasaki M, Hwang S K, Okita T W, Kaneko N, Fujita N, Yoshida M, Hosaka Y, Sato A, Utsumi Y, Ohdan T, Nakamura Y. 2008. Mutation of the plastidial alpha-glucan phosphorylase gene in rice affects the synthesis and structure of starch in the endosperm. Plant Cell, 20(7): 1833-1849. |
| [5] | Thompson D B. 2000. On the non-random nature of amylopectin branching. Carbohyd Polym, 43(3): 223-239. |
| No related articles found! |
| 阅读次数 | ||||||
|
全文 |
|
|||||
|
摘要 |
|
|||||
