
Rice Science ›› 2021, Vol. 28 ›› Issue (3): 212-216.DOI: 10.1016/j.rsci.2021.04.001
收稿日期:2020-04-28
接受日期:2020-10-14
出版日期:2021-05-28
发布日期:2021-05-28
. [J]. Rice Science, 2021, 28(3): 212-216.
| Country/ Method | Hub/Site | Harvesting | Threshing | Drying | Parboiling | Milling | ||||||
|---|---|---|---|---|---|---|---|---|---|---|---|---|
| Yield (t/hm2) | Shattering loss (%) | Stacking loss (%) | Paddy re-threshed | Scattered grains | Washing | Steaming | Drying | Grains dropped (%) | Grains in husk or bran (%) | |||
| Cameroon | Ndop | 6.9 (3.7)a | 3.17 (2.9)b | 4.3 (2.2)b | 2.2 (1.4)a | 2.2 (1.3)a | 0.54 (0.5)b | 0.07 (0.0)b | 0.04 (0.0)b | 0.18 (0.5)b | 3.32 (2.3)b | 0.65 (0.8)c |
| Côte d’Ivoire | Gagnoa | 4.8 (2.7)b | 1.56 (1.3)c | 11.2 (3.4)a | 0.01 (0.0)c | |||||||
| Madagascar | Ambohibary | 0.51 (0.3)c | 0.52 (0.4)d | 1.0 (1.4)ab | 0.2 (0.1)b | 0.44 (0.3)b | 0.10 (0)c | 0.0 (0)d | ||||
| Mandrosohasina | 0.31 (0.4)c | 0.64 (0.7)d | 0.6 (0.1)c | 0.3 (0.1)b | 0.35 (0.2)b | |||||||
| Mali | Kouroumari | 10.9 (5.4)a | 0.0 (0)d | |||||||||
| Sikasso | 2.2 (1.8)c | 6.03 (4.5)a | 4.1 (2.1)b | |||||||||
| Nigeria | Nasarawa | 0.79 (0.1)a | 0.98 (0.1)a | 0.90 (0.1)a | 0.60 (0.1)a | 6.60 (4.9)a | 3.60 (2.7)a | |||||
| Uganda | Northern | 4.3 (1.3)b | 0.66 (0.3)c | 2.2 (2.1)cd | 0.8 (1.7)ab | 0.4 (0.4)b | 2.57 (1.2)b | 1.15 (0.8)b | ||||
| Western | 5.2 (1.1)b | 0.80 (0.4)c | 3.6 (1.7)bc | 0.8 (0.9)bc | 0.5 (0.9)b | 3.80 (2.9)b | 0.94 (0.8)c | |||||
| Methods | Traditional | 4.1 (3.1) | 2.8 (3.7)* | 4.2 (4.0)* | 1.9 (1.3)* | 1.6 (1.3)* | 0.48 (0.4) | 1.54 (0.6)* | 1.32 (0.4)* | 1.10 (0.4)* | 7.70 (5.0)* | 3.56 (2.3)* |
| Improved | 5.3 (2.1)* | - | - | 0.08 (0.0) | 0.03 (0.0) | 0.01 (0.0) | 0.01 (0.0) | 0.01 (0.0) | 1.41 (2.1) | 0.93 (1.7) | ||
| Mean | 4.8 (3.4) | 2.8 (3.7) | 4.2 (4.0) | 1.4 (1.4) | 1.2 (1.1) | 0.48 (0.4) | 0.78 (0.8) | 0.71 (0.6) | 0.54 (0.6) | 4.94 (3.2) | 3.50 (2.2) | |
Table S1. Mean percent yield and losses during different progress at different sites in Africa.
| Country/ Method | Hub/Site | Harvesting | Threshing | Drying | Parboiling | Milling | ||||||
|---|---|---|---|---|---|---|---|---|---|---|---|---|
| Yield (t/hm2) | Shattering loss (%) | Stacking loss (%) | Paddy re-threshed | Scattered grains | Washing | Steaming | Drying | Grains dropped (%) | Grains in husk or bran (%) | |||
| Cameroon | Ndop | 6.9 (3.7)a | 3.17 (2.9)b | 4.3 (2.2)b | 2.2 (1.4)a | 2.2 (1.3)a | 0.54 (0.5)b | 0.07 (0.0)b | 0.04 (0.0)b | 0.18 (0.5)b | 3.32 (2.3)b | 0.65 (0.8)c |
| Côte d’Ivoire | Gagnoa | 4.8 (2.7)b | 1.56 (1.3)c | 11.2 (3.4)a | 0.01 (0.0)c | |||||||
| Madagascar | Ambohibary | 0.51 (0.3)c | 0.52 (0.4)d | 1.0 (1.4)ab | 0.2 (0.1)b | 0.44 (0.3)b | 0.10 (0)c | 0.0 (0)d | ||||
| Mandrosohasina | 0.31 (0.4)c | 0.64 (0.7)d | 0.6 (0.1)c | 0.3 (0.1)b | 0.35 (0.2)b | |||||||
| Mali | Kouroumari | 10.9 (5.4)a | 0.0 (0)d | |||||||||
| Sikasso | 2.2 (1.8)c | 6.03 (4.5)a | 4.1 (2.1)b | |||||||||
| Nigeria | Nasarawa | 0.79 (0.1)a | 0.98 (0.1)a | 0.90 (0.1)a | 0.60 (0.1)a | 6.60 (4.9)a | 3.60 (2.7)a | |||||
| Uganda | Northern | 4.3 (1.3)b | 0.66 (0.3)c | 2.2 (2.1)cd | 0.8 (1.7)ab | 0.4 (0.4)b | 2.57 (1.2)b | 1.15 (0.8)b | ||||
| Western | 5.2 (1.1)b | 0.80 (0.4)c | 3.6 (1.7)bc | 0.8 (0.9)bc | 0.5 (0.9)b | 3.80 (2.9)b | 0.94 (0.8)c | |||||
| Methods | Traditional | 4.1 (3.1) | 2.8 (3.7)* | 4.2 (4.0)* | 1.9 (1.3)* | 1.6 (1.3)* | 0.48 (0.4) | 1.54 (0.6)* | 1.32 (0.4)* | 1.10 (0.4)* | 7.70 (5.0)* | 3.56 (2.3)* |
| Improved | 5.3 (2.1)* | - | - | 0.08 (0.0) | 0.03 (0.0) | 0.01 (0.0) | 0.01 (0.0) | 0.01 (0.0) | 1.41 (2.1) | 0.93 (1.7) | ||
| Mean | 4.8 (3.4) | 2.8 (3.7) | 4.2 (4.0) | 1.4 (1.4) | 1.2 (1.1) | 0.48 (0.4) | 0.78 (0.8) | 0.71 (0.6) | 0.54 (0.6) | 4.94 (3.2) | 3.50 (2.2) | |
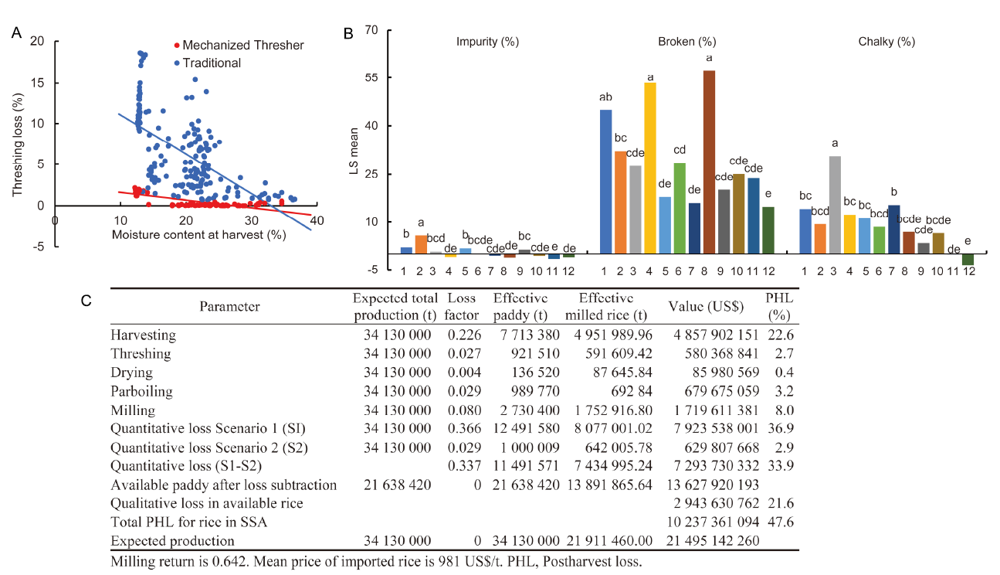
Fig. 1. Grain losses during different stages in countries of Sub-Saharan Africa (SSA).A, Regression of threshing loss by grain moisture content of paddy threshed by farmers (R² = 0.579). Traditional is manual threshing by beating panicle on a log of wood and mechanical threshing using motorized thresher such as the ASI-thresher. B, Proportion of impurities, broken rice and chalky grains in rice from different sites across Africa. Different lowercase letters within each quality attribute (impurity, broken and chalky grain) indicate significant difference at the 0.05 level. Numbers 1 to 12 indicate Mali/Sikasso, Senegal/Dagana, Nigeria/Kano, Niger/Tillaberi, Benin/Glazoue, Uganda/Northern, Cameroon/Ndop, Cote d’Ivoire/Gagnoa, Ghana/Narvrongo, Gambia/West Coast Region, Tanzania/Kahama/Kilombero and Sierra Leone/Manbolo, respectively.C, Quantitative and qualitative rice postharvest loss from harvesting to milling in Sub-Sahara Africa in 2018.
| Harvesting time | Threshing method | Drying method | |||||||
|---|---|---|---|---|---|---|---|---|---|
| Impurities | Head rice | Impurities | Head rice | Impurities | Head rice | ||||
| Source | Intercept | 0.41 (0.06) *** | 49.2 (2.2) *** | 0.245 (0.1) * | 56.5 (2.4) *** | 0.38 (0.2) * | 52.18 (2.7) *** | ||
| OHT | -0.06 (0.08) | 8.5 (2.6) ** | 1.3 (0.1) *** | -5.0 (2.9) | 1.7 (0.2) *** | -13.3 (3.3) *** | |||
| FHT | - | - | - | - | - | - | |||
| Variety | NERICA-L-19 | 0.047 (0.08) | 18.4 (2.7) *** | -0.004 (0.1) | 14.1 (3.0) *** | 0.042 (0.2) | 26.3 (3.4) *** | ||
| TOX3145 | - | - | - | - | - | - | |||
| Goodness of fit (Adjusted R2) | 0.23 | 0.47 | 0.48 | 0.57 | 0.35 | 0.57 | |||
Table S2. Effect of variety, harvesting, threshing and drying method on proportion of impurities and head rice. %
| Harvesting time | Threshing method | Drying method | |||||||
|---|---|---|---|---|---|---|---|---|---|
| Impurities | Head rice | Impurities | Head rice | Impurities | Head rice | ||||
| Source | Intercept | 0.41 (0.06) *** | 49.2 (2.2) *** | 0.245 (0.1) * | 56.5 (2.4) *** | 0.38 (0.2) * | 52.18 (2.7) *** | ||
| OHT | -0.06 (0.08) | 8.5 (2.6) ** | 1.3 (0.1) *** | -5.0 (2.9) | 1.7 (0.2) *** | -13.3 (3.3) *** | |||
| FHT | - | - | - | - | - | - | |||
| Variety | NERICA-L-19 | 0.047 (0.08) | 18.4 (2.7) *** | -0.004 (0.1) | 14.1 (3.0) *** | 0.042 (0.2) | 26.3 (3.4) *** | ||
| TOX3145 | - | - | - | - | - | - | |||
| Goodness of fit (Adjusted R2) | 0.23 | 0.47 | 0.48 | 0.57 | 0.35 | 0.57 | |||
| Source | Price (US$ per kg) |
|---|---|
| Intercept | 0.835 (0.03) *** |
| Distance from nearest market | -0.4 × 10⁻³ (0.0) |
| Broken rice (%) | -1.3 × 10⁻³ (0.0) ** |
| Chalkiness (%) | -1.5 × 10⁻³ (0.0) * |
| Impurities (%) | -0.8 × 10⁻³ (0.0) |
| Site-Manbolo (Sierra Leone) | -0.205 (0.02) *** |
| Site-Kahama & Kilombero (Tanzania) | -0.256 (0.03) *** |
| Site-Northern hub (Uganda) | - |
| Member of Association-No | 0.007 (0.03) |
| Member of Association-Yes | - |
| Goodness of fit (Adjusted R2) | 0.68 |
Table S3. Effects of grain quality on price of rice at milling sites (b) rice processing type and origin on postharvest loss.
| Source | Price (US$ per kg) |
|---|---|
| Intercept | 0.835 (0.03) *** |
| Distance from nearest market | -0.4 × 10⁻³ (0.0) |
| Broken rice (%) | -1.3 × 10⁻³ (0.0) ** |
| Chalkiness (%) | -1.5 × 10⁻³ (0.0) * |
| Impurities (%) | -0.8 × 10⁻³ (0.0) |
| Site-Manbolo (Sierra Leone) | -0.205 (0.02) *** |
| Site-Kahama & Kilombero (Tanzania) | -0.256 (0.03) *** |
| Site-Northern hub (Uganda) | - |
| Member of Association-No | 0.007 (0.03) |
| Member of Association-Yes | - |
| Goodness of fit (Adjusted R2) | 0.68 |
| Type of processing and origin | Predicted price (US$/kg) a | Lower bound (95%) | Upper bound (95%) | Loss in value with respect to imported rice (%) |
|---|---|---|---|---|
| White milled and Imported | 1.077 (0.02) a | 1.040 | 1.114 | - |
| Parboiled milled and Imported | 0.986 (0.03) b | 0.932 | 1.039 | - |
| White milled and Domestic | 0.844 (0.11) bc | 0.624 | 1.065 | 21.6 |
| Parboiled milled and Domestic | 0.817 (0.03) d | 0.760 | 0.873 | 17.1 |
Table S4. Effects of rice processing type and origin on postharvest loss.
| Type of processing and origin | Predicted price (US$/kg) a | Lower bound (95%) | Upper bound (95%) | Loss in value with respect to imported rice (%) |
|---|---|---|---|---|
| White milled and Imported | 1.077 (0.02) a | 1.040 | 1.114 | - |
| Parboiled milled and Imported | 0.986 (0.03) b | 0.932 | 1.039 | - |
| White milled and Domestic | 0.844 (0.11) bc | 0.624 | 1.065 | 21.6 |
| Parboiled milled and Domestic | 0.817 (0.03) d | 0.760 | 0.873 | 17.1 |
| Country/ Method | Hub/zone | Harvesting | Threshing | Drying | Parboiling | Milling | ||||||
|---|---|---|---|---|---|---|---|---|---|---|---|---|
| Yield | Shattering | Stacking | Paddy re-threshed panicle | Scattered paddy | Grain left in drying area | Washing | Steaming | Drying | Grain dropped | Grain in husk or bran | ||
| Cameroon | Ndop | 120 | 60 | 60 | 60 | 60 | 60 | 16 | 16 | 16 | 12 | 12 |
| Côte d’Ivoire | Gagnoa | 48 | 24 | 24 | 24 | |||||||
| Madagascar | Ambohibary | 18 | 18 | 9 | 9 | 17 | 6 | 6 | ||||
| Mandrosohasina | 12 | 12 | 6 | 6 | 12 | |||||||
| Mali | Kouroumari | 9 | 9 | |||||||||
| Sikasso | 120 | 60 | 57 | |||||||||
| Nigeria | Nasarawa | 30 | 90 | 90 | 90 | 36 | 36 | |||||
| Uganda | Northern | 30 | 30 | 25 | 24 | 24 | 9 | 9 | ||||
| Western | 27 | 29 | 29 | 51 | 51 | 8 | 8 | |||||
| Method | Traditional | 201 | 135 | 135 | 105 | 105 | 143 | 53 | 53 | 53 | 35 | 35 |
| Improved | 144 | 98 | 98 | 45 | 45 | 0 | 53 | 53 | 53 | 45 | 45 | |
| Site | 5 | 7 | 7 | 5 | 5 | 5 | 2 | 2 | 2 | 6 | 6 | |
| Sample size | 345 | 233 | 233 | 150 | 150 | 143 | 106 | 106 | 106 | 80 | 80 | |
Table S5. Sites and number of actors selected per value chain segment for the determination of quantitative loss in rice in Africa.
| Country/ Method | Hub/zone | Harvesting | Threshing | Drying | Parboiling | Milling | ||||||
|---|---|---|---|---|---|---|---|---|---|---|---|---|
| Yield | Shattering | Stacking | Paddy re-threshed panicle | Scattered paddy | Grain left in drying area | Washing | Steaming | Drying | Grain dropped | Grain in husk or bran | ||
| Cameroon | Ndop | 120 | 60 | 60 | 60 | 60 | 60 | 16 | 16 | 16 | 12 | 12 |
| Côte d’Ivoire | Gagnoa | 48 | 24 | 24 | 24 | |||||||
| Madagascar | Ambohibary | 18 | 18 | 9 | 9 | 17 | 6 | 6 | ||||
| Mandrosohasina | 12 | 12 | 6 | 6 | 12 | |||||||
| Mali | Kouroumari | 9 | 9 | |||||||||
| Sikasso | 120 | 60 | 57 | |||||||||
| Nigeria | Nasarawa | 30 | 90 | 90 | 90 | 36 | 36 | |||||
| Uganda | Northern | 30 | 30 | 25 | 24 | 24 | 9 | 9 | ||||
| Western | 27 | 29 | 29 | 51 | 51 | 8 | 8 | |||||
| Method | Traditional | 201 | 135 | 135 | 105 | 105 | 143 | 53 | 53 | 53 | 35 | 35 |
| Improved | 144 | 98 | 98 | 45 | 45 | 0 | 53 | 53 | 53 | 45 | 45 | |
| Site | 5 | 7 | 7 | 5 | 5 | 5 | 2 | 2 | 2 | 6 | 6 | |
| Sample size | 345 | 233 | 233 | 150 | 150 | 143 | 106 | 106 | 106 | 80 | 80 | |
| [1] | African Development Bank. 2016. Feed Africa: Strategy for Agricultural Transformation in Africa 2016-2025. Abidjan, Côte d’Ivoire: 30. |
| [2] | Africa Rice Center. 2018. Continental Investment Plan for accelerating Rice Self-Sufficiency in Africa (CIPRiSSA). Abidjan, Côte d’Ivoire: 204. |
| [3] | Africa Rice Center. 2019. Annual Report 2019: Toward rice-based food systems transformation in Africa. Abidjan, Côte d’Ivoire: Africa Rice Center: 28. |
| [4] | Akoa-Etoa J M, Ndindeng S A, Owusu E S, Woin N, Bindzi B, Demont M, Bulte E. 2016. Consumer valuation of an improved rice parboiling technology: Experimental evidence from Cameroon. Afric J Agric Res Econom, 11(1): 8-21. |
| [5] | Bourne M C. 2014. Food security: Postharvest losses. Encycl Agric Food Syst, 44: 338-351. |
| [6] | Eyenga E F, Tang E N, Achu M B L, Boulanger R, Mbacham W F, Ndindeng S A. 2020. Physical, nutritional and sensory quality of rice-based biscuits fortified with Safou ( Dacryodes edulis) fruit powder. Food Sci Nutr, 8(7): 3413-3424. |
| [7] | Futakuchi K, Manful J, Sakurai T. 2013. Improving grain quality of locally produced rice. In: Wopereis M C, Johnson D E, Ahmadi N, Tollens E, Jalloh A. Realizing Africa’s Rice Promise. Boston, USA: CAB International: 311-323. |
| [8] | Grolleaud M. 1997. Postharvest losses: Discovering the full story. Rome: FAO. |
| [9] | International Rice Research Institute (IRRI). 2020. World Statistics Online Query Facility. . |
| [10] | Mapiemfu D L, Ndindeng S A, Ambang Z, Tang E N, Ngome F, Johnson J M, Tanaka A, Saito K. 2017. Physical rice quality attributes as affected by biophysical factors and pre-harvest practices. Int J Plant Prod, 11(4): 561-576. |
| [11] | Minten B, Tamru S, Reardon T. 2020. Postharvest losses in rural-urban value chains: Evidence from Ethiopia. Food Policy, 101860. |
| [12] | Migo-Sumagang M V P, Van Hung N, Detras M C M, Alfafara C G, Borines M G, Capunitan J A, Gummert M. 2020. Optimization of a downdraft furnace for rice straw-based heat generation. Renew Energy, 148: 953-963. |
| [13] | Ndindeng S A, Manful J T, Futakuchi K, Mapiemfu D L, Akoa- Etoa J M, Bigoga J, Tang E N, Graham-Acquaah S, Moreira J. 2015a. A novel artisanal parboiling technology for rice processors in Sub-Saharan Africa. Food Sci Nutr, 3(6): 557-568. |
| [14] | Ndindeng S A, Mbassi J E G, Mbacham W F, Manful J, Graham- Acquaah S, Moreira J, Dossou J, Futakuchi K. 2015b. Quality optimization in briquettes made from rice milling by-products. Energy Sustain Dev, 29: 24-31. |
| [15] | Ndindeng S A, Wopereis M, Sanyang S, Futakuchi F. 2019. Evaluation of fan-assisted rice husk fuelled gasifier cookstoves for application in Sub-Sahara Africa. Renew Energy, 139: 924-935. |
| [16] | Prusky D. 2011. Reduction of the incidence of postharvest quality losses, and future prospects. Food Secur, 3(4): 463-474. |
| [17] | Tanaka A, Diagne M, Saito K. 2015. Causes of yield stagnation in irrigated lowland rice systems in the Senegal River valley: Application of dichotomous decision tree analysis. Field Crops Res, 176: 99-107. |
| [18] | Yong H, Bao Y, Liu X, Algader A H. 1997. Grain postproduction practices and loss estimates in South China. Agric Mechan Asia, Latin Amer, 28: 37-40. |
| [19] | Zhou L J, Chen L M, Jiang L, Zhang W W, Liu L L, Liu X, Zhao Z G, Liu S J, Zhang L J, Wang J K, Wan J M. 2009. Fine mapping of the grain chalkiness QTL qPGWC-7 in rice(Oryza sativa L.). Theor Appl Genet, 118(3): 581-590. |
| [20] | Zohoun E V, Tang E N, Soumanou M M, Manful J, Akissoe N H, Bigoga J, Futakuchi K, Ndindeng S A. 2018a. Physicochemical and nutritional properties of rice as affected by parboiling steaming time at atmospheric pressure and variety. Food Sci Nutr, 6(3): 638-652. |
| [21] | Zohoun E V, Ndindeng S A, Soumanou M M, Tang E N, Bigoga J, Manful J, Sanyang S, Akissoe N H, Futakuchi K. 2018b. Appropriate parboiling steaming time at atmospheric pressure and variety to produce rice with weak digestive properties. Food Sci Nutr, 6(4): 757-764. |
| No related articles found! |
| 阅读次数 | ||||||
|
全文 |
|
|||||
|
摘要 |
|
|||||
