
Rice Science ›› 2021, Vol. 28 ›› Issue (3): 268-278.DOI: 10.1016/j.rsci.2021.04.006
收稿日期:2020-03-10
接受日期:2020-10-12
出版日期:2021-05-28
发布日期:2021-05-28
. [J]. Rice Science, 2021, 28(3): 268-278.
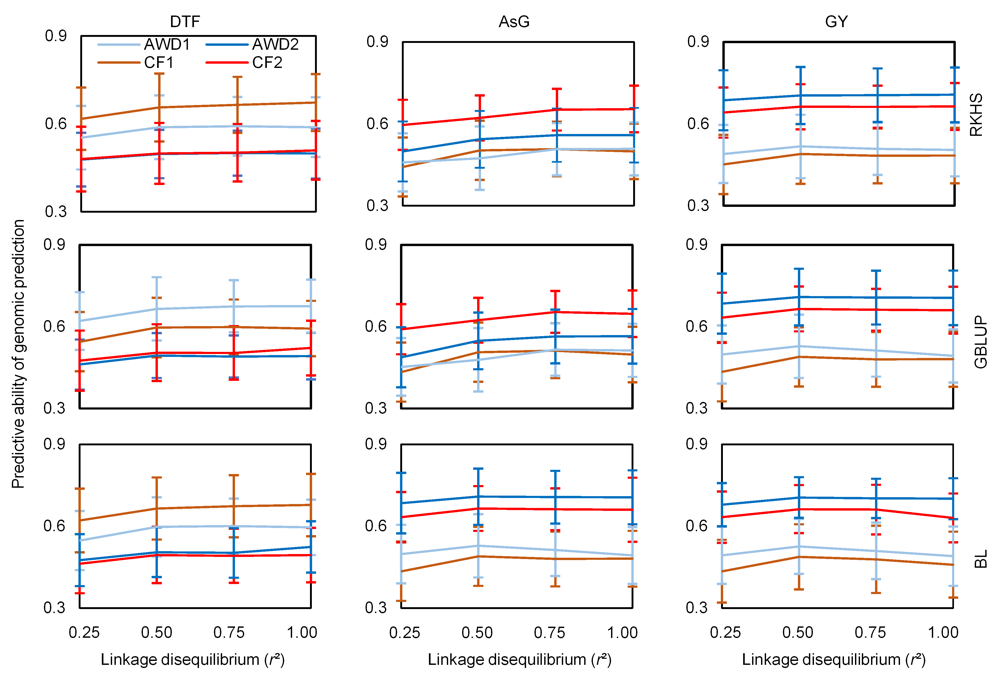
Fig. 1. Predictive ability of genomic prediction in cross validation experiments for arsenic content in grains (AsG), grain yield (GY) and days to flowering (DTF) observed under alternate watering and drying (AWD) and continued flooding (CF) irrigation systems over two years. BL, Bayesian Lasso; GBLUP, Genomic best linear unbiased prediction; RKHS, Reproducing kernel Hilbert spaces.Data are presented as Mean ± SD (n = 100).
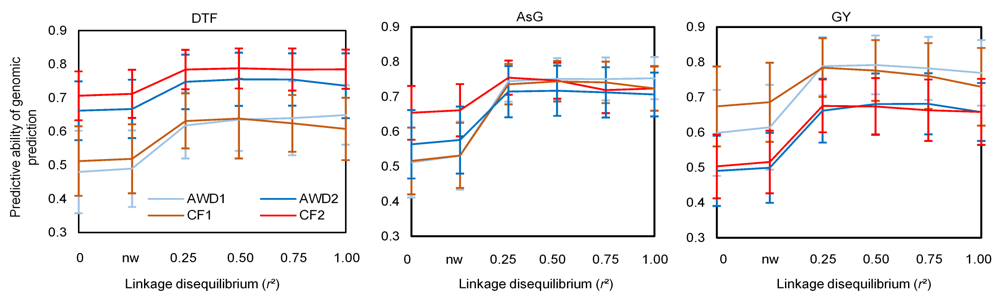
Fig. 2. Effects of presence and weight of 64 trait-specific markers on predictive ability of genomic prediction for arsenic content in grains (AsG), grain yield (GY) and days to flowering (DTF) observed in four environments. AWD1 and AWD2, Alternate watering and drying in Year 1 and Year 2, respectively; CF1 and CF2, Continued flooding in Year 1 and Year 2, respectively. 0, Establishment of the trait-specific Genomic relationship matrix G' with 17K SNP; nw, Establishment of genomic relationship matrix with 17K SNP + 64 trait-specific markers; 0.25, 0.50, 0.75 and 1.00, Establishment of genomic relationship matrix with 17K SNP + 64 trait-specific markers with a weight of 0.25, 0.50, 0.75 and 1.00, respectively.Data are presented as Mean ± SD (n = 100).
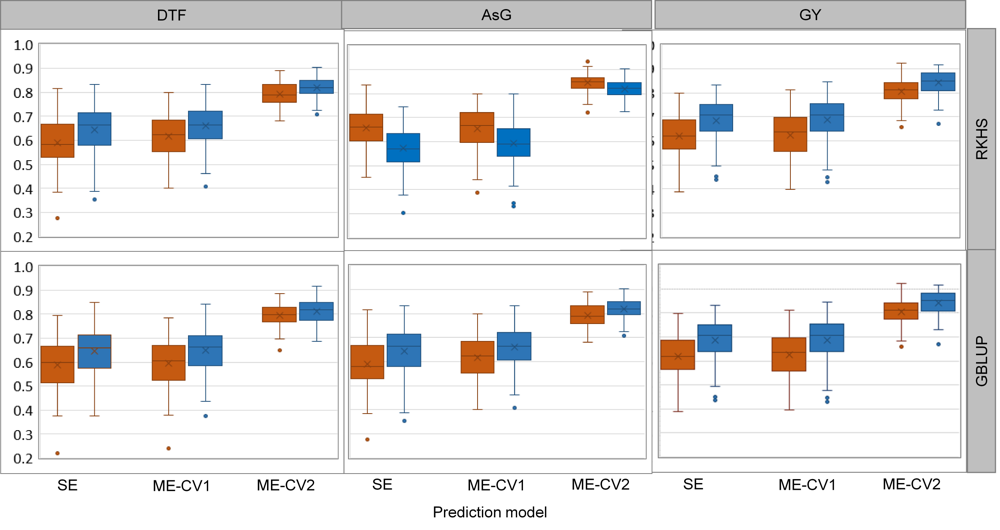
Fig. 3. Predictive ability of genomic prediction experiment with single environment (SE), and multi-environment (ME) models obtained with the genomic best linear unbiased prediction (GBLUP) and reproducing kernel Hilbert spaces (RKHS) statistical methods, for arsenic content in grains (AsG), grain yield (GY) and days to flowering (DTF).ME models are implemented with two cross-validation strategies CV1 and CV2. Alternate watering and drying is shown in orange and continued flooding in blue. Data are presented as Mean ± SD (n = 100).
| Environment | Trait | Genetic correlation | Residual genetic correlation | |||
|---|---|---|---|---|---|---|
| AsG | GY | AsG | GY | |||
| Year 1 & Year 2 | DTF | 0.000 | -0.157 | -0.061 | -0.051 | |
| AsG | 0.144 | -0.083 | ||||
| Year 1 | DTF | 0.027 | 0.005 | -0.023 | -0.023 | |
| AsG | 0.057 | -0.036 | ||||
| Year 2 | DTF | -0.018 | -0.119 | 0.012 | -0.087 | |
| AsG | 0.126 | 0.094 | ||||
Table 1 Genetic correlation between days to flowering (DTF), arsenic content in grains (AsG) and grain yield (GY).
| Environment | Trait | Genetic correlation | Residual genetic correlation | |||
|---|---|---|---|---|---|---|
| AsG | GY | AsG | GY | |||
| Year 1 & Year 2 | DTF | 0.000 | -0.157 | -0.061 | -0.051 | |
| AsG | 0.144 | -0.083 | ||||
| Year 1 | DTF | 0.027 | 0.005 | -0.023 | -0.023 | |
| AsG | 0.057 | -0.036 | ||||
| Year 2 | DTF | -0.018 | -0.119 | 0.012 | -0.087 | |
| AsG | 0.126 | 0.094 | ||||
| Irrigation system | AWD2 | CF1 | CF2 |
|---|---|---|---|
| AWD1 | 0.642 | 0.673 (0.504) | 0.607 (0.461) |
| AWD2 | 0.706 | 0.814 | |
| CF1 | 0.639 |
Table 2 Genetic correlation between alternate wetting and drying (AWD) and continued flooding (CF) irrigation systems.
| Irrigation system | AWD2 | CF1 | CF2 |
|---|---|---|---|
| AWD1 | 0.642 | 0.673 (0.504) | 0.607 (0.461) |
| AWD2 | 0.706 | 0.814 | |
| CF1 | 0.639 |
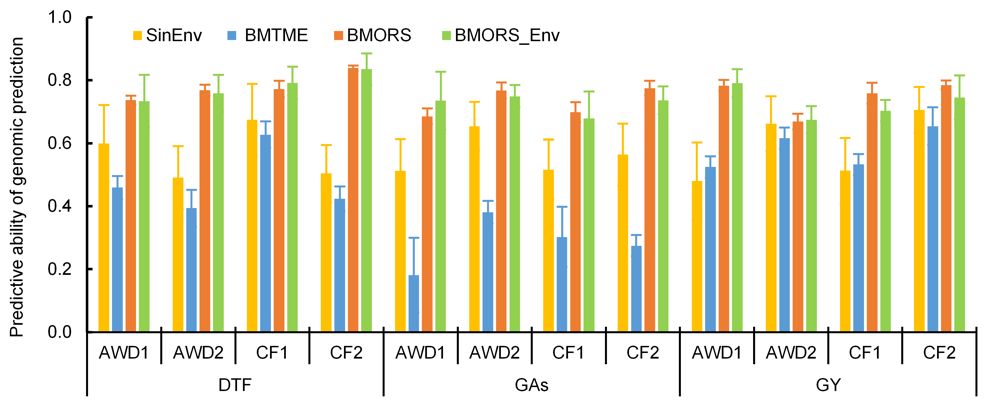
Fig. 4. Predictive ability of genomic prediction experiment with three multi-trait and multi-environment prediction models. SE, Single environment; BMTME, Bayesian multi-trait and multi-environment; BMORS, Bayesian multi-output regressor stacking; BMORS_Env, BMORS that allow predicting whole environments using the remaining environments as training. Four environments are considered: alternate watering and drying (AWD1 and AWD2) and continued flooding (CF1 and CF2). AsG, Arsenic in grains; GY, Grain yield; DTF, Days to flowering.Data are presented as Mean ± SD (n = 100).
| [1] | Ahmadi N, Bartholomé J, Cao T V, Grenier C. 2020. Genomic selection in rice: Empirical results and implications for breeding. In: Kang M J. Quantitative Genetics, Genomics and Plant Breeding. 2nd edn. CAB International. |
| [2] | Asoro F G, Newell M A, Beavis W D, Scott M P, Jannink J L. 2011. Accuracy and training population design for genomic selection on quantitative traits in elite North American oats. Plant Genom, 4(2): 132‒144. |
| [3] | Bassi F M, Bentley A R, Charmet G, Ortiz R, Crossa J. 2015. Breeding schemes for the implementation of genomic selection in wheat ( Triticum spp.). Plant Sci, 242: 23-36. |
| [4] | ben Hassen M, Cao T V, Bartholomé J, Orasen G, Colombi C, Rakotomalala J, Razafinimpiasa L, Bertone C, Biselli C, Volante A, Desiderio F, Jacquin L, Vale G, Ahmadi N. 2017. Rice diversity panel provides accurate genomic predictions for complex traits in the progenies of biparental crosses involving members of the panel. Theor Appl Genet, 131(2): 417‒435. |
| [5] | ben Hassen M, Bartholomé J, Valè G, Cao T V, Ahmadi N. 2018. Genomic prediction accounting for genotype by environment interaction offers an effective framework for breeding simultaneously for adaptation to an abiotic stress and performance under normal cropping conditions in rice. G3, 8(7): 2319‒2332. |
| [6] | Bernardo R, Yu J M. 2007. Prospects for genome-wide selection for quantitative traits in maize. Crop Sci, 47(3): 1082‒1090. |
| [7] | Bhandari A, Bartholomé B, Cao T V, Kumari N, Frouin J, Kumar A, Ahmadi N. 2019. Selection of trait-specific markers and multi-environment models improve genomic predictive ability in rice. PLoS One, 14(5): e0208871. |
| [8] | Brammer H, Ravenscroft P. 2009. Arsenic in groundwater: A threat to sustainable agriculture in South and South-east Asia. Environ Int, 35(3): 647‒654. |
| [9] | Cuevas J, Crossa J, Soberanis V, Pérez-Elizalde S, Pérez-Rodríguez P, de Los Campos G, Montesinos-Lopez O A, Burgueno J. 2016. Genomic prediction of genotype × environment interaction kernel regression models. Plant Genom, 9(3): 1‒20. |
| [10] | Cuevas J, Crossa J, Montesinos-López O A, Burgueño J, Pérez- Rodríguez P, de Los Campos G. 2017. Bayesian genomic prediction with genotype × environment interaction kernel models. G3, 7(1): 41‒53. |
| [11] | Dasgupta T, Hossain S A, Meharg A A, Price A H. 2004. An arsenate tolerance gene on chromosome 6 of rice. New Phytol, 163(1): 45‒49. |
| [12] | Frouin J, Labeyrie A, Boisnard A, Sacchi G A, Ahmadi N. 2019. Genomic prediction offers the most effective marker assisted breeding approach for ability to prevent arsenic accumulation in rice grains. PLoS One, 14(6): e0217516. |
| [13] | Gianola D, van Kaam J B C H M. 2008. Reproducing kernel hilbert spaces regression methods for genomic assisted prediction of quantitative traits. Genetics, 178(4): 2289‒2303. |
| [14] | Habier D, Fernando R L, Dekkers J C M. 2009. Genomic selection using low-density marker panels. Genetics, 182(1): 343‒353. |
| [15] | Heffner E L, Sorrells M E, Jannink J L. 2009. Genomic selection for crop improvement. Crop Sci, 49(1): 1‒12. |
| [16] | Kuramata M, Abe T, Kawasaki A, Ebana K, Shibaya T, Yano M, Lshikawa S. 2013. Genetic diversity of arsenic accumulation in rice and QTL analysis of methylated arsenic in rice grains. Rice, 6(3): 2‒10. |
| [17] | Lopez-Cruz M, Crossa J, Bonnett D, Dreisigacker S, Poland J, Jannink J L, Singh R P, Autrique E, de los Campos G. 2015. Increased prediction accuracy in wheat breeding trials using a marker × environment interaction genomic selection model. G3, 5(4): 569‒582. |
| [18] | Lorenz A J, Chao S, Asoro G F, Heffner L F, Hayashi T, Iwata H, Smith K P, Sorrells M E, Jannink J L. 2011. Genomic selection in plant breeding: Knowledge and prospects. Adv Agron, 110: 77‒123. |
| [19] | Meuwissen T H E, Hayes B J, Goddard M E. 2001. Prediction of total genetic value using genome-wide dense marker maps. Genetics, 157(4): 1819‒1829. |
| [20] | Montesinos-Lopez O A, Montesinos-Lopez A, Crossa J, Toledo F H, Perez-Hernandez O, Eskridge K M, Rutkoski J. 2016. A genomic Bayesian multi-trait and multi-environment model. G3, 6(9): 2725‒2744. |
| [21] | Montesinos-López O A, Montesinos-López A, Luna-Vázquez F J, Toledo F H, Pérez-Rodríguez P, Lillemo M, Crossa J. 2019. An R package for Bayesian analysis of multi-environment and multi-trait multi-environment data for genome-based prediction. G3, 9(5): 1355‒1369. |
| [22] | Norton G J, Duan G L, Dasgupta T, Islam M R, Lei M, Zhu Y G, Deacon C M, Moran A C, Islam S, Zhao F J, Stroud J L, McGrath S P, Feldmann J, Price A H, Meharg A A. 2009. Environmental and genetic control of arsenic accumulation and speciation in rice grain: Comparing a range of common cultivars grown in contaminated sites across Bangladesh, China and India. Environ Sci Technol, 43: 8381‒8386. |
| [23] | Norton G J, Deacon C M, Xiong L Z, Huang S Y, Meharg A A, Price A H. 2010. Genetic mapping of the rice ionome in leaves and grain: Identification of QTLs for 17 elements including arsenic, cadmium, iron and selenium. Plant Soil, 329: 139‒153. |
| [24] | Norton G J, Pinson S R M, Alexander J, Mckay S, Hansen H, Duan G L, Islam M R, Islam S, Stroud J, Zhao F J, McGrath S P, Zhu Y G, Lahner B, Yakubova E, Guerinot M L, Tarpley L, Eizenga G C, Salt D E, Mcharg A A, Price A H. 2012a. Variation in grain arsenic assessed in a diverse panel of rice(Oryza sativa) grown in multiple sites. New Phytol, 193: 650‒664. |
| [25] | Norton G J, Duan G L, Lei M, Zhu Y G, Meharg A A, Price A H. 2012b. Identification of quantitative trait loci for rice grain element composition on an arsenic impacted soil: Influence of flowering time on genetic loci. Ann Appl Biol, 161(1): 46-56. |
| [26] | Norton G T, Douglas A, Lahner B, Yakubova E, Guerinot M L, Pinson S R, Tarpley L, Eizenga G, McGrath S P, Zhao F J, Islam M R, Islam S, Duan G L, Zhu Y G, Salt D E, Meharg A A, Price A H. 2014. Genome wide association mapping of grain arsenic, copper, molybdenum and zinc in rice ( Oryza sativa L.) grown at four international field sites. PLoS One, 9(2): e89685. |
| [27] | Norton G J, Shafaei M, Travis A J, Deacon C M, Danku J, Pond D, Cochrane N, Lockhart K, Salt D, Zhang H, Dodd I C, Hossain M, Islam M R, Price A H. 2017a. Impact of alternate wetting and drying on rice physiology, grain production, and grain quality. Field Crops Res, 205: 1‒13. |
| [28] | Norton G J, Travis A J, Danku J M C, Salt D E, Hossain M, Islam M R, Price A H. 2017b. Biomass and elemental concentrations of 22 rice cultivars grown under alternate wetting and drying conditions at three field sites in Bangladesh. Food Energy Secur, 6(3): 98-112. |
| [29] | Norton G J, Travis A J, Douglas A, Fairley S, de Paiva Alves E, Ruang-areerate P, Naredo M E B, McNally K L, Hossain M, Islam M R, Price A H. 2018. Genome wide association mapping of grain and straw biomass traits in the rice Bengal and Assam Aus panel (BAAP) grown under alternate wetting and drying and permanently flooded irrigation. Front Plant Sci, 9: 1223. |
| [30] | Norton G J, Travis A J, Talukdar P, Hossain M, Islam M R, Douglas A, Price A H. 2019. Genetic loci regulating arsenic content in rice grains when grown flooded or under alternative wetting and drying irrigation. Rice, 12: 54. |
| [31] | Park T, Casella G. 2008. The bayesian lasso. J Am Stat Assoc, 103: 681‒686. |
| [32] | Pérez P, de los Campos G. 2014. Genome-wide regression and prediction with the BGLR statistical package. Genetics, 198(2): 483‒495. |
| [33] | Rahman M A, Hasegawa H, Rahman M M, Islam M N, Miah M A M, Tasmen A. 2007. Effect of arsenic on photosynthesis, growth and yield of five widely cultivated rice ( Oryza sativa L.) varieties in Bangladesh. Chemosphere, 67(6): 1072-1079. |
| [34] | Sempéré G, Pétel A, Rouard M, Frouin J, Hueber Y, de Bellis F, Larmande P. 2019. Gigwa-v2 extended and improved genotype investigator. Giga Sci, 8(5): giz051. |
| [35] | Spyromitros-Xioufis E, Tsoumakas G, Groves W, Vlahavas I. 2016. Multi-target regression via input space expansion: Treating targets as inputs. Mach Learn, 104: 55-98. |
| [36] | Stroud J L, Norton G J, Islam M R, Dasgupta T, White R P, Price A H, Meharg A A, McGrath S P, Zhao F J. 2011. The dynamics of arsenic in four paddy fields in the Bengal Deltas. Environ Pollut, 159(4): 947‒953. |
| [37] | Tibshirani R. 1996. Regression shrinkage and selection via the lasso: A retrospective. J Roy Stat Soc, 58(1): 267‒288. |
| [38] | Van Raden P M. 2008. Efficient methods to compute genomic predictions. J Dairy Sci, 91(11): 4414‒4423. |
| [39] | Veerkamp R F, Bouwman A C, Schrooten C, Calus M P L. 2016. Genomic prediction using preselected DNA variants from a GWAS with whole genome sequence data in Holstein-Friesian cattle. Genet Sel Evol, 48(1): 95. |
| [40] | Zavala Y J, Duxbury J M. 2008. Arsenic in rice: I. Estimating normal levels of total arsenic in rice grain. Environ Sci Technol, 42(10): 3856-3860. |
| [41] | Zhang M, Pinson S R M, Tarpley L, Huang X Y, Lahner B, Yakubova E, Baxter L, Guerinot M L, Salt D E. 2014. Mapping and validation of quantitative trait toci associated with concentration of 16 elements in unmilled rice grain. Theor Appl Genet, 127(1): 137‒165. |
| [42] | Zhang Z, Ober U, Erbe M, Zhang H, Gao N, He J L, Li J Q, Simianer H. 2014. Improving the accuracy of whole genome prediction for complex traits using the results of genome wide association studies. PLoS One, 9(3): e93017. |
| [43] | Zhong S Q, Dekkers J C M, Fernando R L, Jannink J L. 2009. Factors affecting accuracy from genomic selection in populations derived from multiple inbred lines: A barley case study. Genetics, 182(1): 355‒364. |
| No related articles found! |
| 阅读次数 | ||||||
|
全文 |
|
|||||
|
摘要 |
|
|||||
