Rice Science ›› 2024, Vol. 31 ›› Issue (1): 118-128.DOI: 10.1016/j.rsci.2023.06.006
• • 上一篇
收稿日期:2023-03-26
接受日期:2023-07-05
出版日期:2024-01-28
发布日期:2024-02-06
. [J]. Rice Science, 2024, 31(1): 118-128.
| Year | Treatment | Growth duration (d) | Overall growth duration (d) | Grain yield (t/hm2) | |||
|---|---|---|---|---|---|---|---|
| From sowing to jointing | From jointing to heading | From heading to maturity | |||||
| 2020 | NS | CC | 59 | 32 | 59 | 150 | 11.5 a |
| DJ | 59 | 34 | 56 | 149 | 10.1 b | ||
| DH | 59 | 32 | 55 | 146 | 9.7 c | ||
| HS | CC | 60 | 33 | 55 | 148 | 9.4 c | |
| DJ | 60 | 35 | 52 | 147 | 7.6 d | ||
| DH | 60 | 33 | 52 | 145 | 7.0 e | ||
| 2021 | NS | CC | 58 | 31 | 59 | 148 | 11.4 a |
| DJ | 58 | 33 | 56 | 147 | 10.0 b | ||
| DH | 58 | 31 | 55 | 144 | 9.5 c | ||
| HS | CC | 59 | 32 | 55 | 146 | 9.2 c | |
| DJ | 59 | 34 | 53 | 146 | 7.6 d | ||
| DH | 59 | 32 | 52 | 143 | 7.0 e | ||
| Analysis of variance (ANOVA) | |||||||
| Year | None | ||||||
| Salinity | ** | ||||||
| Drought | ** | ||||||
| Year × Salinity | None | ||||||
| Year × Drought | None | ||||||
| Salinity × Drought | ** | ||||||
| Year × Salinity × Drought | None | ||||||
Table 1. Growth duration and grain yield of rice under salinity and drought treatments in 2020 and 2021.
| Year | Treatment | Growth duration (d) | Overall growth duration (d) | Grain yield (t/hm2) | |||
|---|---|---|---|---|---|---|---|
| From sowing to jointing | From jointing to heading | From heading to maturity | |||||
| 2020 | NS | CC | 59 | 32 | 59 | 150 | 11.5 a |
| DJ | 59 | 34 | 56 | 149 | 10.1 b | ||
| DH | 59 | 32 | 55 | 146 | 9.7 c | ||
| HS | CC | 60 | 33 | 55 | 148 | 9.4 c | |
| DJ | 60 | 35 | 52 | 147 | 7.6 d | ||
| DH | 60 | 33 | 52 | 145 | 7.0 e | ||
| 2021 | NS | CC | 58 | 31 | 59 | 148 | 11.4 a |
| DJ | 58 | 33 | 56 | 147 | 10.0 b | ||
| DH | 58 | 31 | 55 | 144 | 9.5 c | ||
| HS | CC | 59 | 32 | 55 | 146 | 9.2 c | |
| DJ | 59 | 34 | 53 | 146 | 7.6 d | ||
| DH | 59 | 32 | 52 | 143 | 7.0 e | ||
| Analysis of variance (ANOVA) | |||||||
| Year | None | ||||||
| Salinity | ** | ||||||
| Drought | ** | ||||||
| Year × Salinity | None | ||||||
| Year × Drought | None | ||||||
| Salinity × Drought | ** | ||||||
| Year × Salinity × Drought | None | ||||||
| Year | Treatment | No. of panicles per m2 | No. of spikelets per panicle | No. of spikelets per m2 (×103) | Filled- grain rate (%) | Grain weight (mg) | ||
|---|---|---|---|---|---|---|---|---|
| 2020 | NS | CC | 308 a | 156 a | 48.0 a | 90.7 a | 27.2 a | |
| DJ | 299 ab | 142 b | 42.5 c | 88.9 ab | 26.9 a | |||
| DH | 303 a | 151 a | 45.8 b | 83.7 c | 25.9 bc | |||
| HS | CC | 283 c | 141 b | 39.9 d | 86.2 b | 26.2 b | ||
| DJ | 276 c | 121 c | 33.4 f | 85.1 bc | 25.9 bc | |||
| DH | 288 bc | 135 bc | 38.9 e | 78.8 d | 24.2 c | |||
| 2021 | NS | CC | 302 a | 158 a | 47.7 a | 89.4 a | 27.6 a | |
| DJ | 291 ab | 142 b | 41.3 b | 88.3 a | 27.1 b | |||
| DH | 299 a | 153 ab | 45.7 ab | 83.1 c | 25.8 c | |||
| HS | CC | 284 b | 144 b | 40.9 b | 86.1 b | 26.0 c | ||
| DJ | 267 c | 125 c | 33.4 d | 85.4 b | 25.7 c | |||
| DH | 278 bc | 137 bc | 38.1 c | 78.2 d | 24.3 d | |||
| Analysis of variance (ANOVA) | ||||||||
| Year | None | None | None | None | None | |||
| Salinity | ** | ** | ** | ** | ** | |||
| Drought | * | * | * | ** | ** | |||
| Year × Salinity | None | None | None | None | None | |||
| Year × Drought | None | None | None | None | None | |||
| Salinity × Drought | * | None | * | * | ** | |||
| Year × Salinity × Drought | None | None | None | None | None | |||
Table 2. Grain yield components of rice under salinity and drought treatments in 2020 and 2021.
| Year | Treatment | No. of panicles per m2 | No. of spikelets per panicle | No. of spikelets per m2 (×103) | Filled- grain rate (%) | Grain weight (mg) | ||
|---|---|---|---|---|---|---|---|---|
| 2020 | NS | CC | 308 a | 156 a | 48.0 a | 90.7 a | 27.2 a | |
| DJ | 299 ab | 142 b | 42.5 c | 88.9 ab | 26.9 a | |||
| DH | 303 a | 151 a | 45.8 b | 83.7 c | 25.9 bc | |||
| HS | CC | 283 c | 141 b | 39.9 d | 86.2 b | 26.2 b | ||
| DJ | 276 c | 121 c | 33.4 f | 85.1 bc | 25.9 bc | |||
| DH | 288 bc | 135 bc | 38.9 e | 78.8 d | 24.2 c | |||
| 2021 | NS | CC | 302 a | 158 a | 47.7 a | 89.4 a | 27.6 a | |
| DJ | 291 ab | 142 b | 41.3 b | 88.3 a | 27.1 b | |||
| DH | 299 a | 153 ab | 45.7 ab | 83.1 c | 25.8 c | |||
| HS | CC | 284 b | 144 b | 40.9 b | 86.1 b | 26.0 c | ||
| DJ | 267 c | 125 c | 33.4 d | 85.4 b | 25.7 c | |||
| DH | 278 bc | 137 bc | 38.1 c | 78.2 d | 24.3 d | |||
| Analysis of variance (ANOVA) | ||||||||
| Year | None | None | None | None | None | |||
| Salinity | ** | ** | ** | ** | ** | |||
| Drought | * | * | * | ** | ** | |||
| Year × Salinity | None | None | None | None | None | |||
| Year × Drought | None | None | None | None | None | |||
| Salinity × Drought | * | None | * | * | ** | |||
| Year × Salinity × Drought | None | None | None | None | None | |||
| Year | Treatment | Shoot biomass weight (SBW) (t/hm2) | SBW from heading to maturity (t/hm2) | Increased rate of SBW from heading to maturity [t/(hm2·d)] | Harvest index | |||
|---|---|---|---|---|---|---|---|---|
| Jointing | Heading | Maturity | ||||||
| 2020 | NS | CC | 5.7 a | 12.1 a | 20.0 a | 7.9 a | 0.134 a | 0.495 d |
| DJ | 5.6 a | 10.7 b | 17.2 b | 6.5 b | 0.116 b | 0.505 c | ||
| DH | 5.7 a | 12.0 a | 16.2 c | 4.2 d | 0.076 d | 0.516 bc | ||
| HS | CC | 3.9 b | 9.9 c | 15.9 c | 6.0 c | 0.109 c | 0.508 c | |
| DJ | 3.8 b | 8.7 d | 12.5 d | 3.8 e | 0.073 d | 0.523 b | ||
| DH | 3.8 b | 9.7 c | 11.3 e | 1.6 f | 0.030 e | 0.534 a | ||
| 2021 | NS | CC | 5.8 a | 12.0 a | 19.8 a | 7.8 a | 0.133 a | 0.494 e |
| DJ | 5.9 a | 10.9 b | 16.9 b | 6.0 b | 0.108 b | 0.508 d | ||
| DH | 5.8 a | 12.1 a | 15.7 c | 3.6 d | 0.066 c | 0.520 bc | ||
| HS | CC | 3.7 b | 9.7 c | 15.5 c | 5.8 c | 0.105 b | 0.512 cd | |
| DJ | 3.6 b | 8.9 d | 12.4 d | 3.5 d | 0.066 c | 0.527 b | ||
| DH | 3.7 b | 9.6 c | 11.2 e | 1.6 e | 0.030 d | 0.539 a | ||
| Analysis of variance (ANOVA) | ||||||||
| Year | None | None | None | * | * | None | ||
| Salinity | ** | ** | ** | ** | ** | ** | ||
| Drought | None | ** | ** | ** | ** | * | ||
| Year × Salinity | * | None | None | None | None | None | ||
| Year × Drought | None | None | None | None | None | None | ||
| Salinity × Drought | None | * | ** | ** | ** | ** | ||
| Year × Salinity × Drought | None | None | None | ** | None | None | ||
Table 3. Shoot biomass accumulation and harvest index of rice under salinity and drought treatments in 2020 and 2021.
| Year | Treatment | Shoot biomass weight (SBW) (t/hm2) | SBW from heading to maturity (t/hm2) | Increased rate of SBW from heading to maturity [t/(hm2·d)] | Harvest index | |||
|---|---|---|---|---|---|---|---|---|
| Jointing | Heading | Maturity | ||||||
| 2020 | NS | CC | 5.7 a | 12.1 a | 20.0 a | 7.9 a | 0.134 a | 0.495 d |
| DJ | 5.6 a | 10.7 b | 17.2 b | 6.5 b | 0.116 b | 0.505 c | ||
| DH | 5.7 a | 12.0 a | 16.2 c | 4.2 d | 0.076 d | 0.516 bc | ||
| HS | CC | 3.9 b | 9.9 c | 15.9 c | 6.0 c | 0.109 c | 0.508 c | |
| DJ | 3.8 b | 8.7 d | 12.5 d | 3.8 e | 0.073 d | 0.523 b | ||
| DH | 3.8 b | 9.7 c | 11.3 e | 1.6 f | 0.030 e | 0.534 a | ||
| 2021 | NS | CC | 5.8 a | 12.0 a | 19.8 a | 7.8 a | 0.133 a | 0.494 e |
| DJ | 5.9 a | 10.9 b | 16.9 b | 6.0 b | 0.108 b | 0.508 d | ||
| DH | 5.8 a | 12.1 a | 15.7 c | 3.6 d | 0.066 c | 0.520 bc | ||
| HS | CC | 3.7 b | 9.7 c | 15.5 c | 5.8 c | 0.105 b | 0.512 cd | |
| DJ | 3.6 b | 8.9 d | 12.4 d | 3.5 d | 0.066 c | 0.527 b | ||
| DH | 3.7 b | 9.6 c | 11.2 e | 1.6 e | 0.030 d | 0.539 a | ||
| Analysis of variance (ANOVA) | ||||||||
| Year | None | None | None | * | * | None | ||
| Salinity | ** | ** | ** | ** | ** | ** | ||
| Drought | None | ** | ** | ** | ** | * | ||
| Year × Salinity | * | None | None | None | None | None | ||
| Year × Drought | None | None | None | None | None | None | ||
| Salinity × Drought | None | * | ** | ** | ** | ** | ||
| Year × Salinity × Drought | None | None | None | ** | None | None | ||
| Year | Treatment | NSC content in stem (g/m2) | NSC remobilization reserve (%) | ||
|---|---|---|---|---|---|
| Heading | Maturity | ||||
| 2020 | NS | CC | 341 a | 178 a | 47.8 d |
| DJ | 317 b | 159 b | 49.8 c | ||
| DH | 339 a | 153 bc | 54.9 a | ||
| HS | CC | 299 c | 145 c | 51.5 b | |
| DJ | 275 d | 136 d | 50.5 b | ||
| DH | 302 bc | 132 d | 56.3 a | ||
| 2021 | NS | CC | 333 a | 173 a | 48.0 d |
| DJ | 309 b | 156 b | 49.5 cd | ||
| DH | 326 a | 149 bc | 54.3 b | ||
| HS | CC | 289 c | 143 c | 50.5 c | |
| DJ | 266 d | 128 d | 51.9 c | ||
| DH | 282 c | 122 d | 56.7 a | ||
| Analysis of variance (ANOVA) | |||||
| Year | * | * | None | ||
| Salinity | ** | ** | ** | ||
| Drought | ** | ** | ** | ||
| Year × Salinity | None | None | None | ||
| Year × Drought | None | None | None | ||
| Salinity × Drought | None | None | ** | ||
| Year × Salinity × Drought | None | None | None | ||
Table 4. Nonstructural carbohydrate (NSC) content in stem at heading and maturity and NSC remobilization reserve of rice under salinity and drought treatments in 2020 and 2021.
| Year | Treatment | NSC content in stem (g/m2) | NSC remobilization reserve (%) | ||
|---|---|---|---|---|---|
| Heading | Maturity | ||||
| 2020 | NS | CC | 341 a | 178 a | 47.8 d |
| DJ | 317 b | 159 b | 49.8 c | ||
| DH | 339 a | 153 bc | 54.9 a | ||
| HS | CC | 299 c | 145 c | 51.5 b | |
| DJ | 275 d | 136 d | 50.5 b | ||
| DH | 302 bc | 132 d | 56.3 a | ||
| 2021 | NS | CC | 333 a | 173 a | 48.0 d |
| DJ | 309 b | 156 b | 49.5 cd | ||
| DH | 326 a | 149 bc | 54.3 b | ||
| HS | CC | 289 c | 143 c | 50.5 c | |
| DJ | 266 d | 128 d | 51.9 c | ||
| DH | 282 c | 122 d | 56.7 a | ||
| Analysis of variance (ANOVA) | |||||
| Year | * | * | None | ||
| Salinity | ** | ** | ** | ||
| Drought | ** | ** | ** | ||
| Year × Salinity | None | None | None | ||
| Year × Drought | None | None | None | ||
| Salinity × Drought | None | None | ** | ||
| Year × Salinity × Drought | None | None | None | ||
| Year | Treatment | LAI (m2/m2) | Reduction rate of LAI from heading to maturity [m2/(m2·d)] | SPAD value | Reduction rate of SPAD value from heading to maturity | |||||
|---|---|---|---|---|---|---|---|---|---|---|
| Jointing | Heading | Maturity | Heading | Mid-grain-filling | Maturity | |||||
| 2020 | NS | CC | 3.6 a | 8.3 a | 3.2 a | 0.086 b | 48.4 ab | 35.4 a | 20.5 a | 0.473 c |
| DJ | 3.7 a | 7.7 b | 2.6 b | 0.091 b | 43.2 c | 30.6 c | 15.9 b | 0.488 c | ||
| DH | 3.6 a | 8.4 a | 2.2 c | 0.113 a | 47.3 b | 31.3 c | 12.6 c | 0.631 b | ||
| HS | CC | 2.4 b | 5.6 c | 2.6 b | 0.055 d | 49.2 a | 33.2 b | 16.4 b | 0.596 b | |
| DJ | 2.3 b | 5.0 d | 1.9 c | 0.060 d | 43.4 c | 28.8 d | 11.7 c | 0.610 b | ||
| DH | 2.3 b | 5.5 c | 1.5 d | 0.077 c | 47.8 b | 27.9 d | 8.9 d | 0.748 a | ||
| 2021 | NS | CC | 3.7 a | 8.4 a | 3.1 a | 0.090 b | 48.0 a | 34.9 a | 20.4 a | 0.468 d |
| DJ | 3.7 a | 7.7 b | 2.4 b | 0.095 b | 44.0 b | 30.2 c | 15.6 b | 0.506 c | ||
| DH | 3.6 a | 8.3 a | 2.1 bc | 0.113 a | 46.9 ab | 30.9 c | 12.2 c | 0.630 b | ||
| HS | CC | 2.3 b | 5.5 c | 2.6 b | 0.053 d | 48.2 a | 33.1 b | 15.9 b | 0.587 bc | |
| DJ | 2.4 b | 4.8 d | 1.8 c | 0.057 d | 44.4 b | 28.8 d | 11.6 c | 0.619 b | ||
| DH | 2.2 b | 5.6 c | 1.5 d | 0.079 c | 47.3 ab | 28.0 d | 8.8 d | 0.740 a | ||
| Analysis of variance (ANOVA) | ||||||||||
| Year | None | None | None | None | None | None | None | None | ||
| Salinity | ** | ** | ** | ** | * | ** | ** | ** | ||
| Drought | None | ** | ** | ** | ** | ** | ** | * | ||
| Year × Salinity | None | None | None | None | None | None | None | None | ||
| Year × Drought | None | None | None | None | None | None | None | None | ||
| Salinity × Drought | None | None | * | ** | None | * | ** | ** | ||
| Year × Salinity × Drought | None | None | None | None | None | None | None | None | ||
Table 5. Leaf area index (LAI) and SPAD values at main rice growth stages and its reduction rate after heading under salinity and drought treatments in 2020 and 2021.
| Year | Treatment | LAI (m2/m2) | Reduction rate of LAI from heading to maturity [m2/(m2·d)] | SPAD value | Reduction rate of SPAD value from heading to maturity | |||||
|---|---|---|---|---|---|---|---|---|---|---|
| Jointing | Heading | Maturity | Heading | Mid-grain-filling | Maturity | |||||
| 2020 | NS | CC | 3.6 a | 8.3 a | 3.2 a | 0.086 b | 48.4 ab | 35.4 a | 20.5 a | 0.473 c |
| DJ | 3.7 a | 7.7 b | 2.6 b | 0.091 b | 43.2 c | 30.6 c | 15.9 b | 0.488 c | ||
| DH | 3.6 a | 8.4 a | 2.2 c | 0.113 a | 47.3 b | 31.3 c | 12.6 c | 0.631 b | ||
| HS | CC | 2.4 b | 5.6 c | 2.6 b | 0.055 d | 49.2 a | 33.2 b | 16.4 b | 0.596 b | |
| DJ | 2.3 b | 5.0 d | 1.9 c | 0.060 d | 43.4 c | 28.8 d | 11.7 c | 0.610 b | ||
| DH | 2.3 b | 5.5 c | 1.5 d | 0.077 c | 47.8 b | 27.9 d | 8.9 d | 0.748 a | ||
| 2021 | NS | CC | 3.7 a | 8.4 a | 3.1 a | 0.090 b | 48.0 a | 34.9 a | 20.4 a | 0.468 d |
| DJ | 3.7 a | 7.7 b | 2.4 b | 0.095 b | 44.0 b | 30.2 c | 15.6 b | 0.506 c | ||
| DH | 3.6 a | 8.3 a | 2.1 bc | 0.113 a | 46.9 ab | 30.9 c | 12.2 c | 0.630 b | ||
| HS | CC | 2.3 b | 5.5 c | 2.6 b | 0.053 d | 48.2 a | 33.1 b | 15.9 b | 0.587 bc | |
| DJ | 2.4 b | 4.8 d | 1.8 c | 0.057 d | 44.4 b | 28.8 d | 11.6 c | 0.619 b | ||
| DH | 2.2 b | 5.6 c | 1.5 d | 0.079 c | 47.3 ab | 28.0 d | 8.8 d | 0.740 a | ||
| Analysis of variance (ANOVA) | ||||||||||
| Year | None | None | None | None | None | None | None | None | ||
| Salinity | ** | ** | ** | ** | * | ** | ** | ** | ||
| Drought | None | ** | ** | ** | ** | ** | ** | * | ||
| Year × Salinity | None | None | None | None | None | None | None | None | ||
| Year × Drought | None | None | None | None | None | None | None | None | ||
| Salinity × Drought | None | None | * | ** | None | * | ** | ** | ||
| Year × Salinity × Drought | None | None | None | None | None | None | None | None | ||
| Year | Treatment | Pn [µmol/(m2·s)] | Tr [µmol/(m2·s)] | Gs [µmol/(m2·s)] | Ci (µmol/mol) | ||
|---|---|---|---|---|---|---|---|
| 2020 | NS | CC | 19.7 a | 8.8 a | 326 a | 187 d | |
| DJ | 16.0 b | 7.0 b | 306 b | 206 d | |||
| DH | 16.3 b | 5.1 c | 289 c | 245 c | |||
| HS | CC | 16.9 b | 6.9 b | 286 c | 253 bc | ||
| DJ | 14.3 c | 4.9 c | 263 d | 264 b | |||
| DH | 13.9 c | 4.3 d | 226 e | 283 a | |||
| 2021 | NS | CC | 19.8 a | 8.6 a | 335 a | 193 e | |
| DJ | 16.8 b | 7.0 b | 312 b | 217 d | |||
| DH | 17.1 b | 6.2 bc | 283 c | 246 bc | |||
| HS | CC | 17.3 b | 6.4 bc | 288 c | 240 c | ||
| DJ | 14.8 c | 5.3 c | 259 d | 253 b | |||
| DH | 14.5 c | 4.3 d | 218 e | 274 a | |||
| Analysis of variance (ANOVA) | |||||||
| Year | None | None | None | None | |||
| Salinity | ** | ** | ** | ** | |||
| Drought | ** | ** | ** | ** | |||
| Year × Salinity | None | None | None | None | |||
| Year × Drought | None | None | None | None | |||
| Salinity × Drought | ** | * | * | None | |||
| Year × Salinity × Drought | None | None | None | None | |||
Table 6. Photosynthetic characteristics of flag leaves at mid- grain-filling period of rice under salinity and drought treatments in 2020 and 2021.
| Year | Treatment | Pn [µmol/(m2·s)] | Tr [µmol/(m2·s)] | Gs [µmol/(m2·s)] | Ci (µmol/mol) | ||
|---|---|---|---|---|---|---|---|
| 2020 | NS | CC | 19.7 a | 8.8 a | 326 a | 187 d | |
| DJ | 16.0 b | 7.0 b | 306 b | 206 d | |||
| DH | 16.3 b | 5.1 c | 289 c | 245 c | |||
| HS | CC | 16.9 b | 6.9 b | 286 c | 253 bc | ||
| DJ | 14.3 c | 4.9 c | 263 d | 264 b | |||
| DH | 13.9 c | 4.3 d | 226 e | 283 a | |||
| 2021 | NS | CC | 19.8 a | 8.6 a | 335 a | 193 e | |
| DJ | 16.8 b | 7.0 b | 312 b | 217 d | |||
| DH | 17.1 b | 6.2 bc | 283 c | 246 bc | |||
| HS | CC | 17.3 b | 6.4 bc | 288 c | 240 c | ||
| DJ | 14.8 c | 5.3 c | 259 d | 253 b | |||
| DH | 14.5 c | 4.3 d | 218 e | 274 a | |||
| Analysis of variance (ANOVA) | |||||||
| Year | None | None | None | None | |||
| Salinity | ** | ** | ** | ** | |||
| Drought | ** | ** | ** | ** | |||
| Year × Salinity | None | None | None | None | |||
| Year × Drought | None | None | None | None | |||
| Salinity × Drought | ** | * | * | None | |||
| Year × Salinity × Drought | None | None | None | None | |||
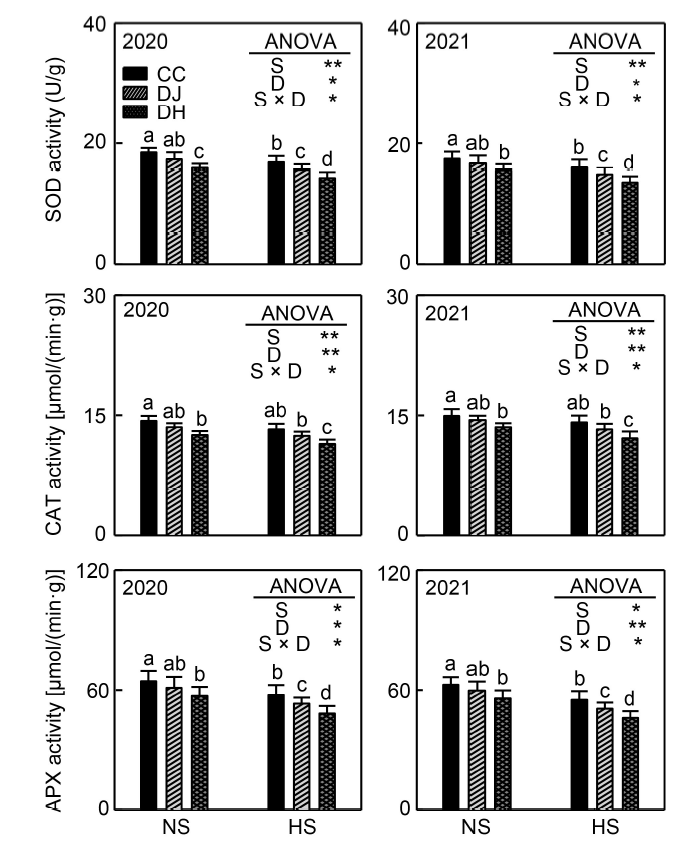
Fig. 1. Activities of SOD, CAT, and APX in rice leaves at 30 d after heading under salinity and drought treatments in 2020 and 2021. SOD, Superoxide dismutase; CAT, Catalase; APX, Ascorbate peroxidase; NS, Non-salinity treatment; HS, High-salinity treatment. CC, Control condition; DJ, Drought stress imposed at jointing; DH, Drought stress imposed at heading. Data are Mean ± SE (n = 3). Values followed by different lowercase letters indicate statistical significances at P < 0.05. In the analysis of variance (ANOVA), S, D, and S × D represent salinity, drought, and salinity × drought treatments, respectively. * and ** represent statistical differences at P < 0.05 and P < 0.05, respectively.
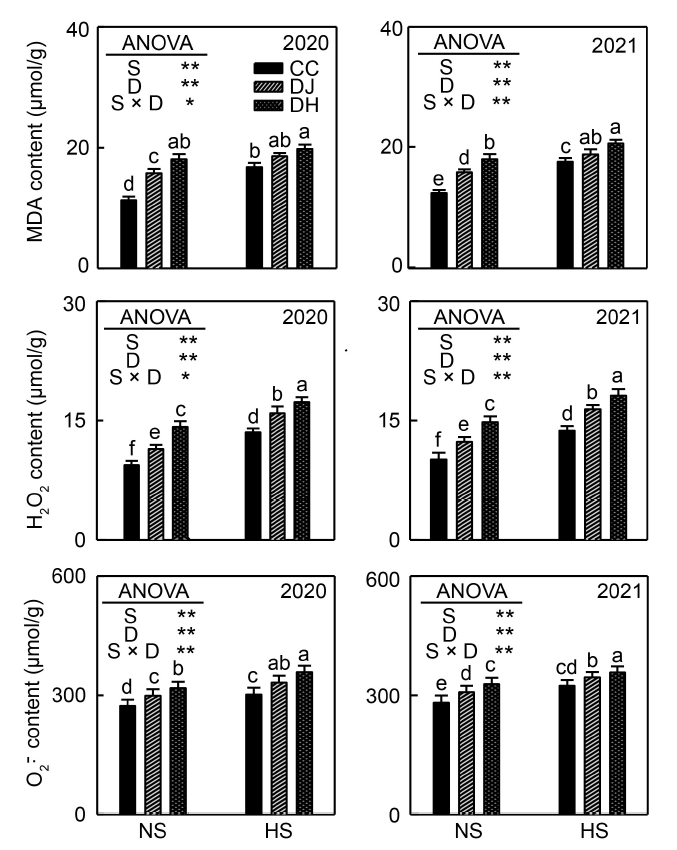
Fig. 2. Contents of MDA, H2O2, and O2·? in rice leaves at 30 d after heading under salinity and drought treatments in 2020 and 2021. MDA, Malondialdehyde; NS, Non-salinity treatment; HS, High-salinity treatment. CC, Control condition; DJ, Drought stress imposed at jointing; DH, Drought stress imposed at heading. Data are Mean ± SE (n = 3). Values followed by different lowercase letters indicate statistical significances at P < 0.05. In the analysis of variance (ANOVA), S, D, and S × D represent salinity, drought, and salinity × drought treatments, respectively. * and ** represent statistical differences at P < 0.05 and P < 0.01, respectively.
| Trait | Grain yield | Shoot biomass weight at maturity | Shoot biomass accumulation from heading to maturity | Pn at mid-grain-filling |
|---|---|---|---|---|
| Overall growth duration | 0.70* | 0.72** | 0.85** | 0.57 |
| Spikelet number per m2 | 0.85** | 0.84** | 0.60* | 0.83** |
| Filled-grain rate | 0.83** | 0.85** | 0.94** | 0.73** |
| Grain weight | 0.89** | 0.90** | 0.94** | 0.79** |
| Harvest index | -0.95** | -0.96** | -0.98** | -0.88** |
| NSC remobilization reserve | -0.71** | -0.74** | -0.90** | -0.67* |
| LAI at maturity | 0.94** | 0.95** | 0.97** | 0.92** |
| Reduction rate of LAI from heading to maturity | 0.43 | 0.39 | 0.06 | 0.27 |
| SPAD value of flag leaf at maturity | 0.91** | 0.93** | 0.98** | 0.91** |
| Reduction rate of SPAD value from heading to maturity | -0.87** | -0.88** | -0.95** | -0.76** |
| Tr of flag leaf at mid-grain-filling stage | 0.93** | 0.93** | 0.86** | 0.98** |
| Gs of flag leaf at mid-grain-filling stage | 0.92** | 0.93** | 0.95** | 0.92** |
| Ci of flag leaf at mid-grain-filling stage | -0.66* | -0.69* | -0.59 | -0.87** |
| SOD activity in leaf at 30 DAH | 0.93** | 0.83** | 0.67* | 0.84** |
| CAT activity in leaf at 30 DAH | 0.92** | 0.93** | 0.96** | 0.82** |
| APX activity in leaf at 30 DAH | 0.83** | 0.83** | 0.87** | 0.85** |
| MDA content in leaf at 30 DAH | -0.96** | -0.97** | -0.94** | -0.84** |
| H2O2 content in leaf at 30 DAH | -0.91** | -0.93** | -0.92** | -0.89** |
| O2·̄ content in leaf at 30 DAH | -0.96** | -0.97** | -0.96** | -0.88** |
Table 7. Pearson’s correlation coefficients between determined traits with grain yield, shoot biomass weight at maturity and accumulation from heading to maturity, and net photosynthetic rate of flag leaf in rice under salinity and drought treatments.
| Trait | Grain yield | Shoot biomass weight at maturity | Shoot biomass accumulation from heading to maturity | Pn at mid-grain-filling |
|---|---|---|---|---|
| Overall growth duration | 0.70* | 0.72** | 0.85** | 0.57 |
| Spikelet number per m2 | 0.85** | 0.84** | 0.60* | 0.83** |
| Filled-grain rate | 0.83** | 0.85** | 0.94** | 0.73** |
| Grain weight | 0.89** | 0.90** | 0.94** | 0.79** |
| Harvest index | -0.95** | -0.96** | -0.98** | -0.88** |
| NSC remobilization reserve | -0.71** | -0.74** | -0.90** | -0.67* |
| LAI at maturity | 0.94** | 0.95** | 0.97** | 0.92** |
| Reduction rate of LAI from heading to maturity | 0.43 | 0.39 | 0.06 | 0.27 |
| SPAD value of flag leaf at maturity | 0.91** | 0.93** | 0.98** | 0.91** |
| Reduction rate of SPAD value from heading to maturity | -0.87** | -0.88** | -0.95** | -0.76** |
| Tr of flag leaf at mid-grain-filling stage | 0.93** | 0.93** | 0.86** | 0.98** |
| Gs of flag leaf at mid-grain-filling stage | 0.92** | 0.93** | 0.95** | 0.92** |
| Ci of flag leaf at mid-grain-filling stage | -0.66* | -0.69* | -0.59 | -0.87** |
| SOD activity in leaf at 30 DAH | 0.93** | 0.83** | 0.67* | 0.84** |
| CAT activity in leaf at 30 DAH | 0.92** | 0.93** | 0.96** | 0.82** |
| APX activity in leaf at 30 DAH | 0.83** | 0.83** | 0.87** | 0.85** |
| MDA content in leaf at 30 DAH | -0.96** | -0.97** | -0.94** | -0.84** |
| H2O2 content in leaf at 30 DAH | -0.91** | -0.93** | -0.92** | -0.89** |
| O2·̄ content in leaf at 30 DAH | -0.96** | -0.97** | -0.96** | -0.88** |
| [1] | Alharby H F, Fahad S. 2020. Melatonin application enhances biochar efficiency for drought tolerance in maize varieties: Modifications in physio-biochemical machinery. Agron J, 112(4): 2826-2847. |
| [2] | Ali S, Gautam R K, Mahajan R, Krishnamurthy S L, Sharma S K, Singh R K, Ismail A M. 2013. Stress indices and selectable traits in SALTOL QTL introgressed rice genotypes for reproductive stage tolerance to sodicity and salinity stresses. Field Crops Res, 154: 65-73. |
| [3] | Ambavaram M M R, Basu S, Krishnan A, Ramegowda V, Batlang U, Rahman L, Baisakh N, Pereira A. 2014. Coordinated regulation of photosynthesis in rice increases yield and tolerance to environmental stress. Nat Commun, 5: 5302. |
| [4] | Asch F, Dingkuhn M, Sow A, Audebert A. 2005. Drought-induced changes in rooting patterns and assimilate partitioning between root and shoot in upland rice. Field Crops Res, 93(2/3): 223-236. |
| [5] | Aslam M M, Rashid M A R, Siddiqui M A, Khan M T, Farhat F, Yasmeen S, Khan I A, Raja S, Rasool F, Sial M A, Zhao Y. 2022. Recent insights into signaling responses to cope drought stress in rice. Rice Sci, 29(2): 105-117. |
| [6] | Basu S, Kumar A, Benazir I, Kumar G. 2021. Reassessing the role of ion homeostasis for improving salinity tolerance in crop plants. Physiol Plant, 171(4): 502-519. |
| [7] | Chaves M M, Flexas J, Pinheiro C. 2009. Photosynthesis under drought and salt stress: Regulation mechanisms from whole plant to cell. Ann Bot, 103(4): 551-560. |
| [8] | Cominelli E, Conti L, Tonelli C, Galbiati M. 2013. Challenges and perspectives to improve crop drought and salinity tolerance. New Biotechnol, 30(4): 355-361. |
| [9] | Danish S, Zafar-ul-Hye M, Fahad S, Saud S, Brtnicky M, Hammerschmiedt T, Datta R. 2020. Drought stress alleviation by ACC deaminase producing Achromobacter xylosoxidans and Enterobacter cloacae, with and without timber waste biochar in maize. Sustainability, 12(15): 6286. |
| [10] | Das K, Roychoudhury A. 2014. Reactive oxygen species (ROS) and response of antioxidants as ROS-scavengers during environmental stress in plants. Front Environ Sci, 2: 53. |
| [11] | Fahad S, Hussain S, Matloob A, Khan F A, Khaliq A, Saud S, Hassan S, Shan D, Khan F, Ullah N, Faiq M, Khan M R, Tareen A K, Khan A, Ullah A, Ullah N, Huang J L. 2015. Phytohormones and plant responses to salinity stress: A review. Plant Growth Regul, 75(2): 391-404. |
| [12] | Fahad S, Bajwa A A, Nazir U, Anjum S A, Farooq A, Zohaib A, Sadia S, Nasim W, Adkins S, Saud S, Ihsan M Z, Alharby H, Wu C, Wang D P, Huang J L. 2017. Crop production under drought and heat stress: Plant responses and management options. Front Plant Sci, 8: 1147. |
| [13] | Ganapati R K, Naveed S A, Zafar S, Wang W S, Xu J L. 2022. Saline-alkali tolerance in rice: physiological response, molecular mechanism, and qtl identification and application to breeding. Rice Sci, 29(5): 412-434. |
| [14] | Gautam P, Nayak A K, Lal B, Bhattacharyya P, Tripathi R, Shahid M, Mohanty S, Raja R, Panda B B. 2014. Submergence tolerance in relation to application time of nitrogen and phosphorus in rice (Oryza sativa L.). Environ Exp Bot, 99: 159-166. |
| [15] | Gross B L, Zhao Z J. 2014. Archaeological and genetic insights into the origins of domesticated rice. Proc Natl Acad Sci USA, 111(17): 6190-6197. |
| [16] | Gu J F, Qiu M, Yang J C. 2013. Enhanced tolerance to drought in transgenic rice plants overexpressing C4 photosynthesis enzymes. Crop J, 1(2): 105-114. |
| [17] | Hossain H, Rahman M A, Alam M S, Singh R K. 2015. Mapping of quantitative trait loci associated with reproductive-stage salt tolerance in rice. J Agron Crop Sci, 201(1): 17-31. |
| [18] | Huang H E, Ho M H, Chang H, Chao H Y, Ger M J. 2020. Over- expression of plant ferredoxin-like protein promotes salinity tolerance in rice (Oryza sativa). Plant Physiol Biochem, 155: 136-146. |
| [19] | Ilyas M, Nisar M, Khan N, Hazrat A, Khan A H, Hayat K, Fahad S, Khan A, Ullah A. 2021. Drought tolerance strategies in plants: A mechanistic approach. J Plant Growth Regul, 40(3): 926-944. |
| [20] | Jin Y, Yang H X, Wei Z, Ma H, Ge X C. 2013. Rice male development under drought stress: Phenotypic changes and stage-dependent transcriptomic reprogramming. Mol Plant, 6(5): 1630-1645. |
| [21] | Kobata T, Yoshida H, Masiko U, Honda T. 2013. Spikelet sterility is associated with a lack of assimilate in high-spikelet-number rice. Agron J, 105(6): 1821-1831. |
| [22] | Lima-Melo Y, Carvalho F E L, Martins M O, Passaia G, Sousa R H V, Neto M C L, Margis-Pinheiro M, Silveira J A G. 2016. Mitochondrial GPX1 silencing triggers differential photosynthesis impairment in response to salinity in rice plants. J Integr Plant Biol, 58(8): 737-748. |
| [23] | Liu J H, Shen J Q, Xu Y, Li X H, Xiao J H, Xiong L Z. 2016. Ghd2, a CONSTANS-like gene, confers drought sensitivity through regulation of senescence in rice. J Exp Bot, 67(19): 5785-5798. |
| [24] | Ma X S, Xia H, Liu Y H, Wei H B, Zheng X G, Song C Z, Chen L A, Liu H Y, Luo L J. 2016. Transcriptomic and metabolomic studies disclose key metabolism pathways contributing to well- maintained photosynthesis under the drought and the consequent drought-tolerance in rice. Front Plant Sci, 7: 1886. |
| [25] | Meng T Y, Zhang X B, Ge J L, Chen X, Yang Y L, Zhu G L, Chen Y L, Zhou G S, Wei H H, Dai Q G. 2021. Agronomic and physiological traits facilitating better yield performance of japonica/indica hybrids in saline fields. Field Crops Res, 271: 108255. |
| [26] | Mickelbart M V, Hasegawa P M, Bailey-Serres J. 2015. Genetic mechanisms of abiotic stress tolerance that translate to crop yield stability. Nat Rev Genet, 16(4): 237-251. |
| [27] | Miller G, Suzuki N, Ciftci-Yilmaz S, Mittler R. 2010. Reactive oxygen species homeostasis and signalling during drought and salinity stresses. Plant Cell Environ, 33(4): 453-467. |
| [28] | Mishra M, Wungrampha S, Kumar G, Singla-Pareek S L, Pareek A. 2021. How do rice seedlings of landrace Pokkali survive in saline fields after transplantation? Physiology, biochemistry, and photosynthesis. Photosynth Res, 150(1/3): 117-135. |
| [29] | Nahar S, Vemireddy L R, Sahoo L, Tanti B. 2018. Antioxidant protection mechanisms reveal significant response in drought- induced oxidative stress in some traditional rice of Assam, India. Rice Sci, 25(4): 185-196. |
| [30] | Nounjan N, Nghia P T, Theerakulpisut P. 2012. Exogenous proline and trehalose promote recovery of rice seedlings from salt-stress and differentially modulate antioxidant enzymes and expression of related genes. J Plant Physiol, 169(6): 596-604. |
| [31] | Okami M, Kato Y, Kobayashi N, Yamagishi J. 2015. Morphological traits associated with vegetative growth of rice (Oryza sativa L.) during the recovery phase after early-season drought. Eur J Agron, 64: 58-66. |
| [32] | Ouyang S Q, Liu Y F, Liu P, Lei G, He S J, Ma B, Zhang W K, Zhang J S, Chen S Y. 2010. Receptor-like kinase OsSIK1 improves drought and salt stress tolerance in rice (Oryza sativa) plants. Plant J, 62(2): 316-329. |
| [33] | Panda D, Mishra S S, Behera P K. 2021. Drought tolerance in rice: Focus on recent mechanisms and approaches. Rice Sci, 28(2): 119-132. |
| [34] | Peleg Z, Reguera M, Tumimbang E, Walia H, Blumwald E. 2011. Cytokinin-mediated source/sink modifications improve drought tolerance and increase grain yield in rice under water-stress. Plant Biotechnol J, 9(7): 747-758. |
| [35] | Pereira E G, Oliva M A, Rosado-Souza L, Mendes G C, Santos Colares D, Stopato C H, Almeida A M. 2013. Iron excess affects rice photosynthesis through stomatal and non-stomatal limitations. Plant Sci, 201/202: 81-92. |
| [36] | Praba M L, Cairns J E, Babu R C, Lafitte H R. 2009. Identification of physiological traits underlying cultivar differences in drought tolerance in rice and wheat. J Agron Crop Sci, 195(1): 30-46. |
| [37] | Prathap V, Ali K, Singh A, Vishwakarma C, Krishnan V, Chinnusamy V, Tyagi A. 2019. Starch accumulation in rice grains subjected to drought during grain filling stage. Plant Physiol Biochem, 142: 440-451. |
| [38] | Radanielson A M, Angeles O, Li T, Ismail A M, Gaydon D S. 2018. Describing the physiological responses of different rice genotypes to salt stress using sigmoid and piecewise linear functions. Field Crops Res, 220: 46-56. |
| [39] | Shailani A, Joshi R, Singla-Pareek S L, Pareek A. 2021. Stacking for future: Pyramiding genes to improve drought and salinity tolerance in rice. Physiol Plant, 172(2): 1352-1362. |
| [40] | Shi Y Y, Guo E J, Cheng X, Wang L Z, Jiang S K, Yang X L, Ma H Y, Zhang T Y, Li T, Yang X G. 2022. Effects of chilling at different growth stages on rice photosynthesis, plant growth, and yield. Environ Exp Bot, 203: 105045. |
| [41] | Smirnoff N, Arnaud D. 2019. Hydrogen peroxide metabolism and functions in plants. New Phytol, 221: 1197-1214. |
| [42] | Villa J E, Henry A, Xie F M, Serraj R. 2012. Hybrid rice performance in environments of increasing drought severity. Field Crops Res, 125: 14-24. |
| [43] | Wang J, Lin C Y, Han Z M, Fu C B, Huang D, Cheng H G. 2022. Dissolved nitrogen in salt-affected soils reclaimed by planting rice: How is it influenced by soil physicochemical properties? Sci Total Environ, 824: 153863. |
| [44] | Wang X X, Wang W C, Huang J L, Peng S B, Xiong D L. 2018a. Diffusional conductance to CO2 is the key limitation to photosynthesis in salt-stressed leaves of rice (Oryza sativa). Physiol Plant, 163(1): 45-58. |
| [45] | Wang X X, Du T T, Huang J L, Peng S B, Xiong D L. 2018b. Leaf hydraulic vulnerability triggers the decline in stomatal and mesophyll conductance during drought in rice. J Exp Bot, 69(16): 4033-4045. |
| [46] | Wei H H, Ge J L, Zhang X B, Meng T Y, Lu Y, Li X Y, Tao Y, Ding E H, Chen Y L, Dai Q G. 2020. Tillering characteristics and its relationships with population productivity of japonica rice Nanjing 9108 under salinity stress. Acta Agron Sin, 46(8): 1238-1247. (in Chinese with English abstract) |
| [47] | Wei H H, Meng T Y, Ge J L, Zhang X B, Shi T Y, Ding E H, Lu Y, Li X Y, Tao Y, Chen Y L, Li M, Dai Q G. 2021. Reduced nitrogen application rate with dense planting improves rice grain yield and nitrogen use efficiency: A case study in East China. Crop J, 9(4): 954-961. |
| [48] | Wei L X, Lv B S, Li X W, Wang M M, Ma H Y, Yang H Y, Yang R F, Piao Z Z, Wang Z H, Lou J H, Jiang C J, Liang Z W. 2017. Priming of rice (Oryza sativa L.) seedlings with abscisic acid enhances seedling survival, plant growth, and grain yield in saline-alkaline paddy fields. Field Crops Res, 203: 86-93. |
| [49] | Xie X F, Pu L J, Zhu M, Meadows M, Sun L C, Wu T, Bu X G, Xu Y. 2021. Differential effects of various reclamation treatments on soil characteristics: An experimental study of newly reclaimed tidal mudflats on the East China coast. Sci Total Environ, 768: 144996. |
| [50] | Xu Z K, Shao T Y, Lv Z X, Yue Y, Liu A H, Long X H, Zhou Z S, Gao X M, Rengel Z. 2020. The mechanisms of improving coastal saline soils by planting rice. Sci Total Environ, 703: 135529. |
| [51] | Yang J C, Zhang J H. 2010. Crop management techniques to enhance harvest index in rice. J Exp Bot, 61(12): 3177-3189. |
| [52] | Zeng L H, Shannon M C. 2000. Effects of salinity on grain yield and yield components of rice at different seeding densities. Agron J, 92(3): 418-423. |
| [53] | Zheng C K, Zhou G H, Zhang Z Z, Li W, Peng Y B, Xie X Z. 2021. Moderate salinity stress reduces rice grain yield by influencing expression of grain number- and grain filling-associated genes. J Plant Growth Regul, 40(3): 1111-1120. |
| [54] | Zhu G L, Lu H T, Shi X X, Wang Y, Zhi W F, Chen X B, Liu J W, Ren Z, Shi Y, Ji Z Y, Jiao X R, Ibrahim M E H, Nimir N E A, Zhou G S. 2020. Nitrogen management enhanced plant growth, antioxidant ability, and grain yield of rice under salinity stress. Agron J, 112(1): 550-563. |
| No related articles found! |
| 阅读次数 | ||||||
|
全文 |
|
|||||
|
摘要 |
|
|||||