Rice Science ›› 2025, Vol. 32 ›› Issue (4): 537-548.DOI: 10.1016/j.rsci.2025.04.006
收稿日期:2024-12-11
接受日期:2025-04-08
出版日期:2025-07-28
发布日期:2025-08-06
. [J]. Rice Science, 2025, 32(4): 537-548.
| Trait | Mean | Range | Coefficient of variation (%) |
|---|---|---|---|
| APS (%) | 71.05 ± 16.54 | 11.76-100.00 | 23.2 |
| RL (cm) | 8.85 ± 1.89 | 3.2-14.8 | 21.3 |
| RRSNK | 2.65 ± 1.27 | 0.83-9.22 | 47.7 |
| RSKC | 0.58 ± 0.19 | 0.06-2.99 | 32.7 |
| RSNC | 1.39 ± 0.46 | 0.14-6.12 | 32.7 |
| SAT | 5.9 ± 1.8 | 1-9 | 30.3 |
| SDW (mg) | 18.98 ± 8.19 | 2.25-49.63 | 43.1 |
| SKC (mmol/L) | 0.46 ± 0.22 | 0.06-1.08 | 48.2 |
| SL (cm) | 16.66 ± 3.41 | 6.7-29.2 | 20.4 |
| SNC (mmol/L) | 0.58 ± 0.13 | 0.17-0.82 | 22.2 |
| SNK | 1.56 ± 0.74 | 0.52-5.42 | 47.6 |
| SRR | 1.95 ± 0.52 | 0.82-4.68 | 26.4 |
| SSD (d) | 17.63 ± 1.95 | 12.0-29.0 | 11.0 |
Table 1. Statistical summary of 13 alkaline stress-related traits measured in this study.
| Trait | Mean | Range | Coefficient of variation (%) |
|---|---|---|---|
| APS (%) | 71.05 ± 16.54 | 11.76-100.00 | 23.2 |
| RL (cm) | 8.85 ± 1.89 | 3.2-14.8 | 21.3 |
| RRSNK | 2.65 ± 1.27 | 0.83-9.22 | 47.7 |
| RSKC | 0.58 ± 0.19 | 0.06-2.99 | 32.7 |
| RSNC | 1.39 ± 0.46 | 0.14-6.12 | 32.7 |
| SAT | 5.9 ± 1.8 | 1-9 | 30.3 |
| SDW (mg) | 18.98 ± 8.19 | 2.25-49.63 | 43.1 |
| SKC (mmol/L) | 0.46 ± 0.22 | 0.06-1.08 | 48.2 |
| SL (cm) | 16.66 ± 3.41 | 6.7-29.2 | 20.4 |
| SNC (mmol/L) | 0.58 ± 0.13 | 0.17-0.82 | 22.2 |
| SNK | 1.56 ± 0.74 | 0.52-5.42 | 47.6 |
| SRR | 1.95 ± 0.52 | 0.82-4.68 | 26.4 |
| SSD (d) | 17.63 ± 1.95 | 12.0-29.0 | 11.0 |

Fig. 1. Phenotypic distributions and correlations. A, Box plots of 13 alkaline stress-related traits over 5 subpopulations. Different lowercase letters above boxes indicate significant differences by the Duncan’s multiple comparison test (P < 0.05). B, Correlations among 13 traits in whole population. The number in the middle of the cell is the Pearson correlation coefficient. The lower left section shows scatter plots between each pair of traits. *, **, and *** refer to significant correlations at the 0.05, 0.01, and 0.001 levels, respectively, by the Duncan’s multiple comparison test. APS, Average percent of survival; RL, Root length; RRSNK, Relative shoot Na+/K+ ratio; RSKC, Relative shoot K+ concentration; RSNC, Relative shoot Na+ concentration; SDW, Shoot dry weight; SRR, Shoot/root length ratio; SSD, Seedling survival day; SAT, Score of alkaline tolerance; SL, Shoot length; SNK, Shoot Na+/K+ ratio; SKC, Shoot K+ concentration; SNC, Shoot Na+ concentration.
| Region/site (bp) | Trait | QTL | Associated SNP | Allele | P-value (Population) |
|---|---|---|---|---|---|
| 24 747 225-24 894 638 | RSNC | qRSNC2 | Chr2_24747225 | A/T | 5.66e-06 (X) |
| SKC | qSKC2.2 | Chr2_24791853 (W), Chr2_24894638(X) | T/C | 4.11e-06 (W) and 5.49e-06 (X) | |
| SDW | qSDW2.1 | Chr2_24804466 | A/G | 3.54e-06 (X) | |
| 16 166 423-16 368 589 | SRR | qSRR3 | Chr3_16166423 | G/A | 8.97e-07 (W) |
| RRSNK | qRRSNK3.1 | Chr3_16205409 | T/C | 4.33e-06 (G) | |
| RL | qRL3 | Chr3_16368589 | T/C | 4.18e-08 (W) | |
| 27 922 862-27 970 709 | SSD | qSSD3.1 | Chr3_27970709(W), Chr3_27922862(X) | C/T | 2.80e-07 (W) and 2.19e-06 (X) |
| RRSNK | qRRSNK3.3 | Chr3_27933314 | C/T | 3.78e-06 (X) | |
| SNK | qSNK3.1 | Chr3_27933314 | C/T | 4.72e-06 (X) | |
| 27 947 287-27 964 670 | SKC | qSKC5 | Chr5_27947287 | A/G | 2.10e-06 (W) |
| RRSNK | qRRSNK5 | Chr5_27957906 | G/A | 3.48e-06 (X) | |
| SNK | qSNK5.3 | Chr5_27958502 | C/T | 5.50e-06 (X) | |
| RSKC | qRSKC5 | Chr5_27964670 | T/C | 5.40e-07 (G) | |
| 17 410 717-17 710 717 | RRSNK | qRRSNK10 | Chr10_17560717 | G/A | 4.61e-07 (G) |
| SKC | qSKC10 | Chr10_17560717 | G/A | 2.63e-06 (G) | |
| 532 520-557 541 | SSD | qSSD12.1 | Chr12_532520 | T/A | 1.66e-06 (W) |
| SAT | qSAT12.1 | Chr12_541289 | T/C | 1.47e-06 (W) | |
| SDW | qSDW12 | Chr12_557541 | C/T | 2.76e-06 (X) | |
| SNC | qSNC12 | Chr12_557541 | C/T | 4.94e-07 (X) |
Table 2. Six important regions detected for different alkaline stress-related traits.
| Region/site (bp) | Trait | QTL | Associated SNP | Allele | P-value (Population) |
|---|---|---|---|---|---|
| 24 747 225-24 894 638 | RSNC | qRSNC2 | Chr2_24747225 | A/T | 5.66e-06 (X) |
| SKC | qSKC2.2 | Chr2_24791853 (W), Chr2_24894638(X) | T/C | 4.11e-06 (W) and 5.49e-06 (X) | |
| SDW | qSDW2.1 | Chr2_24804466 | A/G | 3.54e-06 (X) | |
| 16 166 423-16 368 589 | SRR | qSRR3 | Chr3_16166423 | G/A | 8.97e-07 (W) |
| RRSNK | qRRSNK3.1 | Chr3_16205409 | T/C | 4.33e-06 (G) | |
| RL | qRL3 | Chr3_16368589 | T/C | 4.18e-08 (W) | |
| 27 922 862-27 970 709 | SSD | qSSD3.1 | Chr3_27970709(W), Chr3_27922862(X) | C/T | 2.80e-07 (W) and 2.19e-06 (X) |
| RRSNK | qRRSNK3.3 | Chr3_27933314 | C/T | 3.78e-06 (X) | |
| SNK | qSNK3.1 | Chr3_27933314 | C/T | 4.72e-06 (X) | |
| 27 947 287-27 964 670 | SKC | qSKC5 | Chr5_27947287 | A/G | 2.10e-06 (W) |
| RRSNK | qRRSNK5 | Chr5_27957906 | G/A | 3.48e-06 (X) | |
| SNK | qSNK5.3 | Chr5_27958502 | C/T | 5.50e-06 (X) | |
| RSKC | qRSKC5 | Chr5_27964670 | T/C | 5.40e-07 (G) | |
| 17 410 717-17 710 717 | RRSNK | qRRSNK10 | Chr10_17560717 | G/A | 4.61e-07 (G) |
| SKC | qSKC10 | Chr10_17560717 | G/A | 2.63e-06 (G) | |
| 532 520-557 541 | SSD | qSSD12.1 | Chr12_532520 | T/A | 1.66e-06 (W) |
| SAT | qSAT12.1 | Chr12_541289 | T/C | 1.47e-06 (W) | |
| SDW | qSDW12 | Chr12_557541 | C/T | 2.76e-06 (X) | |
| SNC | qSNC12 | Chr12_557541 | C/T | 4.94e-07 (X) |

Fig. 2. Candidate gene analysis associated with qSSD3.1 in whole population on chromosome 3. A, High-density association analysis of qSSD3.1. B-E, Structure of candidate genes [LOC_Os03g49040 (B), LOC_Os03g49050 (C), LOC_Os03g49080 (D), and LOC_Os03g49090 (E)] and their haplotype analysis for seedling survival day (SSD) in the whole population. Different lowercase letters on top of box plots indicate significant differences based on Duncan’s multiple comparison test (P < 0.05).
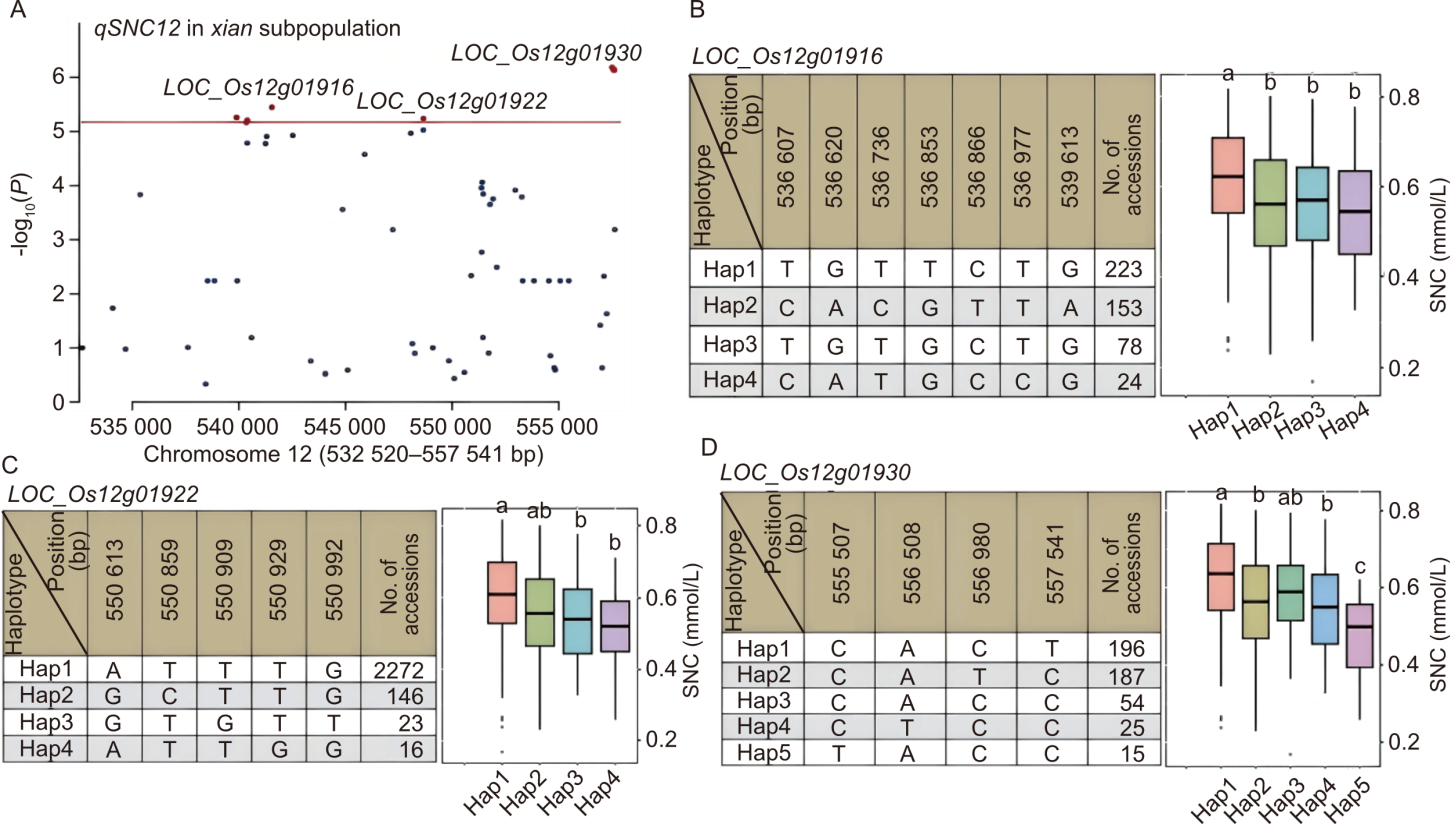
Fig. 3. Candidate gene analysis associated with qSNC12 in xian subpopulation on chromosome 12. A, High-density association analysis of qSNC12. B-D, Structure of candidate genes [LOC_Os12g01916 (B), LOC_Os12g01922 (C), and LOC_Os12g01930 (D)] and their haplotype analysis for shoot Na+ concentration (SNC) in xian subpopulation. Different lowercase letters on top of box plots indicate significant differences based on Duncan’s multiple comparison test (P < 0.05).
| [1] | Alexandrov N, Tai S S, Wang W S, et al. 2015. SNP-Seek database of SNPs derived from 3000 rice genomes. Nucleic Acids Res, 43: D1023-D1027. |
| [2] | Bao Y W, Huang L H, Li Y Y, et al. 2019. How different nitrogen application rates affect yield composition and nitrogen uptake of rice (Oryza sativa L.) in a saline-sodic paddy field. Pol J Environ Stud, 28(2): 553-564. |
| [3] | Bunsupa S, Katayama K, Ikeura E, et al. 2012. Lysine decarboxylase catalyzes the first step of quinolizidine alkaloid biosynthesis and coevolved with alkaloid production in Leguminosae. Plant Cell, 24(3): 1202-1216. |
| [4] | Buti M, Baldoni E, Formentin E, et al. 2019. A meta-analysis of comparative transcriptomic data reveals a set of key genes involved in the tolerance to abiotic stresses in rice. Int J Mol Sci, 20(22): 5662. |
| [5] | Chen E Y, Shen B. 2022. OsABT, a rice WD40 domain-containing protein, is involved in abiotic stress tolerance. Rice Sci, 29(3): 247-256. |
| [6] | Chen W C, Cui P J, Sun H Y, et al. 2009. Comparative effects of salt and alkali stresses on organic acid accumulation and ionic balance of seabuckthorn (Hippophae rhamnoides L.). Ind Crops Prod, 30(3): 351-358. |
| [7] | Cheng H T, Jiang H, Xue D W, et al. 2008. Mapping of QTL underlying tolerance to alkali at germination and early seedling stages in rice. Acta Agron Sin, 34(10): 1719-1727. (in Chinese with English abstract) |
| [8] | Chouchane H, Krol M S, Hoekstra A Y. 2018. Expected increase in staple crop imports in water-scarce countries in 2050. Water Res X, 1: 100001. |
| [9] | Damien J, Patten A H, Ismail A. 2021. Phenotyping Protocols for Abiotic Stress Tolerance in Rice. Manila, the Philippines: International Rice Research Institute (IRRI). |
| [10] | Ganapati R K, Naveed S A, Zafar S, et al. 2022. Saline-alkali tolerance in rice: Physiological response, molecular mechanism, and QTL identification and application to breeding. Rice Sci, 29(5): 412-434. |
| [11] | Gao X Y, Zhang Y, Zhang H S, et al. 2022. A β-ketoacyl-CoA synthase OsCUT1 confers increased drought tolerance in rice. Rice Sci, 29(4): 353-362. |
| [12] | Ge L, Guo H M, Li X, et al. 2022. OsSIDP301, a member of the DUF1644 family, negatively regulates salt stress and grain size in rice. Front Plant Sci, 13: 863233. |
| [13] | Guo M X, Wang R C, Wang J, et al. 2014. ALT1, a Snf2 family chromatin remodeling ATPase, negatively regulates alkaline tolerance through enhanced defense against oxidative stress in rice. PLoS One, 9(12): e112515. |
| [14] | Kang H M, Sul J H, Service S K, et al. 2010. Variance component model to account for sample structure in genome-wide association studies. Nat Genet, 42(4): 348-354. |
| [15] | Kim J H, Lim S D, Jung K H, et al. 2023. Overexpression of a C3HC4-type RING E3 ligase gene, OsRFPHC-13, improves salinity resistance in rice, Oryza sativa, by altering the expression of Na+/K+ transporter genes. Environ Exp Bot, 207: 105224. |
| [16] | Kongdin M, Mahong B, Lee S K, et al. 2021. Action of multiple rice β-glucosidases on abscisic acid glucose ester. Int J Mol Sci, 22(14): 7593. |
| [17] | Kumari V V, Banerjee P, Verma V C, et al. 2022. Plant nutrition: An effective way to alleviate abiotic stress in agricultural crops. Int J Mol Sci, 23(15): 8519. |
| [18] | Li L H, Lv M M, Zhao L, et al. 2018. Molecular characterization and function analysis of the rice OsDUF829 family. Biotechnol Biotechnol Equip, 32(3): 550-557. |
| [19] | Li M X, Yeung J M Y, Cherny S S, et al. 2012. Evaluating the effective numbers of independent tests and significant p-value thresholds in commercial genotyping arrays and public imputation reference datasets. Hum Genet, 131(5): 747-756. |
| [20] | Li N, Sun J, Wang J G, et al. 2017. QTL analysis for alkaline tolerance of rice and verification of a major QTL. Plant Breed, 136(6): 881-891. |
| [21] | Li N, Zheng H L, Cui J N, et al. 2019. Genome-wide association study and candidate gene analysis of alkalinity tolerance in japonica rice germplasm at the seedling stage. Rice, 12(1): 24. |
| [22] | Li X W, Zheng H L, Wu W S, et al. 2020. QTL mapping and candidate gene analysis for alkali tolerance in japonica rice at the bud stage based on linkage mapping and genome-wide association study. Rice, 13(1): 48. |
| [23] | Liang J L, Qu Y P, Yang C G, et al. 2015. Identification of QTLs associated with salt or alkaline tolerance at the seedling stage in rice under salt or alkaline stress. Euphytica, 201(3): 441-452. |
| [24] | Liu J, Shabala S, Shabala L, et al. 2019. Tissue-specific regulation of Na+ and K+ transporters explains genotypic differences in salinity stress tolerance in rice. Front Plant Sci, 10: 1361. |
| [25] | Mei S, Zhang G G, Jiang J, et al. 2022. Combining genome-wide association study and gene-based haplotype analysis to identify candidate genes for alkali tolerance at the germination stage in rice. Front Plant Sci, 13: 887239. |
| [26] | Mirdar Mansuri R, Shobbar Z S, Babaeian Jelodar N B, et al. 2019. Dissecting molecular mechanisms underlying salt tolerance in rice: A comparative transcriptional profiling of the contrasting genotypes. Rice, 12(1): 13. |
| [27] | Møller I S, Gilliham M, Jha D, et al. 2009. Shoot Na+ exclusion and increased salinity tolerance engineered by cell type-specific alteration of Na+ transport in Arabidopsis. Plant Cell, 21(7): 2163-2178. |
| [28] | Naveed S A, Zhang F, Zhang J, et al. 2018. Identification of QTN and candidate genes for salinity tolerance at the germination and seedling stages in rice by genome-wide association analyses. Sci Rep, 8(1): 6505. |
| [29] | Palmer T M, Lawlor D A, Harbord R M, et al. 2012. Using multiple genetic variants as instrumental variables for modifiable risk factors. Stat Methods Med Res, 21(3): 223-242. |
| [30] | Peethambaran P K, Glenz R, Höninger S, et al. 2018. Salt-inducible expression of OsJAZ8 improves resilience against salt-stress. BMC Plant Biol, 18(1): 311. |
| [31] | Purcell S, Neale B, Todd-Brown K, et al. 2007. PLINK: A tool set for whole-genome association and population-based linkage analyses. Am J Hum Genet, 81(3): 559-575. |
| [32] | Qi D L, Guo G Z, Lee M C, et al. 2008. Identification of quantitative trait loci for the dead leaf rate and the seedling dead rate under alkaline stress in rice. J Genet Genomics, 35(5): 299-305. |
| [33] | Rao P S, Mishra B, Gupta S R. 2013. Effects of soil salinity and alkalinity on grain quality of tolerant, semi-tolerant and sensitive rice genotypes. Rice Sci, 20(4): 284-291. |
| [34] | Rui C, Chen X G, Xu N, et al. 2022. Identification and structure analysis of KCS family genes suggest their reponding to regulate fiber development in long-staple cotton under salt-alkaline stress. Front Genet, 13: 812449. |
| [35] | Singh L, Coronejo S, Pruthi R, et al. 2022a. Genetic dissection of alkalinity tolerance at the seedling stage in rice (Oryza sativa) using a high-resolution linkage map. Plants, 11(23): 3347. |
| [36] | Singh L, Coronejo S, Pruthi R, et al. 2022b. Integration of QTL mapping and whole genome sequencing identifies candidate genes for alkalinity tolerance in rice (Oryza sativa). Int J Mol Sci, 23(19): 11791. |
| [37] | Singh L, Pruthi R, Chapagain S, et al. 2023. Genome-wide association study identified candidate genes for alkalinity tolerance in rice. Plants, 12(11): 2206. |
| [38] | Singh R K, Kota S, Flowers T J. 2021. Salt tolerance in rice: Seedling and reproductive stage QTL mapping come of age. Theor Appl Genet, 134(11): 3495-3533. |
| [39] | Tripathi A D, Mishra R, Maurya K K, et al. 2019. Estimates for world population and global food availability for global health. In: Singh R B, Watson R R, Takahashi T. The Role of Functional Food Security in Global Health. MA, USA: Academic Press: 3-24. |
| [40] | Wang H, Takano T, Liu S K. 2018. Screening and evaluation of saline-alkaline tolerant germplasm of rice (Oryza sativa L.) in soda saline-alkali soil. Agronomy, 8(10): 205. |
| [41] | Wang W S, Mauleon R, Hu Z Q, et al. 2018. Genomic variation in 3, 010 diverse accessions of Asian cultivated rice. Nature, 557: 43-49. |
| [42] | Wang X Q, Pang Y L, Wang C C, et al. 2017. New candidate genes affecting rice grain appearance and milling quality detected by genome-wide and gene-based association analyses. Front Plant Sci, 7: 1998. |
| [43] | Waseem M, Aslam M M, Shaheen I. 2021. The DUF221 domain-containing (DDP) genes identification and expression analysis in tomato under abiotic and phytohormone stress. GM Crops Food, 12(1): 586-599. |
| [44] | Xi Y, Ye L D, Yu H W. 2022. Enhanced thermal and alkaline stability of L-lysine decarboxylase CadA by combining directed evolution and computation-guided virtual screening. Bioresour Bioprocess, 9(1): 24. |
| [45] | Yang J, Lee S H, Goddard M E, et al. 2011. GCTA: A tool for genome-wide complex trait analysis. Am J Hum Genet, 88(1): 76-82. |
| [46] | Yang Z, Yang X, Dong S J, et al. 2020. Overexpression of β-ketoacyl-CoA synthase from Vitis vinifera L. improves salt tolerance in Arabidopsis thaliana. Front Plant Sci, 11: 564385. |
| [47] | Zang J P, Sun Y, Wang Y, et al. 2008. Dissection of genetic overlap of salt tolerance QTLs at the seedling and tillering stages using backcross introgression lines in rice. Sci China C: Life Sci, 51(7): 583-591. |
| [48] | Zeng W, Li H, Zhang F L, et al. 2023. Functional characterization and allelic mining of OsGLR genes for potential uses in rice improvement. Front Plant Sci, 14: 1236251. |
| [49] | Zhang C, Dong S S, Xu J Y, et al. 2019. PopLDdecay: A fast and effective tool for linkage disequilibrium decay analysis based on variant call format files. Bioinformatics, 35(10): 1786-1788. |
| [50] | Zhang D P, Wang Y Z, Shen J Y, et al. 2018. OsRACK1A, encodes a circadian clock-regulated WD40 protein, negatively affect salt tolerance in rice. Rice, 11(1): 45. |
| [51] | Zhu F J, Wang K, Li D N, et al. 2022. OsSAP6 positively regulates soda saline-alkaline stress tolerance in rice. Rice, 15: 69. |
| [52] | Zhu N, Cheng S F, Liu X Y, et al. 2015. The R2R3-type MYB gene OsMYB91 has a function in coordinating plant growth and salt stress tolerance in rice. Plant Sci, 236: 146-156. |
| [53] | Zou J, Liu C F, Liu A L, et al. 2012. Overexpression of OsHsp17.0 and OsHsp23.7 enhances drought and salt tolerance in rice. J Plant Physiol, 169(6): 628-635. |
| No related articles found! |
| 阅读次数 | ||||||
|
全文 |
|
|||||
|
摘要 |
|
|||||