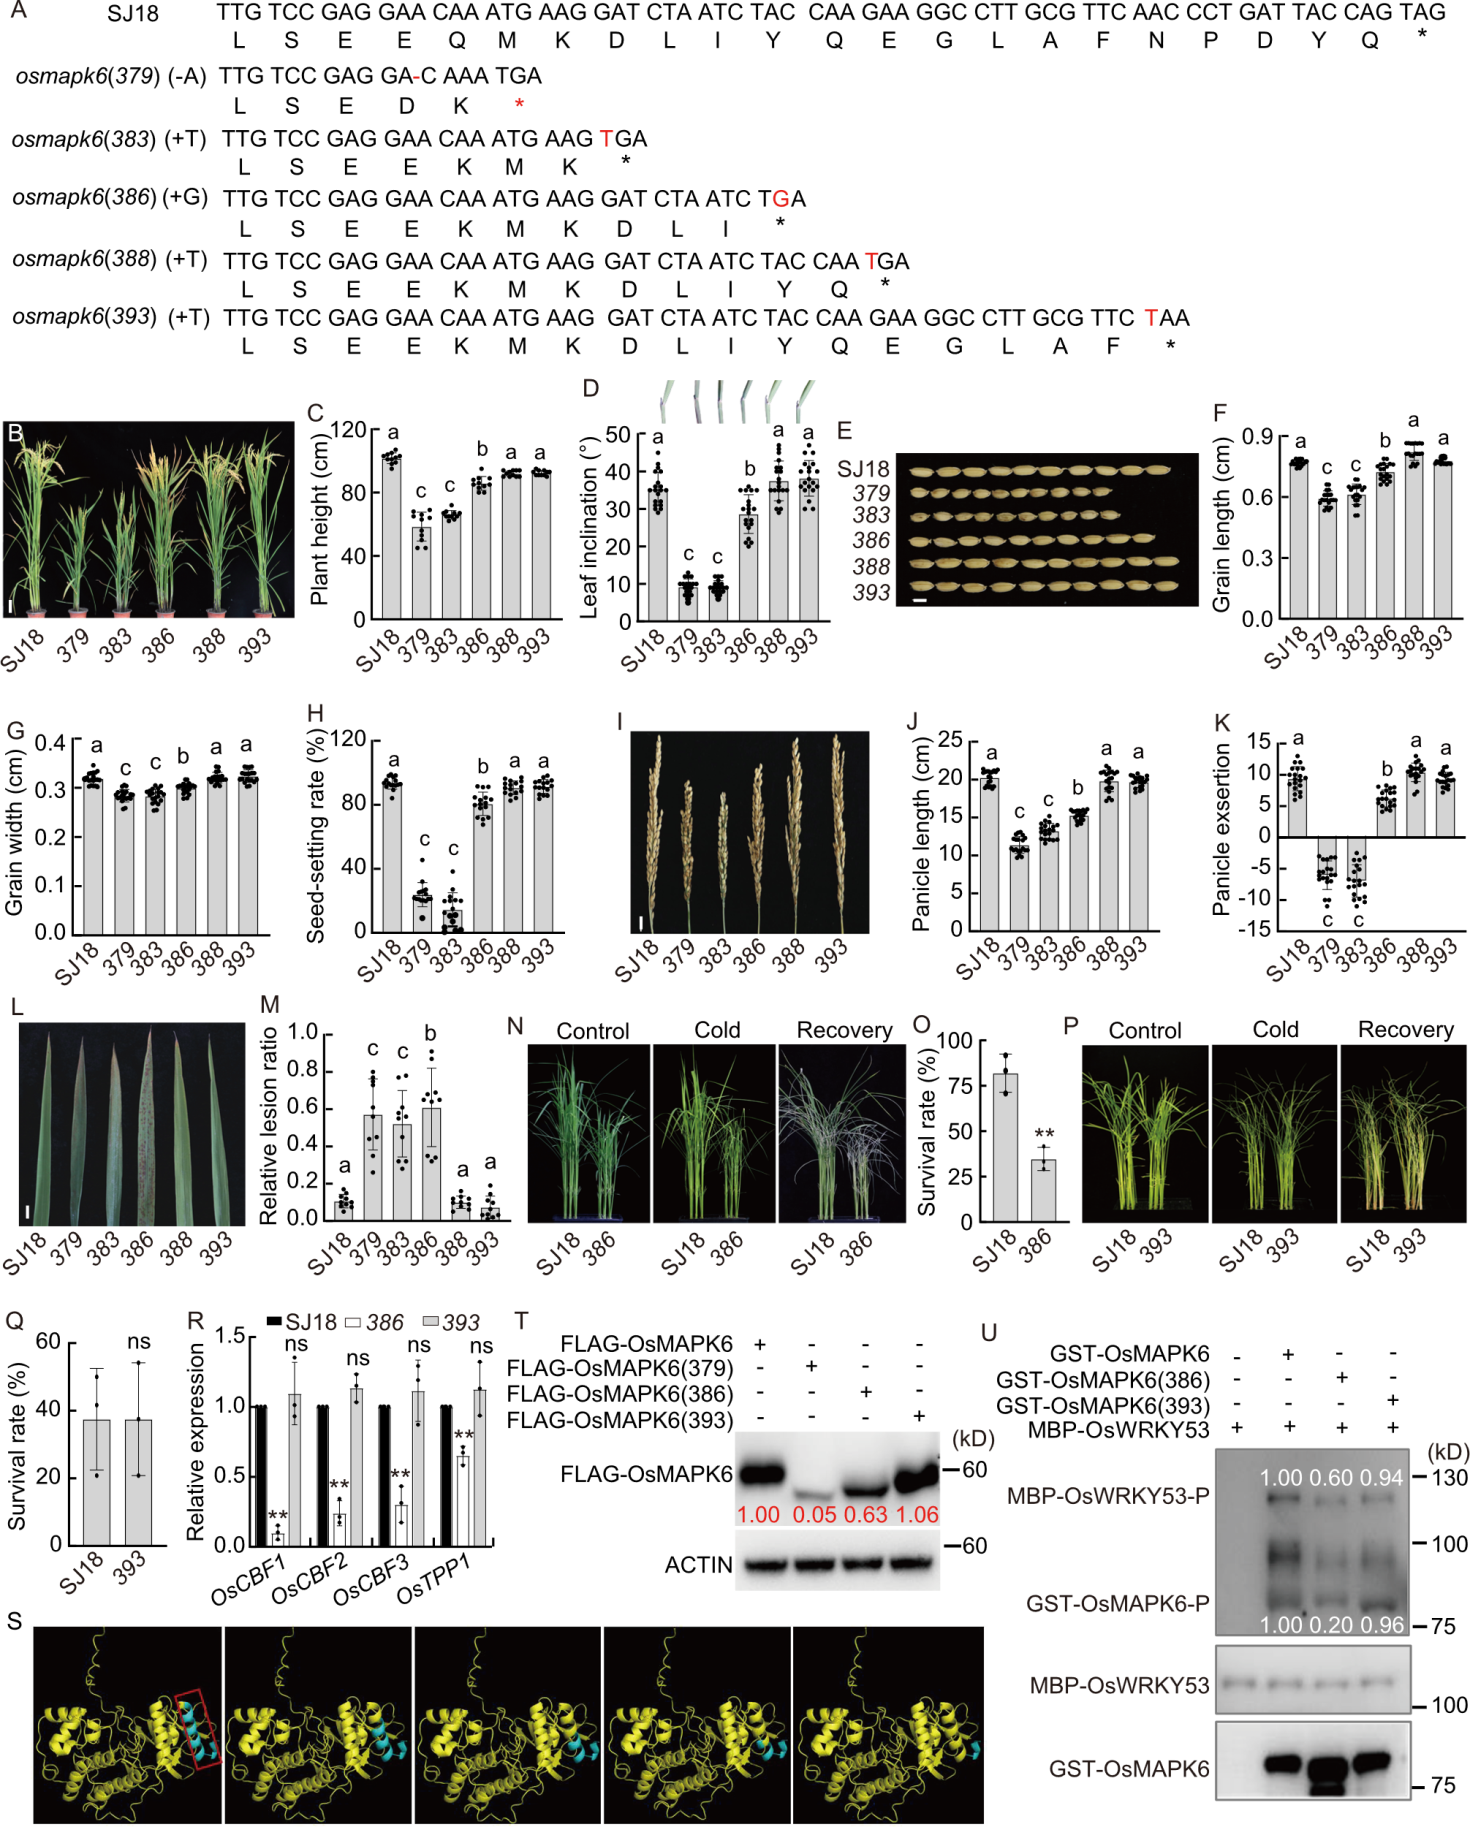
Fig. 1. Effects of varying C-terminal truncation lengths in OsMAPK6 on rice growth, development, and stress responses. A, Schematic representation of C-terminal coding sequences and corresponding protein sequences of OsMAPK6 in Suijing 18 (SJ18, wild type), osmapk6(379), osmapk6(383), osmapk6(386), osmapk6(388), and osmapk6(393). The asterisk (*) indicates a stop codon; the dash (-) represents a deletion; red letters highlight inserted nucleotides. B, Gross morphology of SJ18, osmapk6(379), osmapk6(383), osmapk6(386), osmapk6(388), and osmapk6(393) at the heading stage. Scale bar, 10 cm. C and D, Plant height (C) and flag leaf lamina joint morphology and angle quantification (D) of SJ18, osmapk6(379), osmapk6(383), osmapk6(386), osmapk6(388), and osmapk6(393) at the maturity stage. E, Grain phenotype of SJ18, osmapk6(379), osmapk6(383), osmapk6(386), osmapk6(388), and osmapk6(393) at the maturity stage. Scale bar, 5 mm. F and G, Quantification of grain length (F) and grain width (G) from E. H, Seed-setting rate of SJ18, osmapk6(379), osmapk6(383), osmapk6(386), osmapk6(388), and osmapk6(393) at the maturity stage. I, Panicle morphology of SJ18, osmapk6(379), osmapk6(383), osmapk6(386), osmapk6(388), and osmapk6(393) at the maturity stage. Scale bar, 1 cm. J, Statistical analysis of panicle length based on I. K, Statistical analysis of panicle exsertion in SJ18, osmapk6(379), osmapk6(383), osmapk6(386), osmapk6(388), and osmapk6(393) at the maturity stage. L, Constitutive cell death lesions observed in SJ18, osmapk6(379), osmapk6(383), osmapk6(386), osmapk6(388), and osmapk6(393) at the heading stage. Scale bar, 1 cm. M, Relative lesion ratio quantified from L. N, Plant morphology of 2-week-old SJ18 and osmapk6(386) seedlings before treatment, after exposure to 4 ºC for 2 d, and following a 5-day recovery period. Experiments were repeated at least 3 times, with 24 independent seedlings per replicate. O, Survival rate of SJ18 and osmapk6(386) after 4 ºC treatment shown in N. P, Plant morphology of 2-week-old SJ18 and osmapk6(393) seedlings before treatment, after exposure to 4 ºC for 3 d, and following a 5-day recovery period. Experiments were repeated at least 3 times, with 24 independent seedlings per replicate. Q, Survival rate of SJ18 and osmapk6(393) after the 4 ºC treatment shown in P. R, Relative expression levels of OsCBF1, OsCBF2, OsCBF3, and OsTPP1 in leaves of 2-week-old SJ18, osmapk6(386), and osmapk6(393) plants, with ubiquitin as the internal reference. Expression in SJ18 was normalized to 1.0. Data are mean ± SD (n = 3). S, AlphaFold3-predicted structure of OsMAPK6, with the terminal α-helix highlighted by a red box. From left to right, the blue regions indicate predicted structural deletions in OsMAPK6(379), OsMAPK6(383), OsMAPK6(386), OsMAPK6(388), and OsMAPK6(393). T, Protein expression of FLAG-tagged OsMAPK6, OsMAPK6(379), OsMAPK6(386), and OsMAPK6(393) in rice protoplasts. Top: Western blot detected with anti-FLAG antibody. Bottom: Western blot detected with anti-ACTIN antibody. The numbers represent the relative ratio of FLAG-OsMAPK6 to ACTIN. U, In vitro phosphorylation of MBP-OsWRKY53 by GST-OsMAPK6, GST-OsMAPK6(386), and GST-OsMAPK6(393). Top, middle, and bottom panels correspond to western blots detected with Phos-tag Biotin BTL-104, anti-MBP antibody, and anti-GST antibody, respectively. The numbers represent the relative ratios of phosphorylated MBP-OsWRKY53-P to MBP-OsWRKY53 and phosphorylated GST-OsMAPK6-P to GST-OsMAPK6, respectively. In B‒R, 379 represents osmapk6(379), 383 represents osmapk6(383), 386 represents osmapk6(386), 388 represents osmapk6(388), 393 represents osmapk6(393). Each dot represents one biological replicate. Data are mean ± SE (n = 20 in C, D, F‒H, J, K, and M, and 3 in O and Q). Different lowercase letters above bars denote significant differences (P < 0.05, one-way ANOVA followed by Tukey’s test), and the asterisks indicate significant differences compared with SJ18 (**, P < 0.01, Student’s t-test).
Fig. 1. Effects of varying C-terminal truncation lengths in OsMAPK6 on rice growth, development, and stress responses. A, Schematic representation of C-terminal coding sequences and corresponding protein sequences of OsMAPK6 in Suijing 18 (SJ18, wild type), osmapk6(379), osmapk6(383), osmapk6(386), osmapk6(388), and osmapk6(393). The asterisk (*) indicates a stop codon; the dash (-) represents a deletion; red letters highlight inserted nucleotides. B, Gross morphology of SJ18, osmapk6(379), osmapk6(383), osmapk6(386), osmapk6(388), and osmapk6(393) at the heading stage. Scale bar, 10 cm. C and D, Plant height (C) and flag leaf lamina joint morphology and angle quantification (D) of SJ18, osmapk6(379), osmapk6(383), osmapk6(386), osmapk6(388), and osmapk6(393) at the maturity stage. E, Grain phenotype of SJ18, osmapk6(379), osmapk6(383), osmapk6(386), osmapk6(388), and osmapk6(393) at the maturity stage. Scale bar, 5 mm. F and G, Quantification of grain length (F) and grain width (G) from E. H, Seed-setting rate of SJ18, osmapk6(379), osmapk6(383), osmapk6(386), osmapk6(388), and osmapk6(393) at the maturity stage. I, Panicle morphology of SJ18, osmapk6(379), osmapk6(383), osmapk6(386), osmapk6(388), and osmapk6(393) at the maturity stage. Scale bar, 1 cm. J, Statistical analysis of panicle length based on I. K, Statistical analysis of panicle exsertion in SJ18, osmapk6(379), osmapk6(383), osmapk6(386), osmapk6(388), and osmapk6(393) at the maturity stage. L, Constitutive cell death lesions observed in SJ18, osmapk6(379), osmapk6(383), osmapk6(386), osmapk6(388), and osmapk6(393) at the heading stage. Scale bar, 1 cm. M, Relative lesion ratio quantified from L. N, Plant morphology of 2-week-old SJ18 and osmapk6(386) seedlings before treatment, after exposure to 4 ºC for 2 d, and following a 5-day recovery period. Experiments were repeated at least 3 times, with 24 independent seedlings per replicate. O, Survival rate of SJ18 and osmapk6(386) after 4 ºC treatment shown in N. P, Plant morphology of 2-week-old SJ18 and osmapk6(393) seedlings before treatment, after exposure to 4 ºC for 3 d, and following a 5-day recovery period. Experiments were repeated at least 3 times, with 24 independent seedlings per replicate. Q, Survival rate of SJ18 and osmapk6(393) after the 4 ºC treatment shown in P. R, Relative expression levels of OsCBF1, OsCBF2, OsCBF3, and OsTPP1 in leaves of 2-week-old SJ18, osmapk6(386), and osmapk6(393) plants, with ubiquitin as the internal reference. Expression in SJ18 was normalized to 1.0. Data are mean ± SD (n = 3). S, AlphaFold3-predicted structure of OsMAPK6, with the terminal α-helix highlighted by a red box. From left to right, the blue regions indicate predicted structural deletions in OsMAPK6(379), OsMAPK6(383), OsMAPK6(386), OsMAPK6(388), and OsMAPK6(393). T, Protein expression of FLAG-tagged OsMAPK6, OsMAPK6(379), OsMAPK6(386), and OsMAPK6(393) in rice protoplasts. Top: Western blot detected with anti-FLAG antibody. Bottom: Western blot detected with anti-ACTIN antibody. The numbers represent the relative ratio of FLAG-OsMAPK6 to ACTIN. U, In vitro phosphorylation of MBP-OsWRKY53 by GST-OsMAPK6, GST-OsMAPK6(386), and GST-OsMAPK6(393). Top, middle, and bottom panels correspond to western blots detected with Phos-tag Biotin BTL-104, anti-MBP antibody, and anti-GST antibody, respectively. The numbers represent the relative ratios of phosphorylated MBP-OsWRKY53-P to MBP-OsWRKY53 and phosphorylated GST-OsMAPK6-P to GST-OsMAPK6, respectively. In B‒R, 379 represents osmapk6(379), 383 represents osmapk6(383), 386 represents osmapk6(386), 388 represents osmapk6(388), 393 represents osmapk6(393). Each dot represents one biological replicate. Data are mean ± SE (n = 20 in C, D, F‒H, J, K, and M, and 3 in O and Q). Different lowercase letters above bars denote significant differences (P < 0.05, one-way ANOVA followed by Tukey’s test), and the asterisks indicate significant differences compared with SJ18 (**, P < 0.01, Student’s t-test).