Rice Science ›› 2024, Vol. 31 ›› Issue (3): 300-316.DOI: 10.1016/j.rsci.2024.02.008
收稿日期:2023-12-18
接受日期:2024-01-29
出版日期:2024-05-28
发布日期:2024-06-04
. [J]. Rice Science, 2024, 31(3): 300-316.
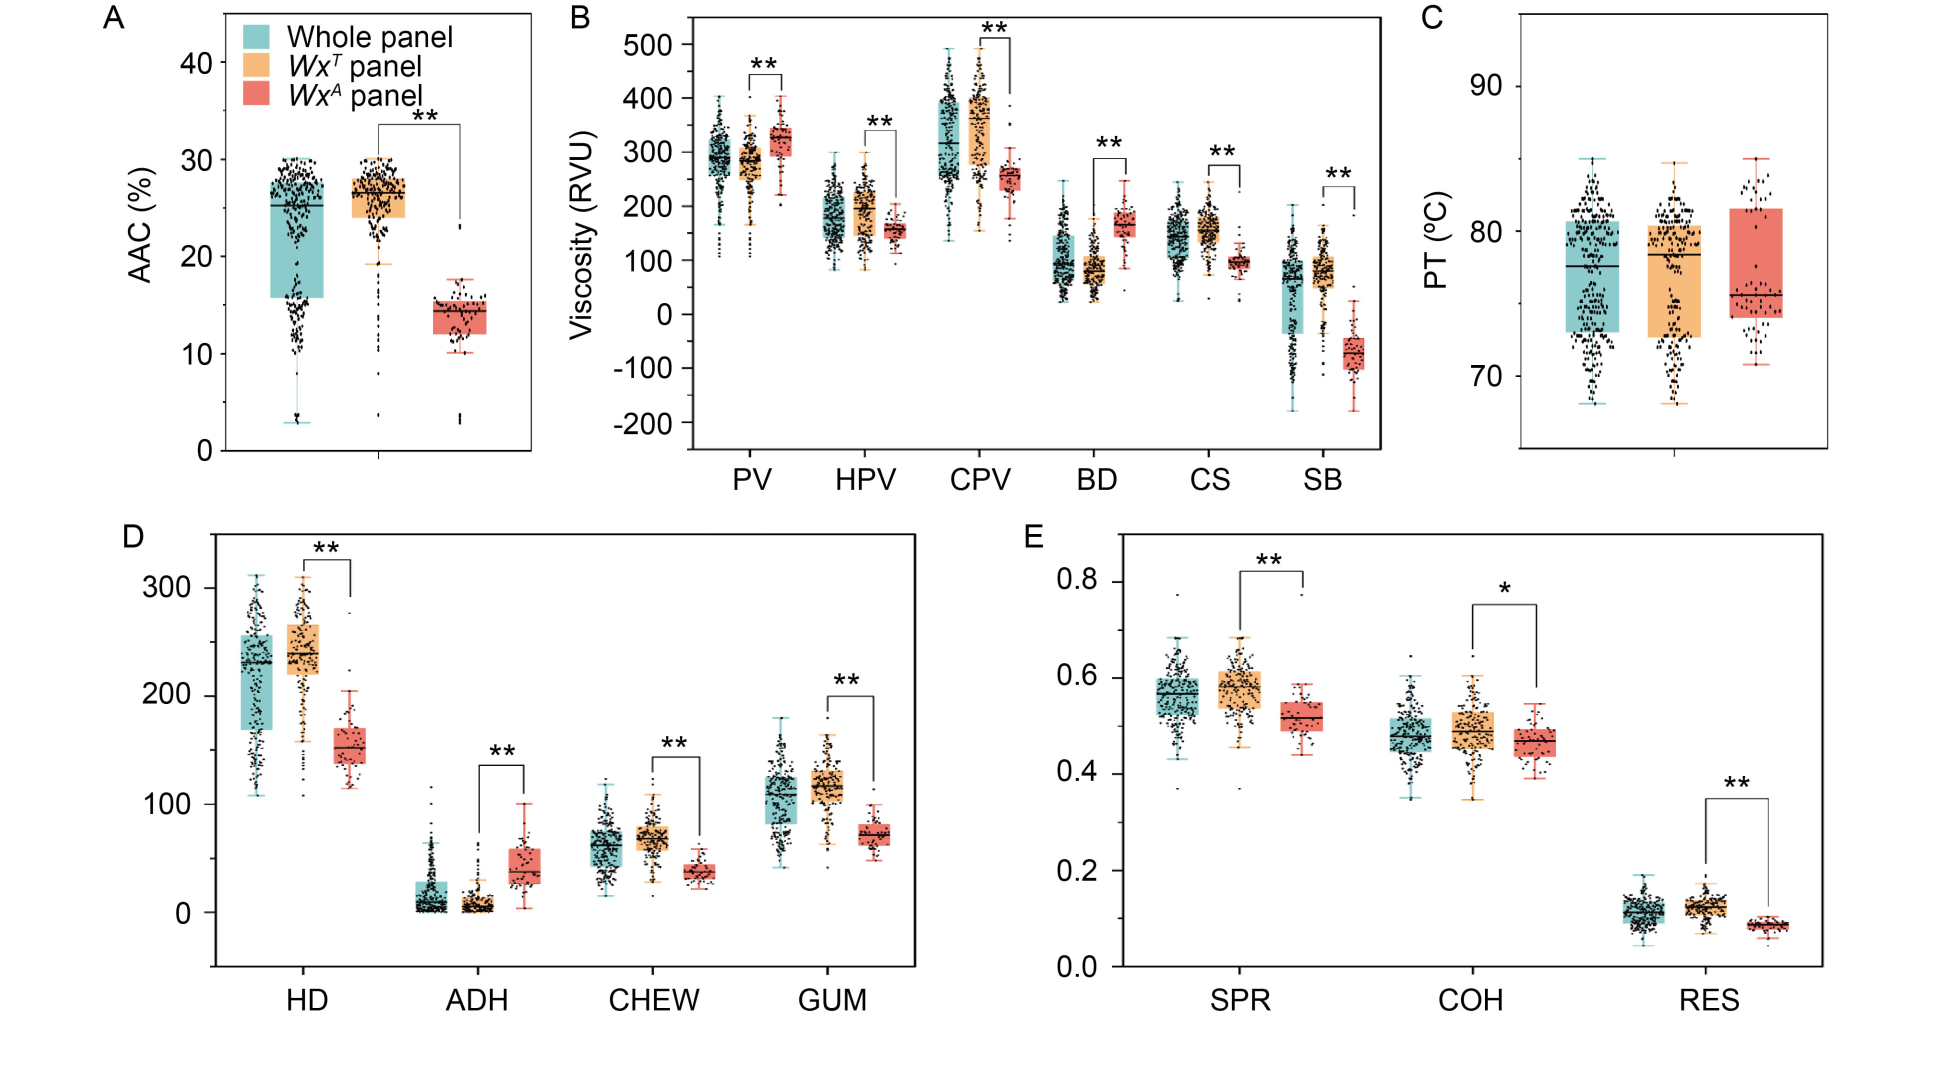
Fig. 1. Distributions of quality traits in three panels, whole, WxA, and WxT panels. A, Distribution of AAC. B and C, Distributions of pasting properties. D and E, Distributions of cooked rice textural properties. AAC, Apparent amylose content; PV, Peak viscosity; HPV, Hot paste viscosity; CPV, Cold paste viscosity; BD, Breakdown; CS, Consistency; SB, Setback; PT, Pasting temperature; HD, Hardness; ADH, Adhesiveness; CHEW, Chewiness; GUM, Gumminess; SPR, Springiness; COH, Cohesiveness; RES, Resilience. ** and * indicate the values between the two sub-panels are significantly different at P < 0.01 and P < 0.05, respectively.
| Parameter | Whole panel | WxT panel | WxA panel | |||||||||
|---|---|---|---|---|---|---|---|---|---|---|---|---|
| Mean ± SD | Range | Skewness | Kurtosis | Mean ± SD | Range | Skewness | Kurtosis | Mean ± SD | Range | Skewness | Kurtosis | |
| AAC (%) | 22.41 ± 6.52 | 2.90‒30.04 | -0.89 | -0.30 | 25.74 ± 4.21 | 3.68‒30.04 | -2.57 | 7.59 | 15.07 ± 4.77 | 2.90‒28.71 | 0.17 | 1.15 |
| PV (RVU) | 285.03 ± 54.58 | 106.88‒403.46 | -0.81 | 0.91 | 274.58 ± 55.06 | 106.88‒401.75 | -1.02 | 0.92 | 308.53 ± 47.9 | 201.42‒403.46 | -0.33 | -0.61 |
| HPV (RVU) | 180.91 ± 44.78 | 82.25‒299.59 | 0.18 | -0.80 | 194.75 ± 46.18 | 82.25‒299.59 | -0.35 | -0.62 | 153.26 ± 23.61 | 93.38‒239.71 | 0.38 | 1.39 |
| CPV (RVU) | 321.62 ± 78.37 | 136.25‒491.59 | 0.02 | -0.99 | 351.65 ± 73.21 | 154.92‒491.59 | -0.60 | -0.33 | 256.58 ± 43.26 | 136.25‒441.21 | 0.58 | 4.39 |
| BD (RVU) | 104.12 ± 49.91 | 22.63‒247.58 | 0.48 | -0.71 | 79.83 ± 36.21 | 22.63‒201.79 | 0.98 | 0.95 | 155.27 ± 37.2 | 63.59‒247.58 | -0.23 | -0.30 |
| CS (RVU) | 140.70 ± 41.84 | 23.84‒244.51 | -0.16 | -0.39 | 156.90 ± 35.33 | 29.30‒244.51 | -0.48 | 0.47 | 103.32 ± 30.42 | 23.84‒201.51 | 0.33 | 2.15 |
| SB (RVU) | 36.78 ± 80.88 | -179.04‒202.17 | -0.51 | -0.84 | 77.07 ± 54.21 | -112.54‒202.17 | -1.32 | 2.50 | -51.95 ± 56.72 | -179.04‒137.92 | 0.89 | 1.39 |
| PT (ºC) | 76.89 ± 4.17 | 68.10‒85.00 | -0.19 | -1.21 | 76.62 ± 4.38 | 68.10‒84.70 | -0.28 | -1.38 | 77.24 ± 3.82 | 70.80‒85.00 | 0.31 | -1.20 |
| HD (gf) | 217.07 ± 51.74 | 107.84‒311.66 | -0.32 | -1.02 | 241.79 ± 38.91 | 107.84‒311.66 | -1.04 | 1.55 | 163.60 ± 32.42 | 114.77‒263.67 | 0.88 | 0.55 |
| ADH (gf·s) | 18.62 ± 20.93 | 0.00‒115.89 | 1.55 | 2.37 | 9.34 ± 13.00 | 0.00‒64.15 | 2.64 | 6.99 | 38.68 ± 21.71 | 0.09‒115.89 | 1.00 | 1.47 |
| SPR | 0.56 ± 0.06 | 0.37‒0.77 | 0.02 | 0.47 | 0.58 ± 0.05 | 0.37‒0.68 | -0.48 | 1.18 | 0.53 ± 0.05 | 0.44‒0.77 | 1.59 | 5.79 |
| CHEW (gf) | 60.82 ± 20.98 | 15.25‒123.41 | 0.21 | -0.45 | 69.51 ± 17.68 | 15.25‒123.41 | 0.00 | 0.73 | 41.79 ± 13.03 | 21.79‒89.49 | 1.33 | 2.32 |
| GUM (gf) | 105.35 ± 29.19 | 41.27‒179.89 | 0.01 | -0.70 | 118.16 ± 23.66 | 41.27‒179.89 | -0.35 | 0.89 | 77.50 ± 18.21 | 48.30‒142.88 | 1.17 | 1.81 |
| COH | 0.48 ± 0.05 | 0.35‒0.65 | 0.28 | 0.17 | 0.49 ± 0.06 | 0.35‒0.65 | 0.15 | 0.20 | 0.47 ± 0.04 | 0.39‒0.58 | 0.42 | -0.16 |
| RES | 0.11 ± 0.03 | 0.04‒0.19 | 0.20 | -0.36 | 0.12 ± 0.02 | 0.07‒0.19 | 0.06 | 0.34 | 0.09 ± 0.02 | 0.04‒0.16 | 1.19 | 3.31 |
Table 1. Phenotypic variations in whole, WxT, and WxA panels.
| Parameter | Whole panel | WxT panel | WxA panel | |||||||||
|---|---|---|---|---|---|---|---|---|---|---|---|---|
| Mean ± SD | Range | Skewness | Kurtosis | Mean ± SD | Range | Skewness | Kurtosis | Mean ± SD | Range | Skewness | Kurtosis | |
| AAC (%) | 22.41 ± 6.52 | 2.90‒30.04 | -0.89 | -0.30 | 25.74 ± 4.21 | 3.68‒30.04 | -2.57 | 7.59 | 15.07 ± 4.77 | 2.90‒28.71 | 0.17 | 1.15 |
| PV (RVU) | 285.03 ± 54.58 | 106.88‒403.46 | -0.81 | 0.91 | 274.58 ± 55.06 | 106.88‒401.75 | -1.02 | 0.92 | 308.53 ± 47.9 | 201.42‒403.46 | -0.33 | -0.61 |
| HPV (RVU) | 180.91 ± 44.78 | 82.25‒299.59 | 0.18 | -0.80 | 194.75 ± 46.18 | 82.25‒299.59 | -0.35 | -0.62 | 153.26 ± 23.61 | 93.38‒239.71 | 0.38 | 1.39 |
| CPV (RVU) | 321.62 ± 78.37 | 136.25‒491.59 | 0.02 | -0.99 | 351.65 ± 73.21 | 154.92‒491.59 | -0.60 | -0.33 | 256.58 ± 43.26 | 136.25‒441.21 | 0.58 | 4.39 |
| BD (RVU) | 104.12 ± 49.91 | 22.63‒247.58 | 0.48 | -0.71 | 79.83 ± 36.21 | 22.63‒201.79 | 0.98 | 0.95 | 155.27 ± 37.2 | 63.59‒247.58 | -0.23 | -0.30 |
| CS (RVU) | 140.70 ± 41.84 | 23.84‒244.51 | -0.16 | -0.39 | 156.90 ± 35.33 | 29.30‒244.51 | -0.48 | 0.47 | 103.32 ± 30.42 | 23.84‒201.51 | 0.33 | 2.15 |
| SB (RVU) | 36.78 ± 80.88 | -179.04‒202.17 | -0.51 | -0.84 | 77.07 ± 54.21 | -112.54‒202.17 | -1.32 | 2.50 | -51.95 ± 56.72 | -179.04‒137.92 | 0.89 | 1.39 |
| PT (ºC) | 76.89 ± 4.17 | 68.10‒85.00 | -0.19 | -1.21 | 76.62 ± 4.38 | 68.10‒84.70 | -0.28 | -1.38 | 77.24 ± 3.82 | 70.80‒85.00 | 0.31 | -1.20 |
| HD (gf) | 217.07 ± 51.74 | 107.84‒311.66 | -0.32 | -1.02 | 241.79 ± 38.91 | 107.84‒311.66 | -1.04 | 1.55 | 163.60 ± 32.42 | 114.77‒263.67 | 0.88 | 0.55 |
| ADH (gf·s) | 18.62 ± 20.93 | 0.00‒115.89 | 1.55 | 2.37 | 9.34 ± 13.00 | 0.00‒64.15 | 2.64 | 6.99 | 38.68 ± 21.71 | 0.09‒115.89 | 1.00 | 1.47 |
| SPR | 0.56 ± 0.06 | 0.37‒0.77 | 0.02 | 0.47 | 0.58 ± 0.05 | 0.37‒0.68 | -0.48 | 1.18 | 0.53 ± 0.05 | 0.44‒0.77 | 1.59 | 5.79 |
| CHEW (gf) | 60.82 ± 20.98 | 15.25‒123.41 | 0.21 | -0.45 | 69.51 ± 17.68 | 15.25‒123.41 | 0.00 | 0.73 | 41.79 ± 13.03 | 21.79‒89.49 | 1.33 | 2.32 |
| GUM (gf) | 105.35 ± 29.19 | 41.27‒179.89 | 0.01 | -0.70 | 118.16 ± 23.66 | 41.27‒179.89 | -0.35 | 0.89 | 77.50 ± 18.21 | 48.30‒142.88 | 1.17 | 1.81 |
| COH | 0.48 ± 0.05 | 0.35‒0.65 | 0.28 | 0.17 | 0.49 ± 0.06 | 0.35‒0.65 | 0.15 | 0.20 | 0.47 ± 0.04 | 0.39‒0.58 | 0.42 | -0.16 |
| RES | 0.11 ± 0.03 | 0.04‒0.19 | 0.20 | -0.36 | 0.12 ± 0.02 | 0.07‒0.19 | 0.06 | 0.34 | 0.09 ± 0.02 | 0.04‒0.16 | 1.19 | 3.31 |
| Parameter | AAC | PV | HPV | CPV | BD | CS | SB | PT | HD | ADH | SPR | CHEW | GUM | COH |
|---|---|---|---|---|---|---|---|---|---|---|---|---|---|---|
| PV | -0.296** | |||||||||||||
| HPV | 0.469** | 0.509** | ||||||||||||
| CPV | 0.668** | 0.306** | 0.911** | |||||||||||
| BD | -0.745** | 0.633** | -0.344** | -0.486** | ||||||||||
| CS | 0.748** | 0.026 | 0.634** | 0.896** | -0.540** | |||||||||
| SB | 0.848** | -0.374** | 0.544** | 0.767** | -0.897** | 0.855** | ||||||||
| PT | -0.063 | 0.207** | -0.031 | 0.003 | 0.253** | 0.037 | -0.139* | |||||||
| HD | 0.861** | -0.339** | 0.461** | 0.615** | -0.768** | 0.661** | 0.804** | 0.005 | ||||||
| ADH | -0.747** | 0.319** | -0.403** | -0.588** | 0.696** | -0.674** | -0.768** | 0.038 | -0.629** | |||||
| SPR | 0.536** | -0.048 | 0.372** | 0.482** | -0.383** | 0.506** | 0.491** | 0.046 | 0.571** | -0.342** | ||||
| CHEW | 0.768** | -0.206** | 0.465** | 0.612** | -0.632** | 0.651** | 0.715** | -0.013 | 0.862** | -0.574** | 0.816** | |||
| GUM | 0.807** | -0.266** | 0.453** | 0.607** | -0.685** | 0.655** | 0.749** | -0.020 | 0.911** | -0.611** | 0.700** | 0.979** | ||
| COH | 0.209** | 0.033 | 0.147* | 0.211** | -0.096 | 0.237** | 0.176** | -0.027 | 0.178** | -0.197** | 0.563** | 0.606** | 0.558** | |
| RES | 0.707** | -0.169** | 0.446** | 0.611** | -0.577** | 0.670** | 0.690** | -0.093 | 0.641** | -0.680** | 0.668** | 0.863** | 0.857** | 0.766** |
Table 2. Correlation coefficients between rice quality traits.
| Parameter | AAC | PV | HPV | CPV | BD | CS | SB | PT | HD | ADH | SPR | CHEW | GUM | COH |
|---|---|---|---|---|---|---|---|---|---|---|---|---|---|---|
| PV | -0.296** | |||||||||||||
| HPV | 0.469** | 0.509** | ||||||||||||
| CPV | 0.668** | 0.306** | 0.911** | |||||||||||
| BD | -0.745** | 0.633** | -0.344** | -0.486** | ||||||||||
| CS | 0.748** | 0.026 | 0.634** | 0.896** | -0.540** | |||||||||
| SB | 0.848** | -0.374** | 0.544** | 0.767** | -0.897** | 0.855** | ||||||||
| PT | -0.063 | 0.207** | -0.031 | 0.003 | 0.253** | 0.037 | -0.139* | |||||||
| HD | 0.861** | -0.339** | 0.461** | 0.615** | -0.768** | 0.661** | 0.804** | 0.005 | ||||||
| ADH | -0.747** | 0.319** | -0.403** | -0.588** | 0.696** | -0.674** | -0.768** | 0.038 | -0.629** | |||||
| SPR | 0.536** | -0.048 | 0.372** | 0.482** | -0.383** | 0.506** | 0.491** | 0.046 | 0.571** | -0.342** | ||||
| CHEW | 0.768** | -0.206** | 0.465** | 0.612** | -0.632** | 0.651** | 0.715** | -0.013 | 0.862** | -0.574** | 0.816** | |||
| GUM | 0.807** | -0.266** | 0.453** | 0.607** | -0.685** | 0.655** | 0.749** | -0.020 | 0.911** | -0.611** | 0.700** | 0.979** | ||
| COH | 0.209** | 0.033 | 0.147* | 0.211** | -0.096 | 0.237** | 0.176** | -0.027 | 0.178** | -0.197** | 0.563** | 0.606** | 0.558** | |
| RES | 0.707** | -0.169** | 0.446** | 0.611** | -0.577** | 0.670** | 0.690** | -0.093 | 0.641** | -0.680** | 0.668** | 0.863** | 0.857** | 0.766** |
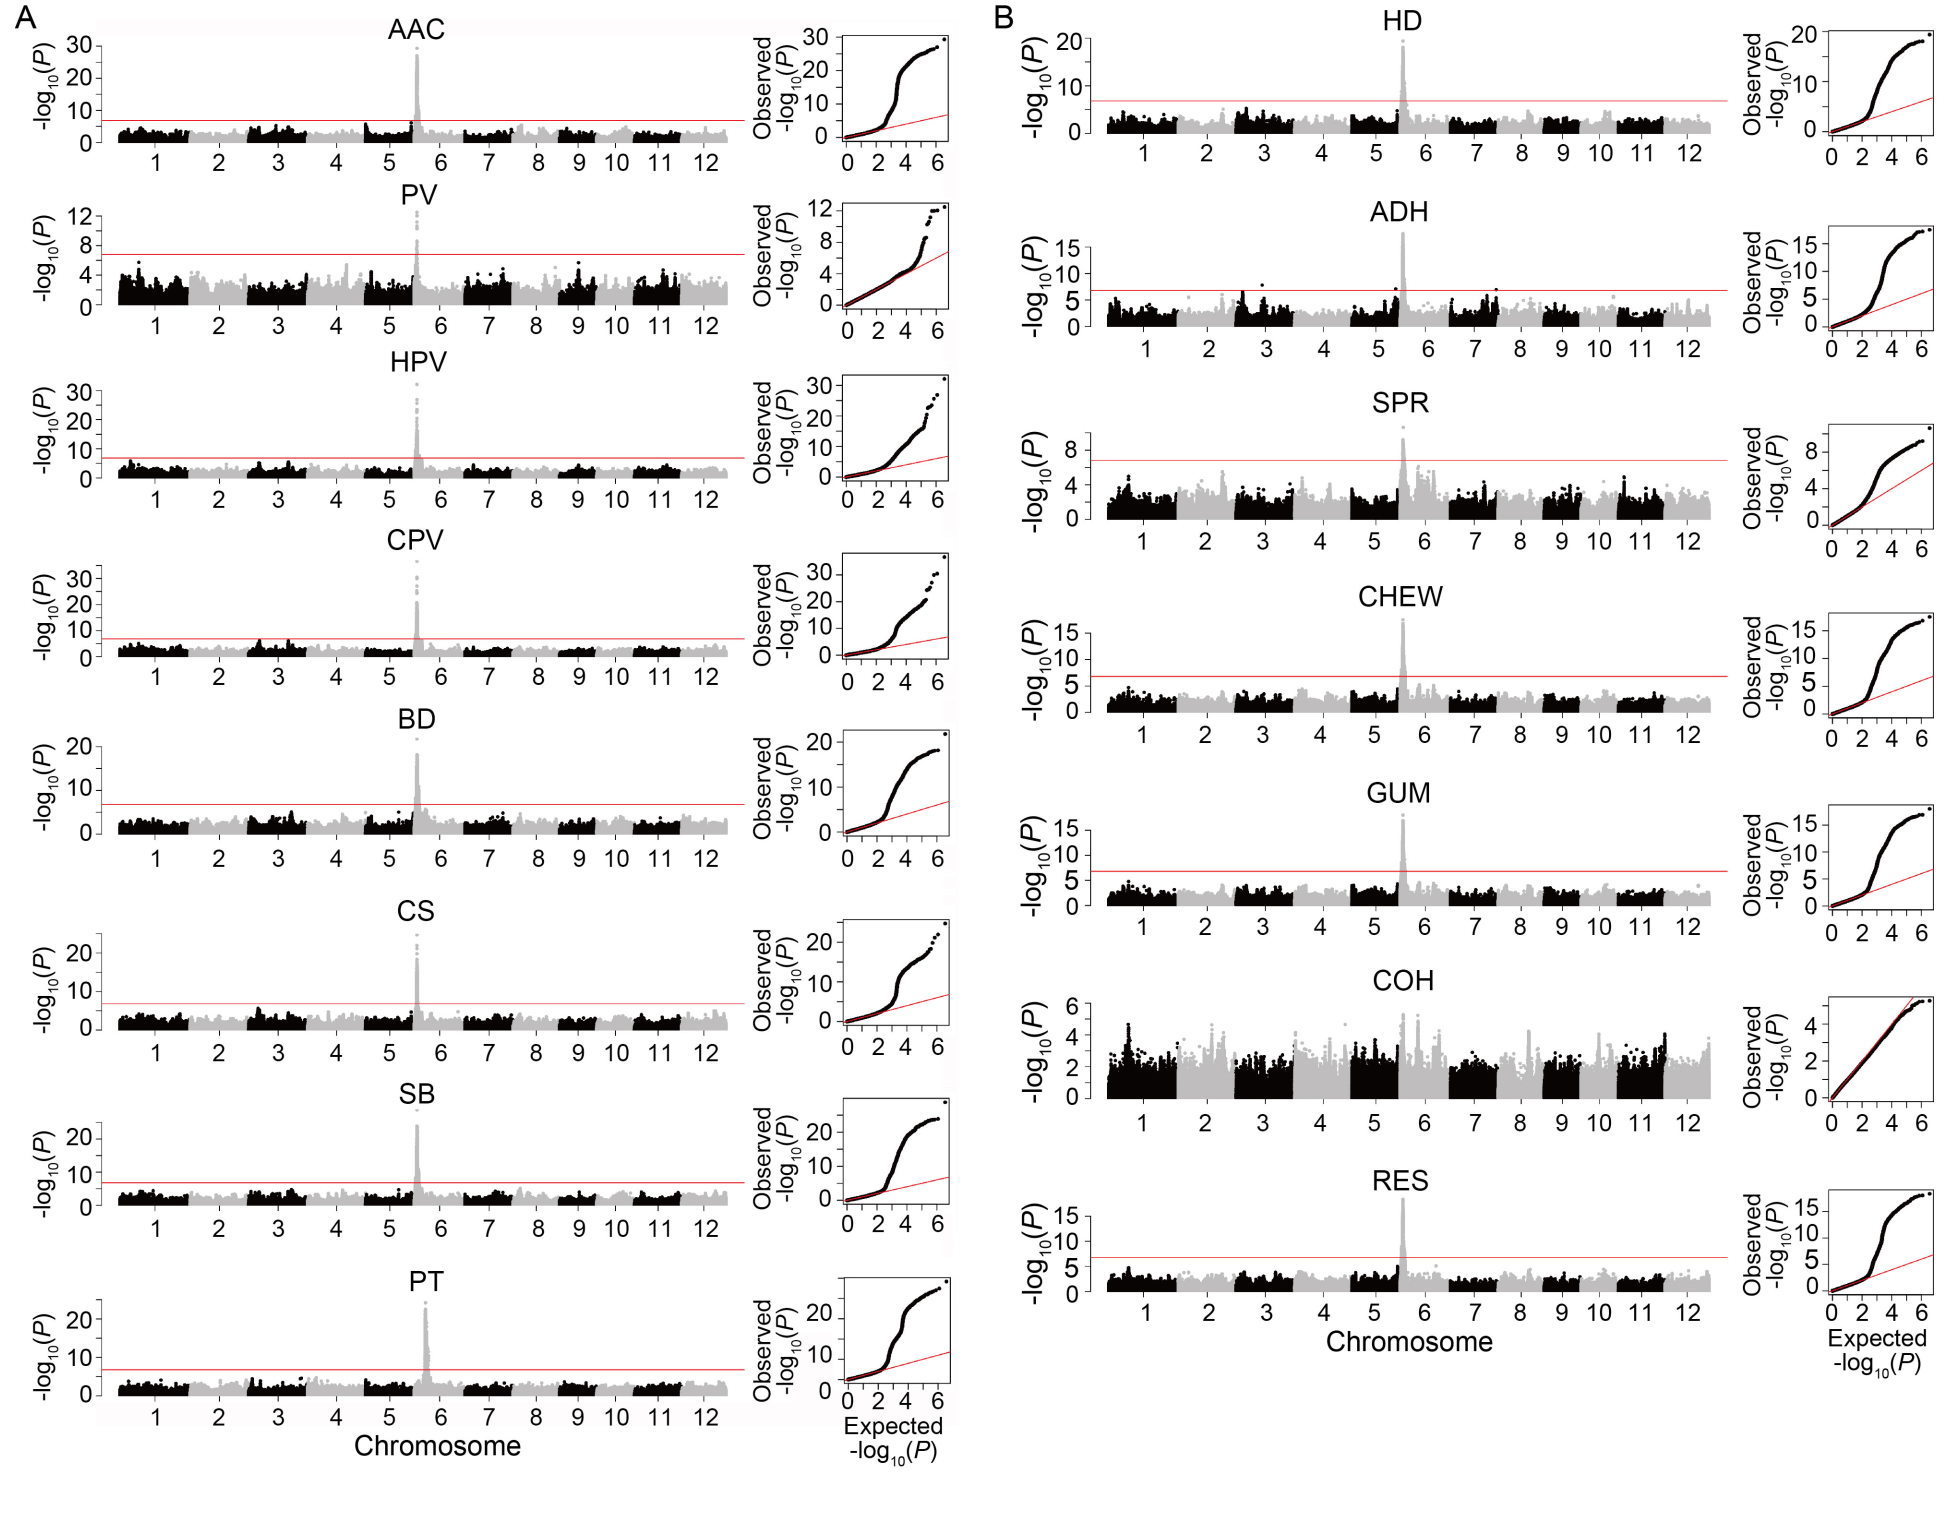
Fig. 2. Manhattan (left) and quantile-quantile plots (right) of genome-wide association study for quality traits in 279 indica rice accessions. A, AAC and RVA parameters. B, Cooked rice textural properties. AAC, Apparent amylose content; PV, Peak viscosity; HPV, Hot paste viscosity; CPV, Cold paste viscosity; BD, Breakdown; CS, Consistency; SB, Setback; PT, Pasting temperature; HD, Hardness; ADH, Adhesiveness; SPR, Springiness; CHEW, Chewiness; GUM, Gumminess; COH, Cohesiveness; RES, Resilience. The points in the Manhattan plots indicate the -log10(P) values. The horizontal red lines indicate the significant thresholds at P = 3.20E-6.
| Trait | Chr. | Position (bp) | PVE (%) | P-value | Candidate locus | Known gene |
|---|---|---|---|---|---|---|
| AAC | 5 | 28 105 720 | 11.3 | 7.71E-07 | LOC_Os05g48990‒LOC_Os05g49000 | |
| 6 | 1 657 731 | 32.8 | 6.07E-24 | LOC_Os06g04040‒LOC_Os06g04060 | SSG6 | |
| 6 | 1 777 598 | 34.7 | 2.56E-29 | LOC_Os06g04200 | Wx | |
| PV | 6 | 1 769 242 | 17.7 | 3.22E-13 | LOC_Os06g04200 | Wx |
| HPV | 6 | 1 768 998 | 43.9 | 8.56E-33 | LOC_Os06g04200 | Wx |
| CPV | 3 | 6 712 794 | 7.8 | 9.98E-07 | LOC_Os03g12620‒LOC_Os03g12630 | |
| 6 | 1 768 998 | 47.6 | 2.17E-37 | LOC_Os06g04200 | Wx | |
| BD | 6 | 1 769 141 | 24.8 | 6.91E-19 | LOC_Os06g04200 | Wx |
| CS | 6 | 1 768 998 | 34.8 | 1.92E-25 | LOC_Os06g04200 | Wx |
| SB | 6 | 1 769 141 | 31.9 | 1.83E-24 | LOC_Os06g04200 | Wx |
| 6 | 1 633 040 | 25.4 | 3.19E-18 | LOC_Os06g03990 | SSG6 | |
| PT | 6 | 6 752 888 | 28.9 | 3.14E-19 | LOC_Os06g12450 | SSIIa |
| HD | 6 | 1 770 024 | 27.6 | 3.20E-18 | LOC_Os06g04200 | Wx |
| 6 | 1 633 260 | 19.6 | 1.03E-13 | LOC_Os06g03990 | SSG6 | |
| ADH | 3 | 16 160 642 | 12.1 | 1.58E-08 | LOC_Os03g28110 | |
| 5 | 27 224 506 | 15.0 | 7.79E-08 | LOC_Os05g47520‒LOC_Os05g47530 | ||
| 6 | 1 765 761 | 27.7 | 6.44E-18 | LOC_Os06g04200 | Wx | |
| 6 | 1 631 244 | 23.1 | 1.50E-15 | LOC_Os06g03990 | SSG6 | |
| 7 | 28 487 354 | 11.9 | 1.11E-07 | LOC_Os07g47680‒LOC_Os07g47690 | ||
| SPR | 6 | 1 765 976 | 15.3 | 6.33E-10 | LOC_Os06g04200 | Wx |
| CHEW | 6 | 1 769 141 | 25.1 | 4.54E-17 | LOC_Os06g04200 | Wx |
| 6 | 1 633 260 | 18.8 | 8.28E-13 | LOC_Os06g03990 | SSG6 | |
| GUM | 6 | 1 770 024 | 26.7 | 2.70E-17 | LOC_Os06g04200 | Wx |
| 6 | 1 633 260 | 19.7 | 2.27E-13 | LOC_Os06g03990 | SSG6 | |
| RES | 6 | 1 769 141 | 27.7 | 2.14E-18 | LOC_Os06g04200 | Wx |
| 6 | 1 628 937 | 22.8 | 7.98E-16 | LOC_Os06g03990 | SSG6 |
Table 3. Loci identified for quality traits in 279 indica rice accessions by genome-wide association study.
| Trait | Chr. | Position (bp) | PVE (%) | P-value | Candidate locus | Known gene |
|---|---|---|---|---|---|---|
| AAC | 5 | 28 105 720 | 11.3 | 7.71E-07 | LOC_Os05g48990‒LOC_Os05g49000 | |
| 6 | 1 657 731 | 32.8 | 6.07E-24 | LOC_Os06g04040‒LOC_Os06g04060 | SSG6 | |
| 6 | 1 777 598 | 34.7 | 2.56E-29 | LOC_Os06g04200 | Wx | |
| PV | 6 | 1 769 242 | 17.7 | 3.22E-13 | LOC_Os06g04200 | Wx |
| HPV | 6 | 1 768 998 | 43.9 | 8.56E-33 | LOC_Os06g04200 | Wx |
| CPV | 3 | 6 712 794 | 7.8 | 9.98E-07 | LOC_Os03g12620‒LOC_Os03g12630 | |
| 6 | 1 768 998 | 47.6 | 2.17E-37 | LOC_Os06g04200 | Wx | |
| BD | 6 | 1 769 141 | 24.8 | 6.91E-19 | LOC_Os06g04200 | Wx |
| CS | 6 | 1 768 998 | 34.8 | 1.92E-25 | LOC_Os06g04200 | Wx |
| SB | 6 | 1 769 141 | 31.9 | 1.83E-24 | LOC_Os06g04200 | Wx |
| 6 | 1 633 040 | 25.4 | 3.19E-18 | LOC_Os06g03990 | SSG6 | |
| PT | 6 | 6 752 888 | 28.9 | 3.14E-19 | LOC_Os06g12450 | SSIIa |
| HD | 6 | 1 770 024 | 27.6 | 3.20E-18 | LOC_Os06g04200 | Wx |
| 6 | 1 633 260 | 19.6 | 1.03E-13 | LOC_Os06g03990 | SSG6 | |
| ADH | 3 | 16 160 642 | 12.1 | 1.58E-08 | LOC_Os03g28110 | |
| 5 | 27 224 506 | 15.0 | 7.79E-08 | LOC_Os05g47520‒LOC_Os05g47530 | ||
| 6 | 1 765 761 | 27.7 | 6.44E-18 | LOC_Os06g04200 | Wx | |
| 6 | 1 631 244 | 23.1 | 1.50E-15 | LOC_Os06g03990 | SSG6 | |
| 7 | 28 487 354 | 11.9 | 1.11E-07 | LOC_Os07g47680‒LOC_Os07g47690 | ||
| SPR | 6 | 1 765 976 | 15.3 | 6.33E-10 | LOC_Os06g04200 | Wx |
| CHEW | 6 | 1 769 141 | 25.1 | 4.54E-17 | LOC_Os06g04200 | Wx |
| 6 | 1 633 260 | 18.8 | 8.28E-13 | LOC_Os06g03990 | SSG6 | |
| GUM | 6 | 1 770 024 | 26.7 | 2.70E-17 | LOC_Os06g04200 | Wx |
| 6 | 1 633 260 | 19.7 | 2.27E-13 | LOC_Os06g03990 | SSG6 | |
| RES | 6 | 1 769 141 | 27.7 | 2.14E-18 | LOC_Os06g04200 | Wx |
| 6 | 1 628 937 | 22.8 | 7.98E-16 | LOC_Os06g03990 | SSG6 |
| Trait | Chr. | Position (bp) | P-value | PVE (%) | Candidate locus | Known gene |
|---|---|---|---|---|---|---|
| WxT panel | ||||||
| AAC | 1 | 9 468 765 | 3.35E-07 | 13.5 | LOC_Os01g16670‒ LOC_Os01g16690 | OsYUC9 |
| 3 | 21 069 124 | 1.78E-08 | 22.4 | LOC_Os03g37940‒ LOC_Os03g37950 | ||
| 6 | 1 970 080 | 3.33E-07 | 14.7 | LOC_Os06g04550 | ||
| 8 | 4 582 547 | 3.50E-09 | 22.1 | LOC_Os08g08070 | OsMST5 | |
| 10 | 11 299 091 | 2.07E-07 | 14.0 | LOC_Os10g21920‒ LOC_Os10g21930 | ||
| 12 | 13 955 846 | 1.45E-07 | 16.0 | LOC_Os12g24450 | ||
| PV | 4 | 23 898 757 | 1.45E-07 | 15.6 | LOC_Os04g40150‒ LOC_Os04g40170 | |
| 6 | 1 768 998 | 1.05E-12 | 26.4 | LOC_Os06g04200 | Wx | |
| 6 | 1 621 298 | 3.17E-11 | 22.3 | LOC_Os06g03980‒ LOC_Os06g03990 | SSG6 | |
| HPV | 6 | 1 768 998 | 9.16E-20 | 38.8 | LOC_Os06g04200 | Wx |
| 6 | 1 621 298 | 5.22E-14 | 27.1 | LOC_Os06g03980‒ LOC_Os06g03990 | SSG6 | |
| CPV | 6 | 1 768 998 | 1.41E-20 | 40.6 | LOC_Os06g04200 | Wx |
| 6 | 1 621 298 | 4.96E-13 | 25.7 | LOC_Os06g03980‒ LOC_Os06g03990 | SSG6 | |
| BD | 6 | 6 854 257 | 6.98E-09 | 16.2 | LOC_Os06g12600‒ LOC_Os06g12610 | SSIIa |
| 6 | 6 752 888 | 4.02E-07 | 13.8 | LOC_Os06g12450 | SSIIa | |
| 8 | 4 584 642 | 3.07E-06 | 13.5 | LOC_Os08g08070‒ LOC_Os08g08080 | OsMST5 | |
| CS | 6 | 1 768 998 | 5.36E-12 | 25.2 | LOC_Os06g04200 | Wx |
| 6 | 1 621 298 | 1.56E-07 | 15.7 | LOC_Os06g03980‒ LOC_Os06g03990 | SSG6 | |
| SB | 6 | 1 970 080 | 1.67E-09 | 21.4 | LOC_Os06g04550 | |
| 8 | 4 582 547 | 3.45E-09 | 18.4 | LOC_Os08g08070 | OsMST5 | |
| PT | 6 | 6 752 888 | 5.45E-14 | 31.1 | LOC_Os06g12450 | SSIIa |
| HD | 8 | 4 282 227 | 3.06E-07 | 21.1 | LOC_Os08g07620‒ LOC_Os08g07630 | |
| ADH | 8 | 25 957 150 | 4.39E-08 | 17.0 | LOC_Os08g41054 | |
| WxA panel | ||||||
| AAC | 1 | 4 901 428 | 1.10E-07 | 36.8 | LOC_Os01g09560‒ LOC_Os01g09570 | |
| CS | 9 | 22 391 230 | 2.72E-07 | 30.2 | LOC_Os09g38990‒ LOC_Os09g39000 | |
| PT | 6 | 6 752 888 | 7.36E-10 | 39.3 | LOC_Os06g12450 | SSIIa |
| HD | 8 | 9 304 513 | 1.49E-08 | 17.5 | LOC_Os08g15300 | |
| ADH | 2 | 31 628 729 | 1.06E-08 | 24.1 | LOC_Os02g51640‒ LOC_Os02g51650 | |
| 7 | 28 507 542 | 2.95E-08 | 25.7 | LOC_Os07g47720‒ LOC_Os07g47730 | ||
| SPR | 2 | 556 675 | 1.60E-07 | 27.7 | LOC_Os02g02000‒ LOC_Os02g02010 | |
| 6 | 11 318 610 | 2.63E-07 | 29.1 | LOC_Os06g19800‒ LOC_Os06g19810 | ||
| 11 | 4 936 393 | 1.63E-07 | 34.3 | LOC_Os11g09200 | ||
| CHEW | 8 | 8 577 354 | 1.27E-07 | 21.3 | LOC_Os08g14310‒ LOC_Os08g14320 | |
| 8 | 4 581 009 | 1.27E-06 | 16.0 | LOC_Os08g08070 | OsMST5 | |
| GUM | 8 | 4 585 261 | 6.88E-07 | 13.6 | LOC_Os08g08070‒ LOC_Os08g08080 | OsMST5 |
Table 4. Loci identified for rice quality traits in WxT and WxA panels.
| Trait | Chr. | Position (bp) | P-value | PVE (%) | Candidate locus | Known gene |
|---|---|---|---|---|---|---|
| WxT panel | ||||||
| AAC | 1 | 9 468 765 | 3.35E-07 | 13.5 | LOC_Os01g16670‒ LOC_Os01g16690 | OsYUC9 |
| 3 | 21 069 124 | 1.78E-08 | 22.4 | LOC_Os03g37940‒ LOC_Os03g37950 | ||
| 6 | 1 970 080 | 3.33E-07 | 14.7 | LOC_Os06g04550 | ||
| 8 | 4 582 547 | 3.50E-09 | 22.1 | LOC_Os08g08070 | OsMST5 | |
| 10 | 11 299 091 | 2.07E-07 | 14.0 | LOC_Os10g21920‒ LOC_Os10g21930 | ||
| 12 | 13 955 846 | 1.45E-07 | 16.0 | LOC_Os12g24450 | ||
| PV | 4 | 23 898 757 | 1.45E-07 | 15.6 | LOC_Os04g40150‒ LOC_Os04g40170 | |
| 6 | 1 768 998 | 1.05E-12 | 26.4 | LOC_Os06g04200 | Wx | |
| 6 | 1 621 298 | 3.17E-11 | 22.3 | LOC_Os06g03980‒ LOC_Os06g03990 | SSG6 | |
| HPV | 6 | 1 768 998 | 9.16E-20 | 38.8 | LOC_Os06g04200 | Wx |
| 6 | 1 621 298 | 5.22E-14 | 27.1 | LOC_Os06g03980‒ LOC_Os06g03990 | SSG6 | |
| CPV | 6 | 1 768 998 | 1.41E-20 | 40.6 | LOC_Os06g04200 | Wx |
| 6 | 1 621 298 | 4.96E-13 | 25.7 | LOC_Os06g03980‒ LOC_Os06g03990 | SSG6 | |
| BD | 6 | 6 854 257 | 6.98E-09 | 16.2 | LOC_Os06g12600‒ LOC_Os06g12610 | SSIIa |
| 6 | 6 752 888 | 4.02E-07 | 13.8 | LOC_Os06g12450 | SSIIa | |
| 8 | 4 584 642 | 3.07E-06 | 13.5 | LOC_Os08g08070‒ LOC_Os08g08080 | OsMST5 | |
| CS | 6 | 1 768 998 | 5.36E-12 | 25.2 | LOC_Os06g04200 | Wx |
| 6 | 1 621 298 | 1.56E-07 | 15.7 | LOC_Os06g03980‒ LOC_Os06g03990 | SSG6 | |
| SB | 6 | 1 970 080 | 1.67E-09 | 21.4 | LOC_Os06g04550 | |
| 8 | 4 582 547 | 3.45E-09 | 18.4 | LOC_Os08g08070 | OsMST5 | |
| PT | 6 | 6 752 888 | 5.45E-14 | 31.1 | LOC_Os06g12450 | SSIIa |
| HD | 8 | 4 282 227 | 3.06E-07 | 21.1 | LOC_Os08g07620‒ LOC_Os08g07630 | |
| ADH | 8 | 25 957 150 | 4.39E-08 | 17.0 | LOC_Os08g41054 | |
| WxA panel | ||||||
| AAC | 1 | 4 901 428 | 1.10E-07 | 36.8 | LOC_Os01g09560‒ LOC_Os01g09570 | |
| CS | 9 | 22 391 230 | 2.72E-07 | 30.2 | LOC_Os09g38990‒ LOC_Os09g39000 | |
| PT | 6 | 6 752 888 | 7.36E-10 | 39.3 | LOC_Os06g12450 | SSIIa |
| HD | 8 | 9 304 513 | 1.49E-08 | 17.5 | LOC_Os08g15300 | |
| ADH | 2 | 31 628 729 | 1.06E-08 | 24.1 | LOC_Os02g51640‒ LOC_Os02g51650 | |
| 7 | 28 507 542 | 2.95E-08 | 25.7 | LOC_Os07g47720‒ LOC_Os07g47730 | ||
| SPR | 2 | 556 675 | 1.60E-07 | 27.7 | LOC_Os02g02000‒ LOC_Os02g02010 | |
| 6 | 11 318 610 | 2.63E-07 | 29.1 | LOC_Os06g19800‒ LOC_Os06g19810 | ||
| 11 | 4 936 393 | 1.63E-07 | 34.3 | LOC_Os11g09200 | ||
| CHEW | 8 | 8 577 354 | 1.27E-07 | 21.3 | LOC_Os08g14310‒ LOC_Os08g14320 | |
| 8 | 4 581 009 | 1.27E-06 | 16.0 | LOC_Os08g08070 | OsMST5 | |
| GUM | 8 | 4 585 261 | 6.88E-07 | 13.6 | LOC_Os08g08070‒ LOC_Os08g08080 | OsMST5 |
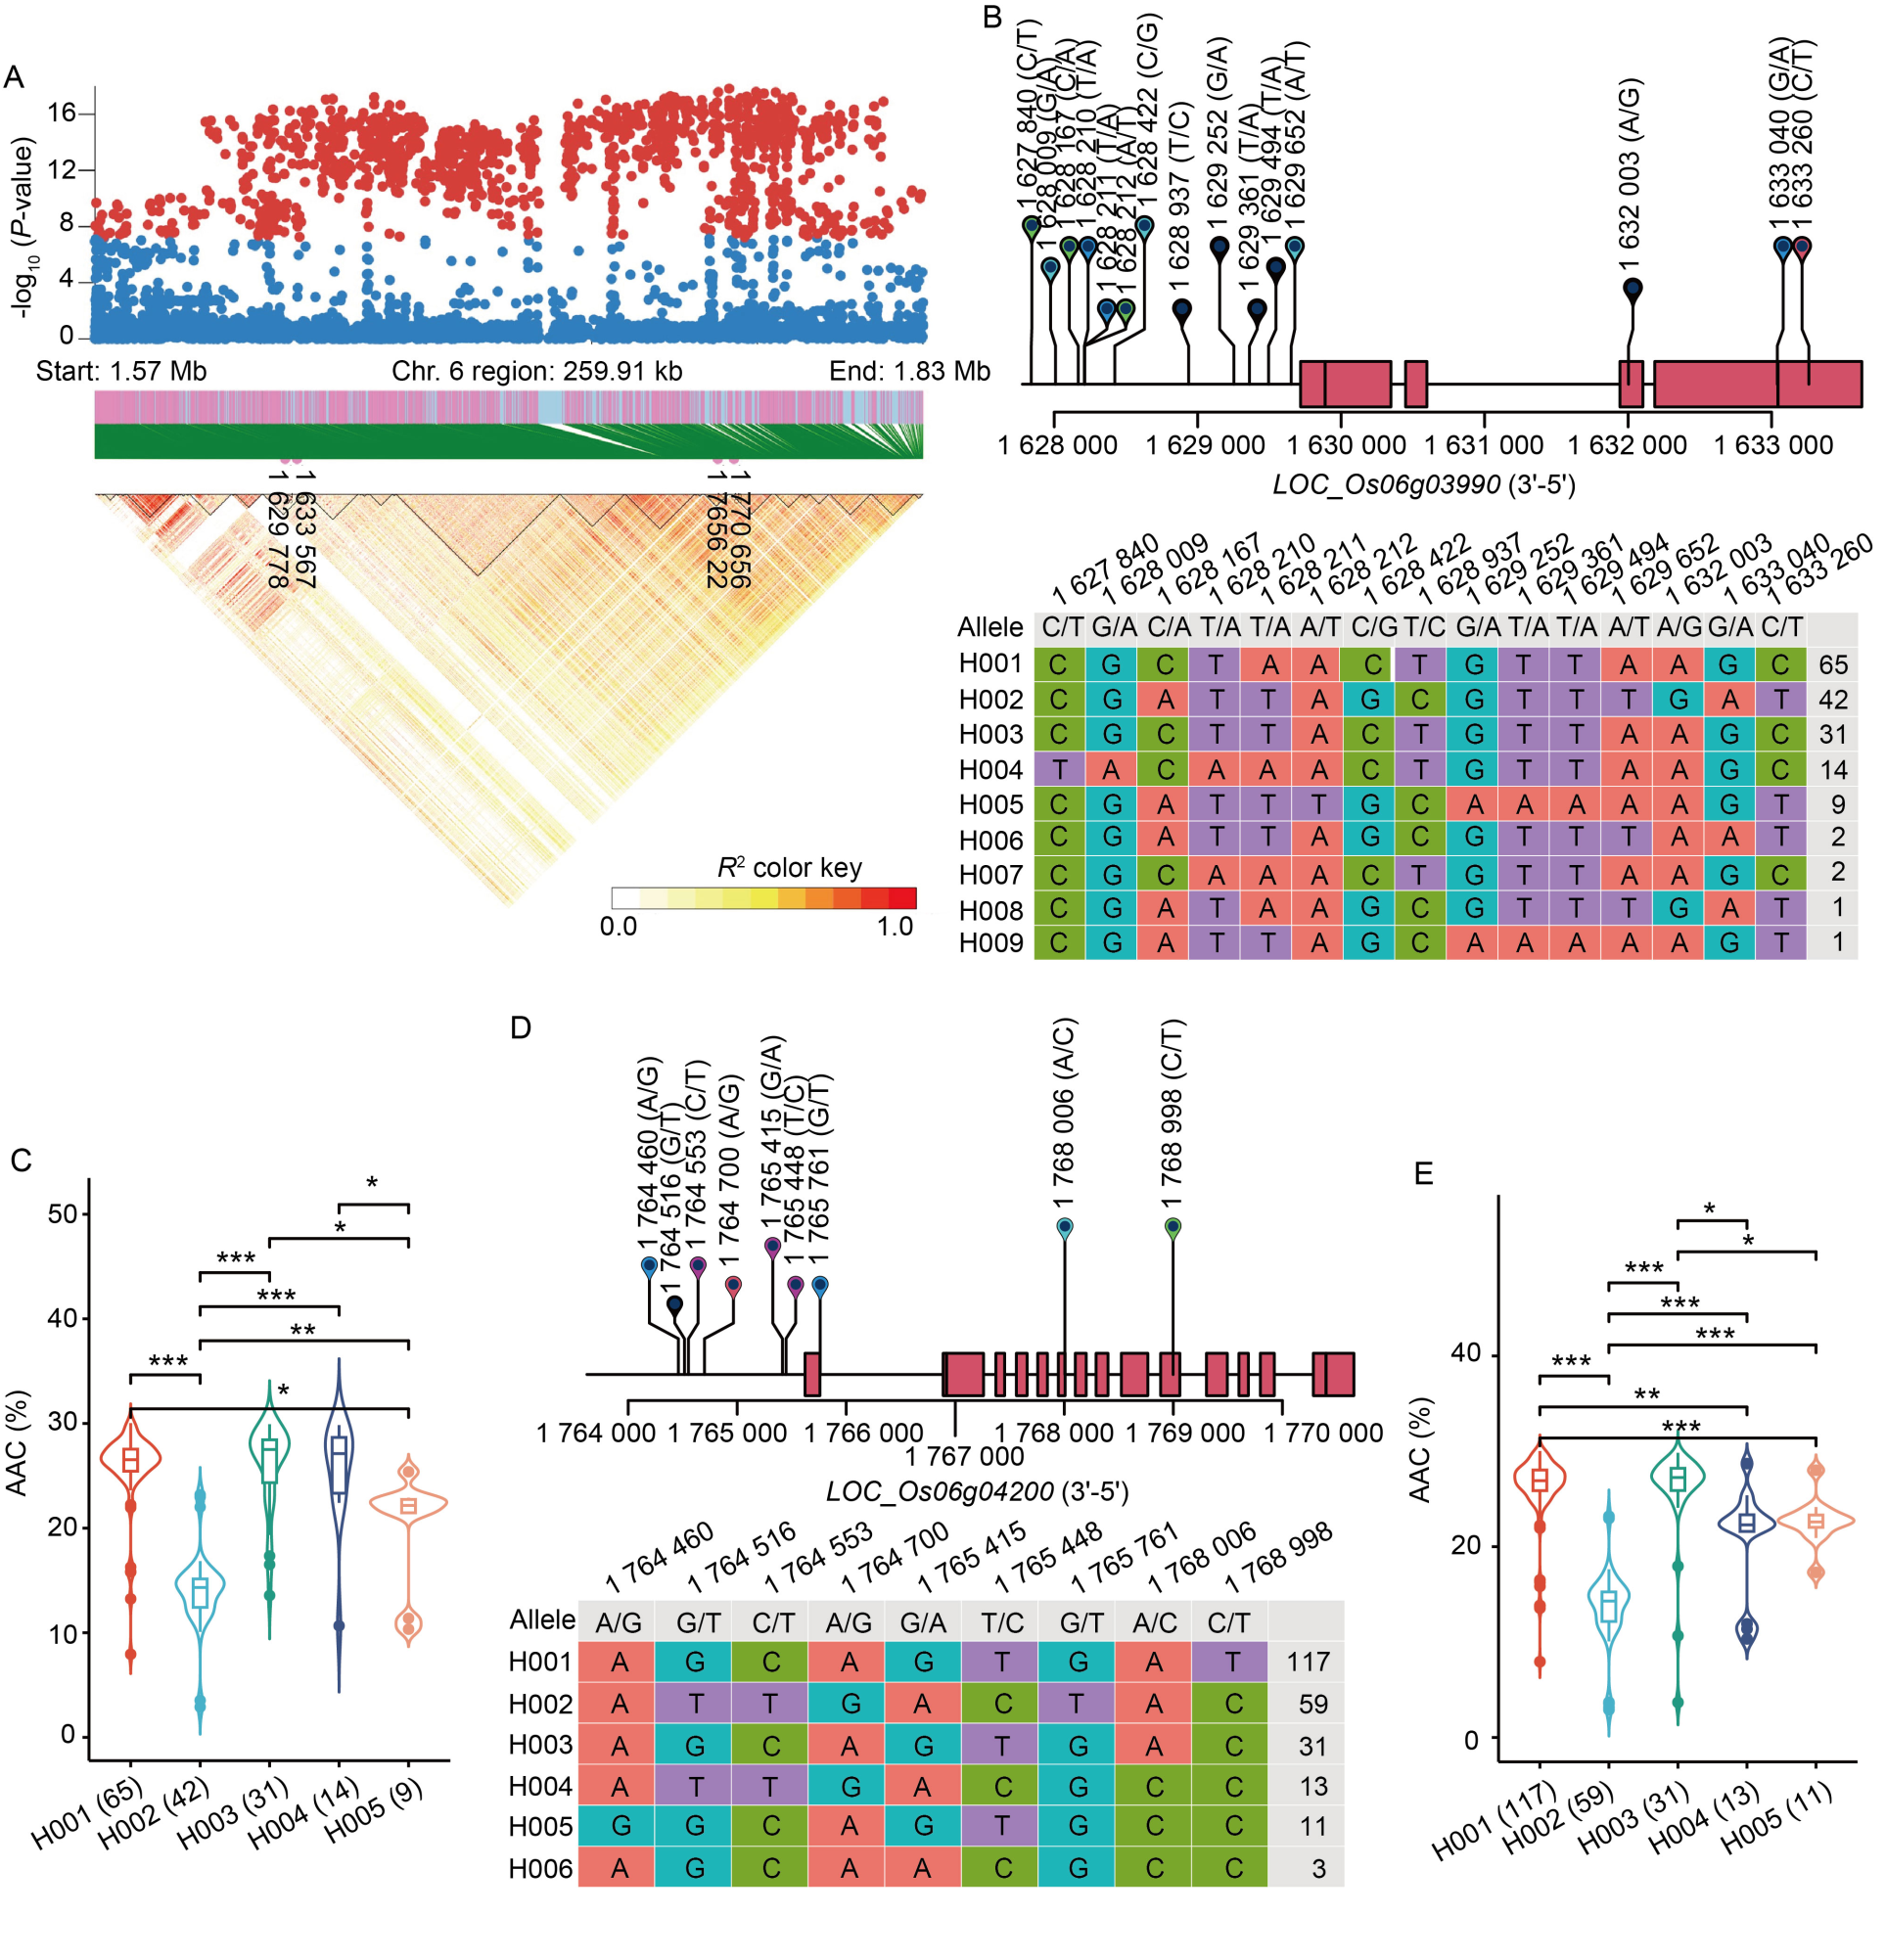
Fig.3. Identification of candidate genes for apparent amylose content (AAC) in the whole panel. A, High-density gene-based association analysis and linkage disequilibrium heat map of local Manhattan map, around the peak on chromosome 6. Points with -log10 (P-value) exceeding 7 were visualized in red. B, Based on 15 SNPs in all evaluated rice accessions, 9 haplotypes of SSG6 (LOC_Os06g03990) were identified. In the gene structure diagram of LOC_Os06g03990 (http://rice.plantbiology.msu.edu), the exon and untranslated regions are indicated by red frame, and the intron and intergenic regions are marked by black lines. C, AAC comparisons among accessions carrying different haplotypes of SSG6, haplotypes with fewer than nine accessions are not shown. D, Based on nine SNPs in all evaluated rice accessions, six haplotypes of Wx (LOC_Os06g04200) were identified. In the gene structure diagram of LOC_Os06g04200, the exon and untranslated regions are indicated by red frame, and the intron and intergenic regions are marked by black lines. E, AAC comparisons among accessions carrying different haplotypes of Wx, haplotypes with fewer than 10 accessions are not shown. *, P < 0.05; **, P < 0.01; ***, P < 0.001.

Fig. 4. Identification of candidate genes for pasting temperature in the whole panel. A, High-density gene-based association analysis and linkage disequilibrium heat map of local Manhattan map, around the peak on chromosome 6. Points with -log10 (P-value) exceeding 7 were visualized in red. B, Based on 20 SNPs in all evaluated rice accessions, 4 haplotypes of SSIIa (LOC_Os06g12450) were identified. In the gene structure diagram of LOC_Os06g12450, the exon and untraslated regions are indicated by red frame; and the intron and intergenic regions are marked by black lines. C, Pasting temperature comparisons among accessions carrying different haplotypes of SSIIa, haplotypes with fewer than 10 accessions are not shown. ***, P < 0.001.
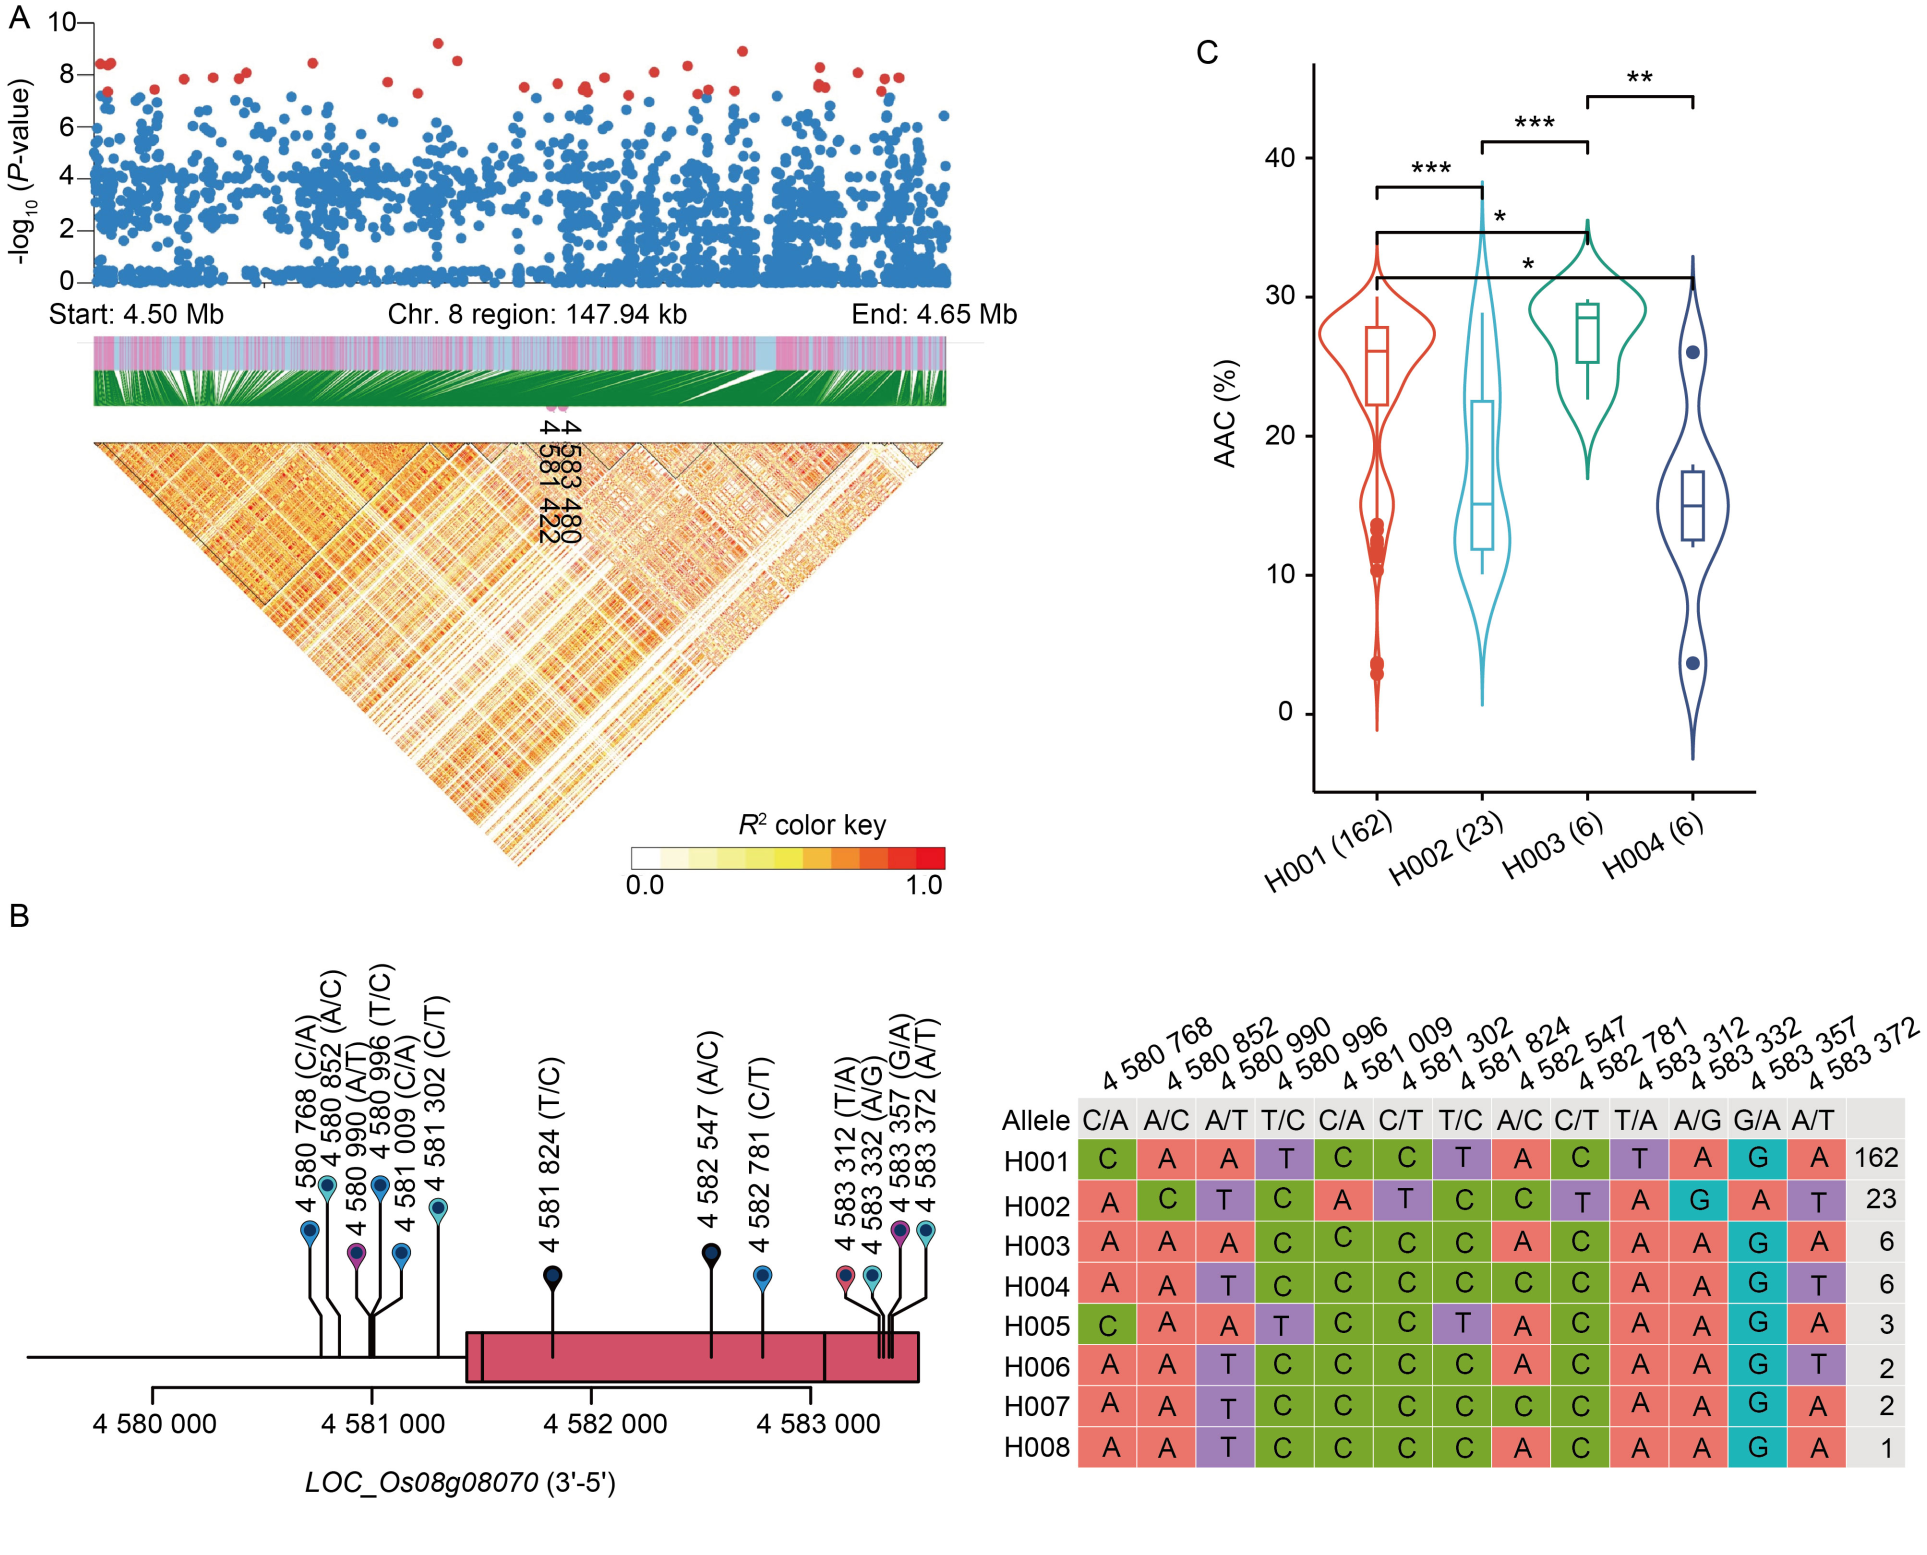
Fig. 5. Identification of candidate genes for apparent amylose content (AAC) in WxT panel. A, High-density gene-based association analysis and linkage disequilibrium heat map of local Manhattan map, around the peak on chromosome 8. Points with -log10 (P-value) exceeding 7 were visualized in red. B, Based on 13 SNPs in all evaluated rice accessions, 8 haplotypes of OsMST5 (LOC_Os08g08070) were identified. In the gene structure diagram of LOC_Os08g08070, the exon and untranslated regions are indicated by red frame; and the intron and intergenic regions are marked by black lines. C, AAC comparisons among accessions carrying different haplotypes of OsMST5, haplotypes with fewer than six accessions are not shown. *, P < 0.05; **, P < 0.01; ***, P < 0.001.
| [1] | Alpuerto J B B, Samonte S O P B, Sanchez D L, Croaker P A, Wang Y J, Wilson L T, Christensen E F, Tabien R E, Yan Z B, Thomson M J. 2022. Genomic association mapping of apparent amylose and protein concentration in milled rice. Agronomy, 12(4): 857. |
| [2] | Bao J S. 2008. Accurate measurement of pasting temperature by the rapid visco-analyser: A case study using rice flour. Rice Sci, 15(1): 69-72. |
| [3] | Bao J S, Zheng X W, Xia Y W, He P, Shu Q Y, Lu X, Chen Y, Zhu L H. 2000. QTL mapping for the paste viscosity characteristics in rice (Oryza sativa L.). Theor Appl Genet, 100(2): 280-284. |
| [4] | Bao J S, Wu Y R, Hu B, Wu P, Cui H R, Shu Q Y. 2002. QTL for rice grain quality based on a DH population derived from parents with similar apparent amylose content. Euphytica, 128: 317-324. |
| [5] | Bao J S, Corke H, Sun M. 2006. Nucleotide diversity in starch synthase IIa and validation of single nucleotide polymorphisms in relation to starch gelatinization temperature and other physicochemical properties in rice (Oryza sativa L.). Theor Appl Genet, 113(7): 1171-1183. |
| [6] | Bao J S, Deng B W, Zhang L. 2023. Molecular and genetic bases of rice cooking and eating quality: An updated review. Cereal Chem, 100(6): 1220-1233. |
| [7] | Bello B K, Hou Y X, Zhao J, Jiao G A, Wu Y W, Li Z Y, Wang Y F, Tong X H, Wang W, Yuan W Y, Wei X J, Zhang J. 2019. NF-YB1-YC12-bHLH144 complex directly activates Wx to regulate grain quality in rice (Oryza sativa L.). Plant Biotechnol J, 17(7): 1222-1235. |
| [8] | Biselli C, Volante A, Desiderio F, Tondelli A, Gianinetti A, Finocchiaro F, Taddei F, Gazza L, Sgrulletta D, Cattivelli L, Valè G. 2019. GWAS for starch-related parameters in japonica rice (Oryza sativa L.). Plants, 8(8): 292. |
| [9] | Bradbury P J, Zhang Z W, Kroon D E, Casstevens T M, Ramdoss Y, Buckler E S. 2007. TASSEL: Software for association mapping of complex traits in diverse samples. Bioinformatics, 23(19): 2633-2635. |
| [10] | Cai Y, Zhang W W, Fu Y S, Shan Z Z, Xu J H, Wang P, Kong F, Jin J, Yan H G, Ge X Y, Wang Y X, You X M, Chen J, Li X, Chen W W, Chen X G, Ma J, Tang X J, Zhang J, Bao Y Q, Jiang L, Wang H Y, Wan J M. 2022. Du13 encodes a C2H2 zinc-finger protein that regulates Wxb pre-mRNA splicing and microRNA biogenesis in rice endosperm. Plant Biotechnol J, 20(7): 1387-1401. |
| [11] | Calingacion M, Laborte A, Nelson A, Resurreccion A, Concepcion J C, Daygon V D, Mumm R, Reinke R, Dipti S, Bassinello P Z, Manful J, Sophany S, Cordero Lara K, Bao J S, Xie L H, Loaiza K, El-hissewy A, Gayin J, Sharma N, Rajeswari S, Manonmani S, Rani N S, Kota S, Umemoto T, Boualaphanh C, Lee H H, Hung Y P, Ramli A, Aung P P, Ahmad R, Wattoo J I, Bandonill E, Romero M, Brites C M, Hafeel R, Lur H S, Cheaupun K, Jongdee S, Blanco P, Bryant R, Lang N T, Hall R D, Fitzgerald M. 2014. Diversity of global rice markets and the science required for consumer-targeted rice breeding. PLoS One, 9(1): e85106. |
| [12] | Chen M H, Bergman C J, Pinson S R M, Fjellstrom R G. 2008. Waxy gene haplotypes: Associations with pasting properties in an international rice germplasm collection. J Cereal Sci, 48(3): 781-788. |
| [13] | Cho Y G, Kang H J, Lee Y T, Jong S K, Eun M Y, McCouch S R. 2010. Identification of quantitative trait loci for physical and chemical properties of rice grain. Plant Biotechnol Rep, 4(1): 61-73. |
| [14] | Cruz M, Arbelaez J D, Loaiza K, Cuasquer J, Rosas J, Graterol E. 2021. Genetic and phenotypic characterization of rice grain quality traits to define research strategies for improving rice milling, appearance, and cooking qualities in Latin America and the Caribbean. Plant Genome, 14(3): e20134. |
| [15] | Cuevas R P O, Domingo C J, Sreenivasulu N. 2018. Multivariate- based classification of predicting cooking quality ideotypes in rice (Oryza sativa L.) indica germplasm. Rice, 11(1): 56. |
| [16] | Fan C C, Yu X Q, Xing Y Z, Xu C G, Luo L J, Zhang Q F. 2005. The main effects, epistatic effects and environmental interactions of QTLs on the cooking and eating quality of rice in a doubled- haploid line population. Theor Appl Genet, 110(8): 1445-1452. |
| [17] | Gao Z Y, Zeng D L, Cui X, Zhou Y H, Yan M X, Huang D N, Li J Y, Qian Q. 2003. Map-based cloning of the ALK gene, which controls the gelatinization temperature of rice. Sci China Ser C: Life Sci, 46(6): 661-668. |
| [18] | Hoai T T T, Matsusaka H, Toyosawa Y, Suu T D, Satoh H, Kumamaru T. 2014. Influence of single-nucleotide polymorphisms in the gene encoding granule-bound starch synthase I on amylose content in Vietnamese rice cultivars. Breed Sci, 64(2): 142-148. |
| [19] | Hori K, Suzuki K, Iijima K, Ebana K. 2016. Variation in cooking and eating quality traits in Japanese rice germplasm accessions. Breed Sci, 66(2): 309-318. |
| [20] | Huang X H, Wei X H, Sang T, Zhao Q, Feng Q, Zhao Y, Li C Y, Zhu C R, Lu T T, Zhang Z W, Li M, Fan D L, Guo Y L, Wang A H, Wang L, Deng L W, Li W J, Lu Y Q, Weng Q J, Liu K Y, Huang T, Zhou T Y, Jing Y F, Li W, Lin Z, Buckler E S, Qian Q, Zhang Q F, Li J Y, Han B. 2010. Genome-wide association studies of 14 agronomic traits in rice landraces. Nat Genet, 42(11): 961-967. |
| [21] | Isshiki M, Matsuda Y, Takasaki A, Wong H L, Satoh H, Shimamoto K. 2008. Du3, a mRNA cap-binding protein gene, regulates amylose content in japonica rice seeds. Plant Biotechnol, 25(5): 483-487. |
| [22] | Jiang C H, Rashid M A R, Zhang Y H, Zhao Y, Pan Y H. 2022. Genome wide association study on development and evolution of glutinous rice. BMC Genom Data, 23(1): 33. |
| [23] | Jiang J H, Song S J, Hu C M, Jing C Y, Xu Q, Li X R, Zhang M Y, Hai M, Shen J M, Zhang Y, Wang D Z, Dang X J. 2024. QTL detection and candidate gene identification for eating and cooking quality traits in rice (Oryza sativa L.) via a genome- wide association study. Int J Mol Sci, 25(1): 630. |
| [24] | Jin L, Lu Y, Shao Y F, Zhang G, Xiao P, Shen S Q, Corke H, Bao J S. 2010. Molecular marker assisted selection for improvement of the eating, cooking and sensory quality of rice (Oryza sativa L.). J Cereal Sci, 51(1): 159-164. |
| [25] | Kang H M, Sul J H, Service S K, Zaitlen N A, Kong S Y, Freimer N B, Sabatti C, Eskin E. 2010. Variance component model to account for sample structure in genome-wide association studies. Nat Genet, 42(4): 348-354. |
| [26] | Li H Y, Prakash S, Nicholson T M, Fitzgerald M A, Gilbert R G. 2016a. The importance of amylose and amylopectin fine structure for textural properties of cooked rice grains. Food Chem, 196: 702-711. |
| [27] | Li H Y, Prakash S, Nicholson T M, Fitzgerald M A, Gilbert R G. 2016b. Instrumental measurement of cooked rice texture by dynamic rheological testing and its relation to the fine structure of rice starch. Carbohydr Polym, 146: 253-263. |
| [28] | Li H Y, Gilbert R G. 2018. Starch molecular structure: The basis for an improved understanding of cooked rice texture. Carbohydr Polym, 195: 9-17. |
| [29] | Li J Y, Wang J, Zeigler R S. 2014. The 3,000 rice genomes project: New opportunities and challenges for future rice research. GigaScience, 3(1): 8. |
| [30] | Li M X, Yeung J M Y, Cherny S S, Sham P C. 2012. Evaluating the effective numbers of independent tests and significant p-value thresholds in commercial genotyping arrays and public imputation reference datasets. Hum Genet, 131(5): 747-756. |
| [31] | Lin J R, Shi C H, Wu M G, Wu J G. 2005. Analysis of genetic effects for cooking quality traits of japonica rice across environments. Plant Sci, 168(6): 1501-1506. |
| [32] | Liu L L, Ma X D, Liu S J, Zhu C L, Jiang L, Wang Y H, Shen Y, Ren Y L, Dong H, Chen L M, Liu X, Zhao Z G, Zhai H Q, Wan J M. 2009. Identification and characterization of a novel Waxy allele from a Yunnan rice landrace. Plant Mol Biol, 71(6): 609-626. |
| [33] | Liu Q Q, Li Q F, Cai X L, Wang H M, Tang S Z, Yu H X, Wang Z Y, Gu M H. 2006. Molecular marker-assisted selection for improved cooking and eating quality of two elite parents of hybrid rice. Crop Sci, 46(6): 2354-2360. |
| [34] | Matsushima R, Maekawa M, Kusano M, Tomita K, Kondo H, Nishimura H, Crofts N, Fujita N, Sakamoto W. 2016. Amyloplast membrane protein SUBSTANDARD STARCH GRAIN6 controls starch grain size in rice endosperm. Plant Physiol, 170(3): 1445-1459. |
| [35] | Mikami I, Uwatoko N, Ikeda Y, Yamaguchi J, Hirano H Y, Suzuki Y, Sano Y. 2008. Allelic diversification at the wx locus in landraces of Asian rice. Theor Appl Genet, 116(7): 979-989. |
| [36] | Misra G, Badoni S, Domingo C J, Cuevas R P O, Llorente C, Mbanjo E G N, Sreenivasulu N. 2018. Deciphering the genetic architecture of cooked rice texture. Front Plant Sci, 9: 1405. |
| [37] | Purcell S, Neale B, Todd-Brown K, Thomas L, Ferreira M A R, Bender D, Maller J, Sklar P, de Bakker P I W, Daly M J, Sham P C. 2007. PLINK: A tool set for whole-genome association and population-based linkage analyses. Am J Hum Genet, 81(3): 559-575. |
| [38] | Sato H, Suzuki Y, Sakai M, Imbe T. 2002. Molecular characterization of wx-mq, a novel mutant gene for low-amylose content in endosperm of rice (Oryza sativa L.). Breed Sci, 52(2): 131-135. |
| [39] | Schliep K P. 2011. Phangorn: Phylogenetic analysis in R. Bioinformatics, 27(4): 592-593. |
| [40] | Sharif M K, Butt M S, Anjum F M, Khan S H. 2014. Rice bran: A novel functional ingredient. Crit Rev Food Sci Nutr, 54(6): 807-816. |
| [41] | Shi S J, Wang E T, Li C X, Cai M L, Cheng B, Cao C G, Jiang Y. 2022. Use of protein content, amylose content, and RVA parameters to evaluate the taste quality of rice. Front Nutr, 8: 758547. |
| [42] | Song X G, Meng X B, Guo H Y, Cheng Q, Jing Y H, Chen M J, Liu G F, Wang B, Wang Y H, Li J Y, Yu H. 2022. Targeting a gene regulatory element enhances rice grain yield by decoupling panicle number and size. Nat Biotechnol, 40(9): 1403-1411. |
| [43] | Takeda T, Toyofuku K, Matsukura C, Yamaguchi J. 2001. Sugar transporters involved in flowering and grain development of rice. J Plant Physiol, 158(4): 465-470. |
| [44] | Tian Z X, Qian Q, Liu Q Q, Yan M X, Liu X F, Yan C J, Liu G F, Gao Z Y, Tang S Z, Zeng D L, Wang Y H, Yu J M, Gu M H, Li J Y. 2009. Allelic diversities in rice starch biosynthesis lead to a diverse array of rice eating and cooking qualities. Proc Natl Acad Sci USA, 106: 21760-21765. |
| [45] | Traore K, McClung A M, Chen M H, Fjellstrom R. 2011. Inheritance of flour paste viscosity is associated with a rice Waxy gene exon 10 SNP marker. J Cereal Sci, 53(1): 37-44. |
| [46] | Wang H, Zhu S S, Dang X J, Liu E B, Hu X X, Eltahawy M S, Zaid I U, Hong D L. 2019. Favorable alleles mining for gelatinization temperature, gel consistency and amylose content in Oryza sativa by association mapping. BMC Genet, 20(1): 34. |
| [47] | Wang L Q, Liu W J, Xu Y, He Y Q, Luo L J, Xing Y Z, Xu C G, Zhang Q F. 2007. Genetic basis of 17 traits and viscosity parameters characterizing the eating and cooking quality of rice grain. Theor Appl Genet, 115(4): 463-476. |
| [48] | Wang Q, Tang J L, Han B, Huang X H. 2020. Advances in genome- wide association studies of complex traits in rice. Theor Appl Genet, 133(5): 1415-1425. |
| [49] | Wang W S, Mauleon R, Hu Z Q, Chebotarov D, Tai S S, Wu Z C, Li M, Zheng T Q, Fuentes R R, Zhang F, Mansueto L, Copetti D, Sanciangco M, Palis K C, Xu J L, Sun C, Fu B Y, Zhang H L, Gao Y M, Zhao X Q, Shen F, Cui X, Yu H, Li Z C, Chen M L, Detras J, Zhou Y L, Zhang X Y, Zhao Y, Kudrna D, Wang C C, Li R, Jia B, Lu J Y, He X C, Dong Z T, Xu J B, Li Y H, Wang M, Shi J X, Li J, Zhang D B, Lee S, Hu W S, Poliakov A, Dubchak I, Ulat V J, Borja F N, Mendoza J R, Ali J, Li J, Gao Q, Niu Y C, Yue Z, Naredo M E B, Talag J, Wang X Q, Li J J, Fang X D, Yin Y, Glaszmann J C, Zhang J W, Li J Y, Hamilton R S, Wing R A, Ruan J, Zhang G Y, Wei C C, Alexandrov N, McNally K L, Li Z K, Leung H. 2018. Genomic variation in 3,010 diverse accessions of Asian cultivated rice. Nature, 557: 43-49. |
| [50] | Wang X Q, Pang Y L, Zhang J, Wu Z C, Chen K, Ali J, Ye G Y, Xu J L, Li Z K. 2017. Genome-wide and gene-based association mapping for rice eating and cooking characteristics and protein content. Sci Rep, 7(1): 17203. |
| [51] | Wang Z Y, Zheng F Q, Shen G Z, Gao J P, Snustad D P, Li M G, Zhang J L, Hong M M. 1995. The amylose content in rice endosperm is related to the post-transcriptional regulation of the waxy gene. Plant J, 7(4): 613-622. |
| [52] | Xu F F, Zhang G, Tong C, Sun X, Corke H, Sun M, Bao J S. 2013. Association mapping of starch physicochemical properties with starch biosynthesizing genes in waxy rice (Oryza sativa L.). J Agric Food Chem, 61(42): 10110-10117. |
| [53] | Xu F F, Sun C X, Huang Y, Chen Y L, Tong C, Bao J S. 2015. QTL mapping for rice grain quality: A strategy to detect more QTLs within sub-populations. Mol Breed, 35(4): 105. |
| [54] | Xu F F, Bao J S, He Q, Park Y J. 2016. Genome-wide association study of eating and cooking qualities in different subpopulations of rice (Oryza sativa L.). BMC Genomics, 17: 663. |
| [55] | Xu X M, Xu Z J, Matsue Y, Xu Q. 2019. Effects of genetic background and environmental conditions on texture properties in a recombinant inbred population of an inter-subspecies cross. Rice, 12(1): 32. |
| [56] | Xu X Y, E Z G, Zhang D P, Yun Q B, Zhou Y, Niu B X, Chen C. 2021. OsYUC11-mediated auxin biosynthesis is essential for endosperm development of rice. Plant Physiol, 185(3): 934-950. |
| [57] | Yan B, Tondi Yacouba N, Chen J X, Wang Y, Gao G J, Zhang Q L, Liu X, He Y Q. 2014. Analysis of minor quantitative trait loci for eating and cooking quality traits in rice using a recombinant inbred line population derived from two indica cultivars with similar amylose content. Mol Breed, 34(4): 2151-2163. |
| [58] | Yan C J, Tian Z X, Fang Y W, Yang Y C, Li J, Zeng S Y, Gu S L, Xu C W, Tang S Z, Gu M H. 2011. Genetic analysis of starch paste viscosity parameters in glutinous rice (Oryza sativa L.). Theor Appl Genet, 122(1): 63-76. |
| [59] | Yang F, Chen Y L, Tong C, Huang Y, Xu F F, Li K H, Corke H, Sun M, Bao J S. 2014. Association mapping of starch physicochemical properties with starch synthesis-related gene markers in nonwaxy rice (Oryza sativa L.). Mol Breed, 34(4): 1747-1763. |
| [60] | Yang J, Lee S H, Goddard M E, Visscher P M. 2011. GCTA: A tool for genome-wide complex trait analysis. Am J Hum Genet, 88(1): 76-82. |
| [61] | Yin L L, Zhang H H, Tang Z S, Xu J Y, Yin D, Zhang Z W, Yuan X H, Zhu M J, Zhao S H, Li X Y, Liu X L. 2021. rMVP: A memory-efficient, visualization-enhanced, and parallel-accelerated tool for genome-wide association study. Genom Proteomics Bioinformatics, 19(4): 619-628. |
| [62] | Zeng D L, Yan M X, Wang Y H, Liu X F, Qian Q, Li J Y. 2007. Du1, encoding a novel Prp1 protein, regulates starch biosynthesis through affecting the splicing of Wxb pre-mRNAs in rice (Oryza sativa L.). Plant Mol Biol, 65(4): 501-509. |
| [63] | Zhang C, Dong S S, Xu J Y, He W M, Yang T L. 2019. PopLDdecay: A fast and effective tool for linkage disequilibrium decay analysis based on variant call format files. Bioinformatics, 35(10): 1786-1788. |
| [64] | Zhang C Q, Zhu J H, Chen S J, Fan X L, Li Q F, Lu Y, Wang M, Yu H X, Yi C D, Tang S Z, Gu M H, Liu Q Q. 2019. Wxlv, the ancestral allele of rice waxy gene. Mol Plant, 12(8): 1157-1166. |
| [65] | Zhang R L, Jia G Q, Diao X M. 2023. geneHapR: An R package for gene haplotypic statistics and visualization. BMC Bioinformatics, 24(1): 199. |
| [66] | Zhao C F, Zhao L, Zhao Q Y, Chen T, Yao S, Zhu Z, Zhou L H, Nadaf A B, Liang W H, Lu K, Zhang Y D, Wang C L. 2020. Genetic dissection of eating and cooking qualities in different subpopulations of cultivated rice (Oryza sativa L.) through association mapping. BMC Genet, 21(1): 119. |
| [67] | Zhao L, Zhao C F, Zhou L H, Zhao Q Y, Zhu Z, Chen T, Yao S, Zhang Y D, Wang C L. 2021. QTL mapping for starch paste viscosity of rice (Oryza sativa L.) using chromosome segment substitution lines derived from two sequenced cultivars with the same Wx allele. BMC Genomics, 22(1): 596. |
| [68] | Zhou H, Xia D, Zhao D, Li Y H, Li P B, Wu B, Gao G J, Zhang Q L, Wang G W, Xiao J H, Li X H, Yu S B, Lian X M, He Y Q. 2021. The origin of Wxla provides new insights into the improvement of grain quality in rice. J Integr Plant Biol, 63(5): 878-888. |
| No related articles found! |
| 阅读次数 | ||||||
|
全文 |
|
|||||
|
摘要 |
|
|||||