Rice Science ›› 2025, Vol. 32 ›› Issue (5): 717-726.DOI: 10.1016/j.rsci.2025.04.012
收稿日期:2025-02-12
接受日期:2025-04-22
出版日期:2025-09-28
发布日期:2025-10-11
. [J]. Rice Science, 2025, 32(5): 717-726.
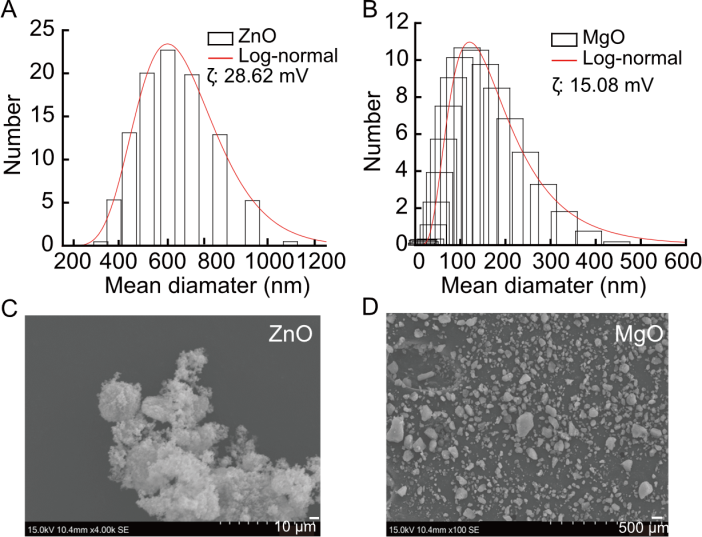
Fig. 1. Size distribution and morphology of ZnO and MgO nanoparticles (NPs). A and B, Hydrodynamic size distributions of ZnO NPs (A) measured by dynamic light scattering and MgO NPs (B) analyzed by the instrument’s fitting software. Histograms represent particle count versus mean diameter, with red curves indicating log-normal distribution fits. The zeta potential (ζ) values are noted, reflecting colloidal stability: 28.62 mV for ZnO NPs and 15.08 mV for MgO NPs. C and D, Scanning electron microscopy images of ZnO (C) and MgO (D) NPs at different magnifications, showing the structure of ZnO and the dispersed, irregular morphology of MgO particles.
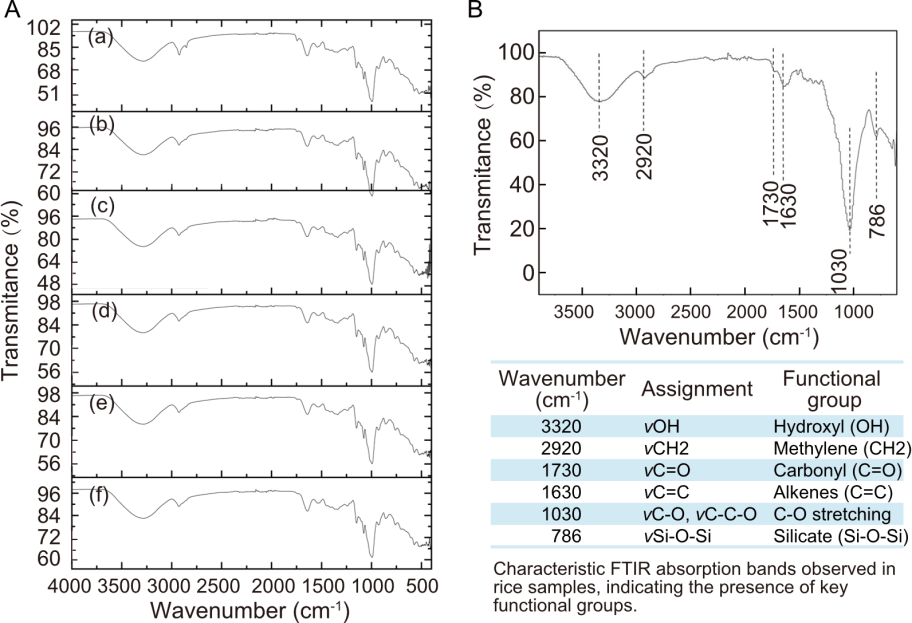
Fig. 2. Fourier transform infrared spectroscopy (FTIR) spectral analysis of different rice samples from various geographical origins and processing states. A, FTIR spectra of brown rice (a) and white rice (b) from Mexico, brown rice (c) and white rice (d) from the United States of America, white rice from Thailand (e), and white rice from India (f). B, A representative FTIR spectrum highlighting key functional group assignments.
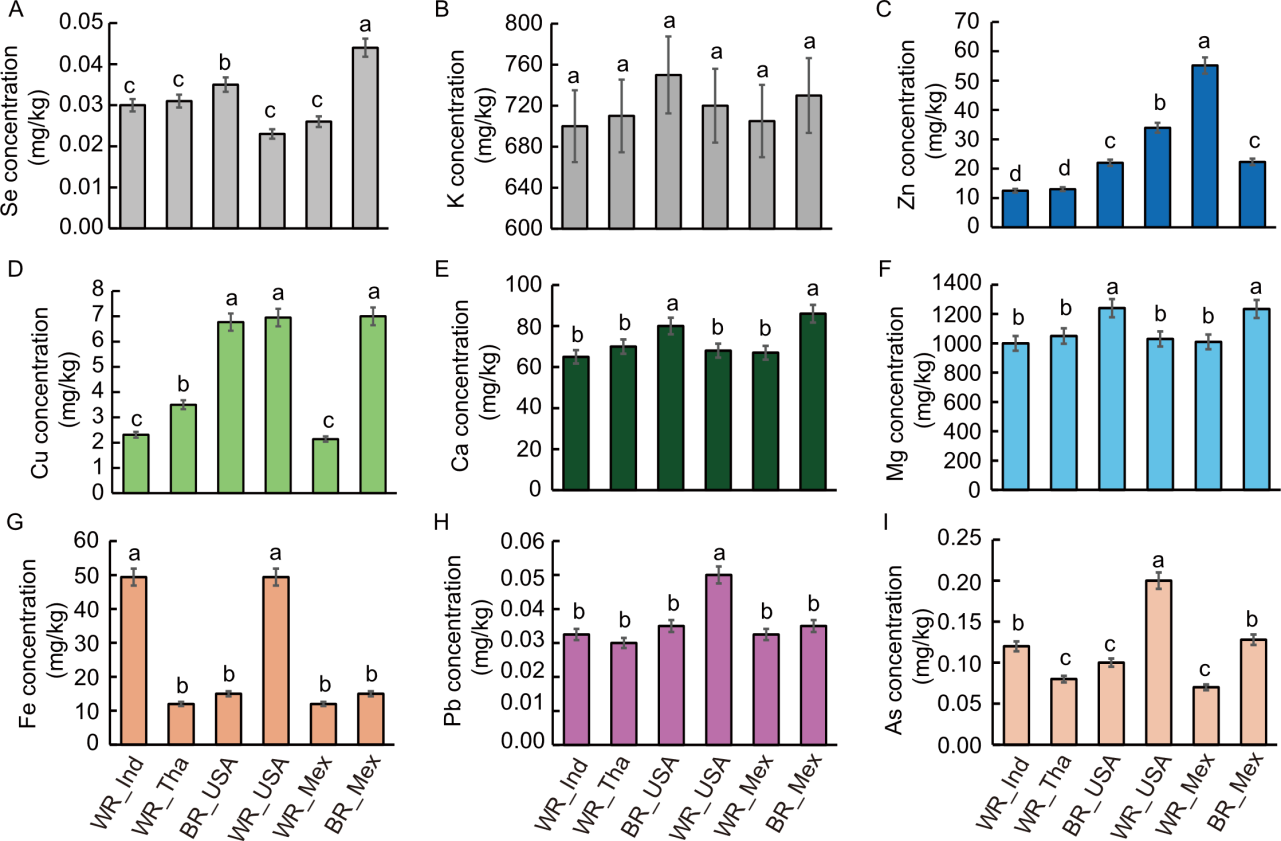
Fig. 3. Comparison of elemental concentrations in different rice types from various countries, including white rice (WR) and brown rice (BR) sourced from India (Ind), Thailand (Tha), the United States of America (USA), and Mexico (Mex). A-I show concentrations (mg/kg dry weight) of selenium (Se, A), potassium (K, B), zinc (Zn, C), copper (Cu, D), calcium (Ca, E), magnesium (Mg, F), iron (Fe, G), lead (Pb, H), and arsenic (As, I). Data are mean ± SE (n = 3). Different lowercase letters above bars indicate statistically significant differences at the 0.05 level among rice types for each element based on ANOVA followed by the post-hoc test.
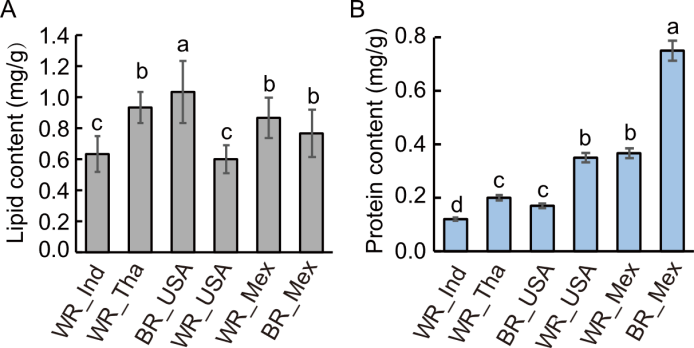
Fig. 4. Lipid (A) and protein (B) contents measured in white rice (WR) and brown rice (BR) sourced from India (Ind), Thailand (Tha), the United States of America (USA), and Mexico (Mex). Data are mean ± SE (n = 3). Different letters above bars indicate statistically significant differences at the 0.05 level among rice types for each element based on ANOVA followed by post-hoc test.
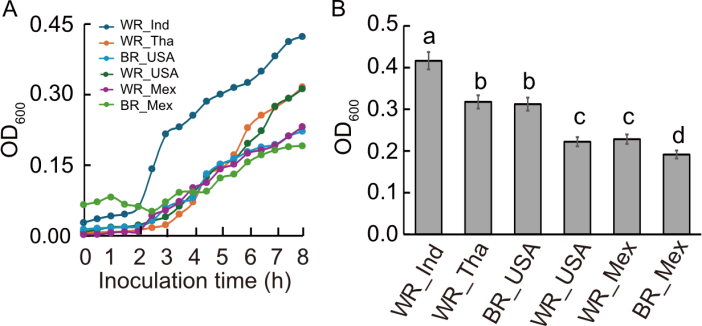
Fig. 5. Growth response of Escherichia coli in presence of different rice types. A and B, Growth curves of E. coli (A) and maximum E. coli growth (B) (measured by OD600) over an 8-h inoculation period in media supplemented with various white (WR) and brown (BR) rice types from India (Ind), Thailand (Tha), the United States of Ameirica (USA), and Mexico (Mex). Data are mean ± SE (n = 3). Different lowercase letters above bars indicate statistically significant differences at the 0.05 level among rice types for each element based on ANOVA followed by post-hoc test.
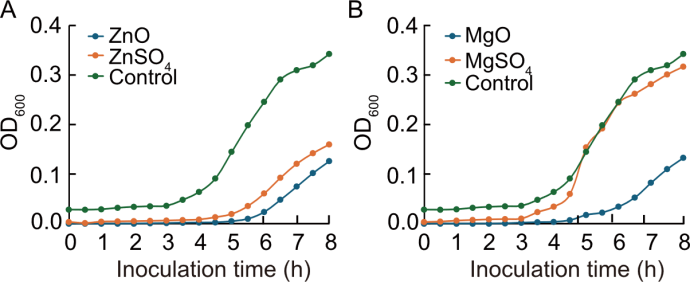
Fig. 6. Inhibition of Escherichia coli growth by nanoparticles (NPs) and ionic treatments over an 8-h period. A, Growth curves of E. coli in rice treated with ZnO NPs, ZnSO4, and control. B, Growth curves of E. coli in rice treated with MgO NPs, MgSO4, and control.
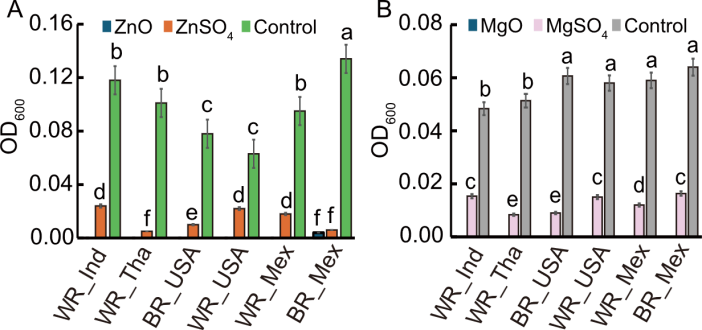
Fig. 7. Comparative Escherichia coli growth in rice samples treated with ZnO and MgO nanoparticles (NPs) versus their ionic counterparts on white (WR) and brown (BR) rice from India (Ind), Thailand (Tha), the United States of Ameirica (USA), and Mexico (Mex). A, Effect of ZnO NPs and ZnSO4 on E. coli growth across different rice types. B, Effect of MgO NPs and MgSO4 on E. coli growth across different rice types. Statistical significance (P < 0.05) among rice types is indicated by different lowercase letters above bars.
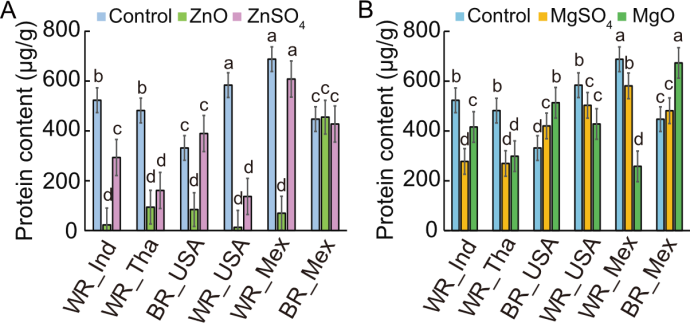
Fig. 8. Protein concentration in various rice types after exposure to Escherichia coli under different nanoparticles (NPs) and ionic treatments on white (WR) and brown (BR) rice from India (Ind), Thailand (Tha), the United States of America (USA), and Mexico (Mex). A, Protein levels in rice samples treated with ZnO NPs, ZnSO4, and control. B, Protein levels in rice samples treated with MgO NPs, MgSO4, and control. Statistical significance (P < 0.05) among rice types is indicated by different lowercase letters above bars.
| [1] | Ahmad Z, Niyazi S, Firdoos A, et al. 2024. Enhancing plant resilience: Nanotech solutions for sustainable agriculture. Heliyon, 10(23): e40735. |
| [2] | Ali S S, Sonbol F I, Sun J Z, et al. 2020. Molecular characterization of virulence and drug resistance genes-producing Escherichia coli isolated from chicken meat: Metal oxide nanoparticles as novel antibacterial agents. Microb Pathog, 143: 104164. |
| [3] | Arámbula J, Mohammadi S, Mahdaviarab A, et al. 2023. Application of the Zn0.5Mn0.5Fe2O4-PMMA nanocomposite for efficient removal of complex organic pollutants. New J Chem, 47: 22235-22245. |
| [4] | Boyd S M, Rhinehardt K L, Ewunkem A J, et al. 2022. Experimental evolution of copper resistance in Escherichia coli produces evolutionary trade-offs in the antibiotics chloramphenicol, bacitracin, and sulfonamide. Antibiotics, 11(6): 711. |
| [5] | Cherayil B J. 2011. The role of iron in the immune response to bacterial infection. Immunol Res, 50(1): 1-9. |
| [6] | Cochrane N, Childs N, Rosen S. 2016. Haiti’s U.S. rice imports. [2024-12-23]. https://www.ers.usda.gov/amber-waves/2016/january-february/rice-imports-help-alleviate-haiti-s-food-needs. |
| [7] | da Silva I J S, Lavorante A F, Paim A P S, et al. 2020. Microwave-assisted digestion employing diluted nitric acid for mineral determination in rice by ICP OES. Food Chem, 319: 126435. |
| [8] | del Prado-Audelo M L, Bernal-Chávez S A, Gutiérrez-Ruíz S C, et al. 2022. Stability phenomena associated with the development of polymer-based nanopesticides. Oxid Med Cell Longev, 2022: 5766199. |
| [9] | Doria-Manzur A, Sharifan H, Tejeda-Benitez L. 2023. Application of zinc oxide nanoparticles to promote remediation of nickel by Sorghum bicolor: Metal ecotoxic potency and plant response. Int J Phytoremediat, 25(1): 98-105. |
| [10] | Elbing K L, Brent R. 2018. Recipes and tools for culture of Escherichia coli. Curr Protoc Mol Biol, 125(1): e83. |
| [11] | Frazier E A, Patil R P, Mane C B, et al. 2023. Environmental exposure and nanotoxicity of titanium dioxide nanoparticles in irrigation water with the flavonoid luteolin. RSC Adv, 13(21): 14110-14118. |
| [12] | García-Rodríguez A, Moreno-Olivas F, Marcos R, et al. 2020. The role of metal oxide nanoparticles, Escherichia coli, and Lactobacillus rhamnosus on small intestinal enzyme activity. Environ Sci Nano, 7(12): 3940-3964. |
| [13] | Guevara J, Gonzalez V, Saenz J A, et al. 2024. Designing an interdisciplinary forensic chemistry lab module: The impact of environmental factors on treated hair with personal care products. J Chem Educ, 101(10): 4390-4397. |
| [14] | Gutierrez M, Mohammadi S, Gonzalez V, et al. 2025. Integrating reductive and photocatalytic nanomaterials: Mechanistic insights into the selective adsorption and degradation of cationic contaminants in aqueous environments. Mater Today Sustain, 31: 101180. |
| [15] | Hayoun M, Chen R J, Swinkels H M, et al. 2024. Biological weapon toxicity. In: StatPearls. Treasure Island, USA: StatPearls Publishing. |
| [16] | He Y P, Ingudam S, Reed S, et al. 2016. Study on the mechanism of antibacterial action of magnesium oxide nanoparticles against foodborne pathogens. J Nanobiotechnol, 14(1): 54. |
| [17] | Jnani D, Ray S D. 2024. Escherichia coli. Encyclopedia of Toxicology. Amsterdam, the Netherlands: Elsevier: 357-367. |
| [18] | Karagas M R, Punshon T, Davis M, et al. 2019. Rice intake and emerging concerns on arsenic in rice: A review of the human evidence and methodologic challenges. Curr Environ Health Rep, 6(4): 361-372. |
| [19] | Koski-Karell V, Monprevil R J, Schell J, et al. 2024. Exposure to the global rice trade: A comparative study of arsenic and cadmium in rice consumed in Haiti. J Agric Food Syst Community Dev, 13(2): 1-15. |
| [20] | Kunwittaya S, Ruksee N, Khamnong T, et al. 2022. Inorganic arsenic contamination and the health of children living near an inactive mining site: Northern Thailand. EXCLI J, 21: 1007-1014. |
| [21] | Liu J H, Ma X, Xu Y, et al. 2017. Low toxicity and accumulation of zinc oxide nanoparticles in mice after 270-day consecutive dietary supplementation. Toxicol Res, 6(2): 134-143. |
| [22] | Ma X M, Sharifan H, Dou F G, et al. 2020. Simultaneous reduction of arsenic (As) and cadmium (Cd) accumulation in rice by zinc oxide nanoparticles. Chem Eng J, 384: 123802. |
| [23] | Mahdaviarab A, Pahlavanyali K, Cheng R, et al. 2025. Emergency mass disposal of milk: Options and considerations. J Environ Manag, 376: 124420. |
| [24] | Meharg A A, Zhao F J. 2012. Arsenic & Rice. Dordrecht, the Netherlands: Springer. |
| [25] | Mendes C R, Dilarri G, Forsan C F, et al. 2022. Antibacterial action and target mechanisms of zinc oxide nanoparticles against bacterial pathogens. Sci Rep, 12(1): 2658. |
| [26] | Muhammed A, Asere T G, Diriba T F. 2024. Photocatalytic and antimicrobial properties of ZnO and Mg-doped ZnO nanoparticles synthesized using Lupinus albus leaf extract. ACS Omega, 9(2): 2480-2490. |
| [27] | Oerke E. 2004. Safeguarding production-losses in major crops and the role of crop protection. Crop Protection, 23(4): 275-285. |
| [28] | Rangel J M, Sparling P H, Crowe C, et al. 2005. Epidemiology of Escherichia coli O157:H7 outbreaks, United States, 1982-2002. Emerg Infect Dis, 11(4): 603-609. |
| [29] | Saini R K, Prasad P, Shang X M, et al. 2021. Advances in lipid extraction methods: A review. Int J Mol Sci, 22(24): 13643. |
| [30] | Savary S, Willocquet L, Pethybridge S J, et al. 2019. The global burden of pathogens and pests on major food crops. Nat Ecol Evol, 3(3): 430-439. |
| [31] | Schneider K K R, Schneider R G, Archer D L, et al. 2005. Agroterrorism in the U.S.: An Overview. [2024-12-23]. http://edis.ifas.ufl.edu. |
| [32] | Sezonov G, Joseleau-Petit D, D’Ari R. 2007. Escherichia coli physiology in Luria-bertani broth. J Bacteriol, 189(23): 8746-8749. |
| [33] | Shah J. 2005. Lipids, lipases, and lipid-modifying enzymes in plant disease resistance. Annu Rev Phytopathol, 43: 229-260. |
| [34] | Sharifan H, Ma X M. 2021. Foliar application of Zn agrichemicals affects the bioavailability of arsenic, cadmium and micronutrients to rice (Oryza sativa L.) in flooded paddy soil. Agriculture, 11(6): 505. |
| [35] | Shen C H. 2023. Quantification and analysis of proteins. In: Diagnostic Molecular Biology. Amsterdam, the Netherlands: Elsevier: 231-257. |
| [36] | Singh A, Sharma A, Singh O, et al. 2024. In-depth exploration of nanoparticles for enhanced nutrient use efficiency and abiotic stresses management: Present insights and future horizons. Plant Stress, 14: 100576. |
| [37] | Tolins M, Ruchirawat M, Landrigan P. 2014. The developmental neurotoxicity of arsenic: Cognitive and behavioral consequences of early life exposure. Ann Glob Health, 80(4): 303-314. |
| [38] | Tripathi R, Tewari R, Singh K P, et al. 2022. Plant mineral nutrition and disease resistance: A significant linkage for sustainable crop protection. Front Plant Sci, 13: 883970. |
| [39] | Tyler C R, Allan A M. 2014. The effects of arsenic exposure on neurological and cognitive dysfunction in human and rodent studies: A review. Curr Environ Health Rep, 1(2): 132-147. |
| [40] | Wahab S, Salman A, Khan Z, et al. 2023. Metallic nanoparticles: A promising arsenal against antimicrobial resistance: Unraveling mechanisms and enhancing medication efficacy. Int J Mol Sci, 24(19): 14897. |
| [41] | Wallace R B, Oria M. 2010. Enhancing Food Safety:The role of the Food and Drug Administration. Washington, USA: National Academies Press. |
| [42] | Wang X X, Sun W J, Zhang S, et al. 2018. Elucidating the effects of cerium oxide nanoparticles and zinc oxide nanoparticles on arsenic uptake and speciation in rice (Oryza sativa) in a hydroponic system. Environ Sci Technol, 52(17): 10040-10047. |
| [43] | Zavala Y J, Gerads R, Gorleyok H, et al. 2008. Arsenic in rice: II. Arsenic speciation in USA grain and implications for human health. Environ Sci Technol, 42(10): 3861-3866. |
| No related articles found! |
| 阅读次数 | ||||||
|
全文 |
|
|||||
|
摘要 |
|
|||||