Rice Science ›› 2025, Vol. 32 ›› Issue (5): 727-746.DOI: 10.1016/j.rsci.2025.05.005
• • 上一篇
收稿日期:2025-03-19
接受日期:2025-05-26
出版日期:2025-09-28
发布日期:2025-10-11
. [J]. Rice Science, 2025, 32(5): 727-746.
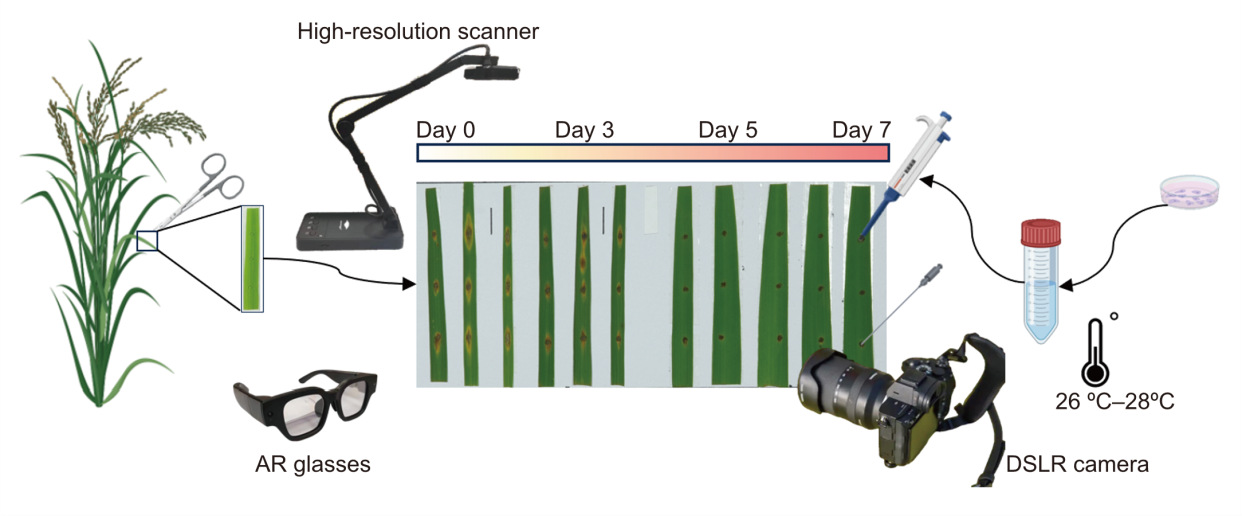
Fig. 1. Process of material preparation and image collection. AR, Augmented reality; DSLR, Digital single-lens reflex
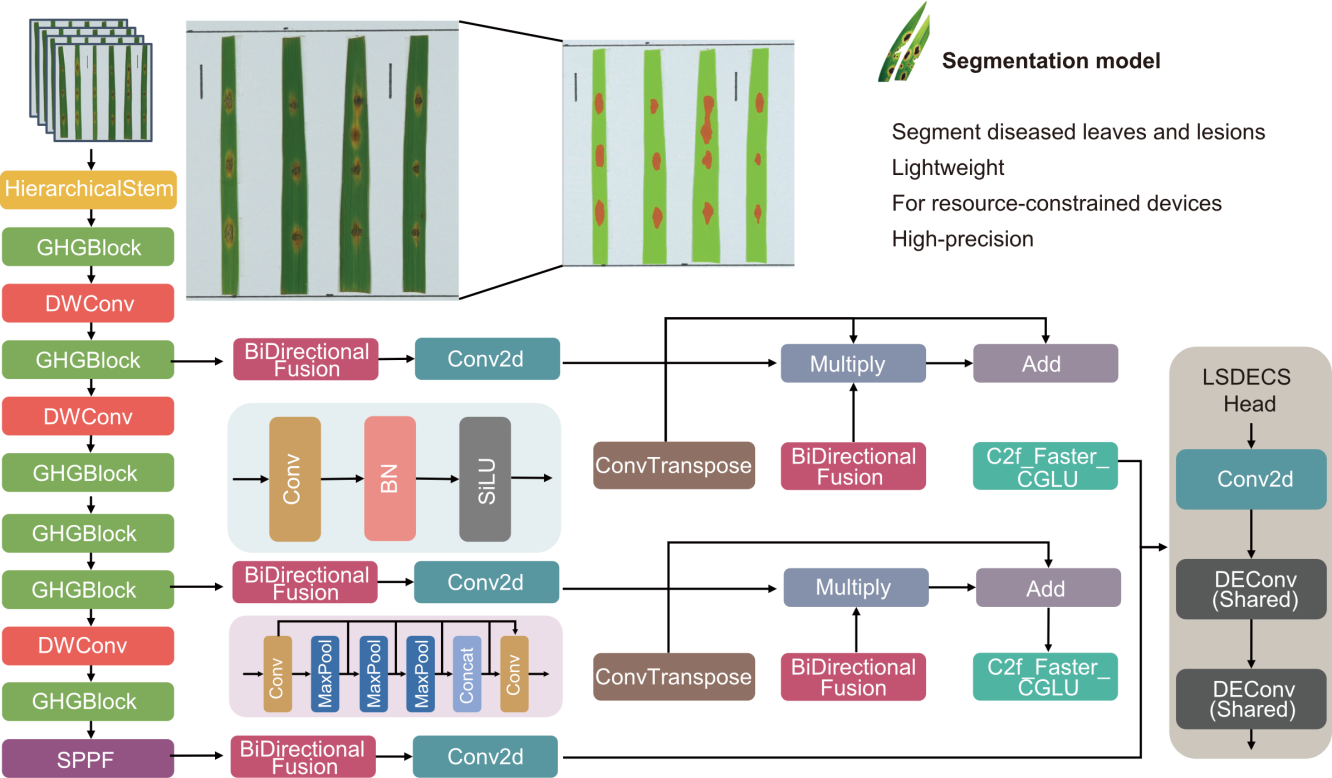
Fig. 2. Structural diagram of diseased leaf and lesion segmentation model. BN, Batch normalization; Deconv, Detail enhancement convolution; SPPF, Spatial pyramid pooling fast; Conv, Convolution; Concat, Concatenation; SiLU, Sigmoid linear unit; DWConv, Depth-wise convolution.
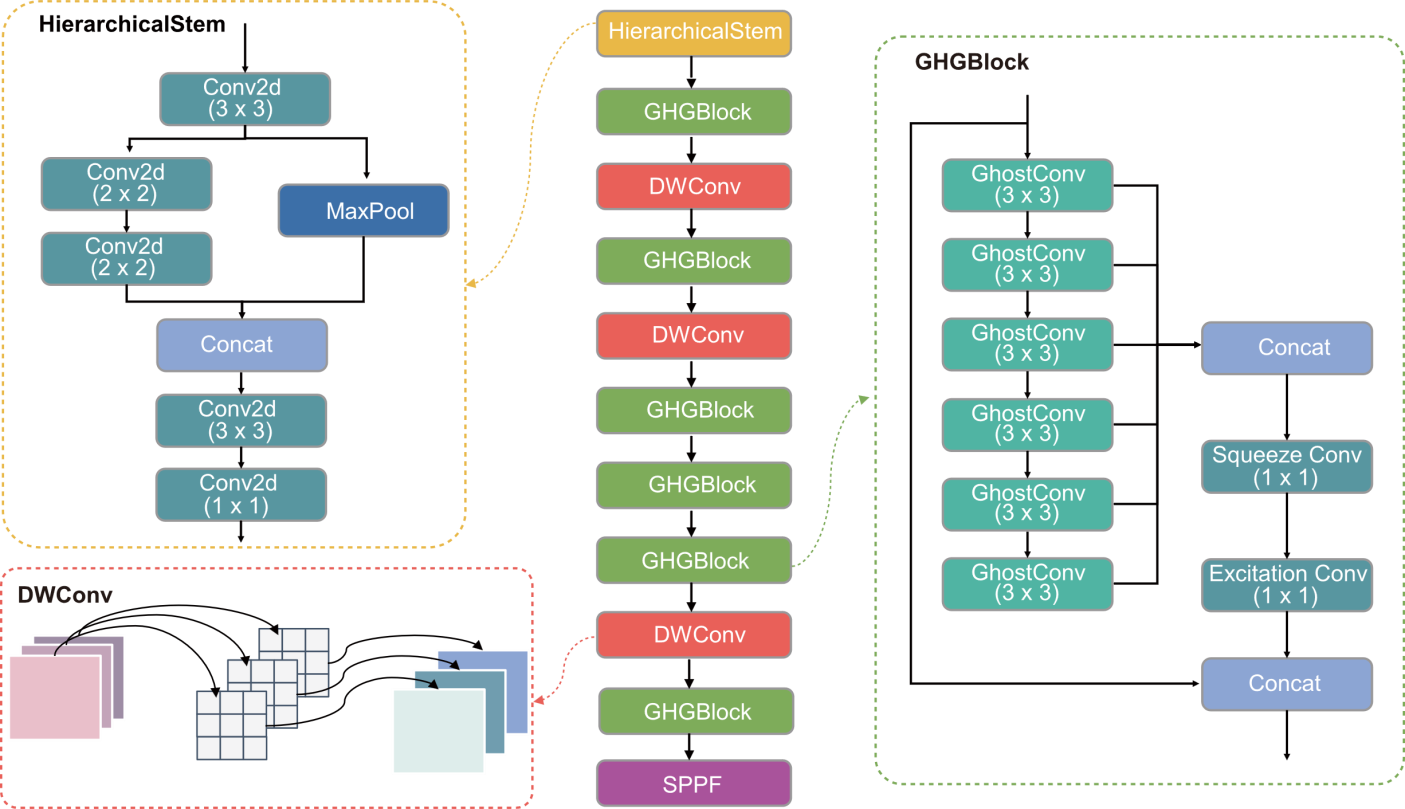
Fig. 3. Structural diagram of GhostHierarchicalNet. DWConv, Depth-wise convolution; SPPF, Spatial pyramid pooling fast; Concat, Concatenation.
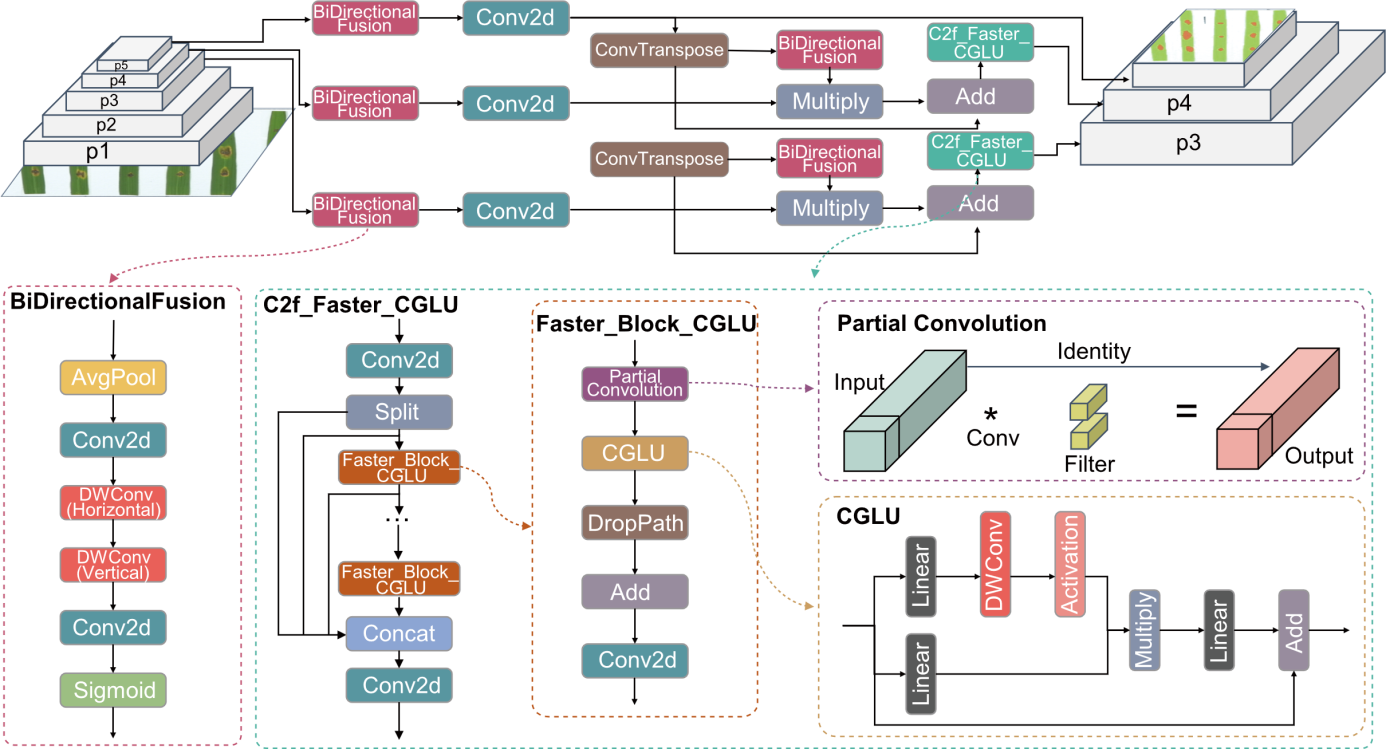
Fig. 4. Structural diagram of CAHSFPN. DWConv, Depth-wise convolution; Concat, Concatenation; CGLU, Convolutional gated linear unit.
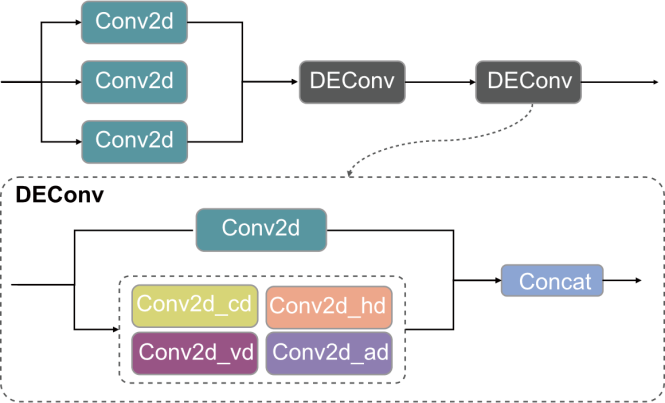
Fig. 5. Structural diagram of LSDECS Head. DEConv, Detail enhancement convolution; Conv2d_cd, Center difference convolution; Conv2d_hd, Horizontal difference convolution; Conv2d_vd, Vertical difference convolution; Conv2d_ad, Angle difference convolution.
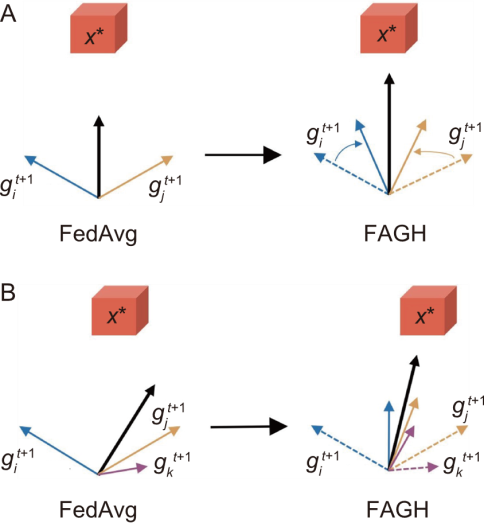
Fig. 6. Comparison of federated learning. A, Two gradients. B, Three gradients. FedAvg, Federated averaging; FAGH, Federated averaging with gradient harmonization.
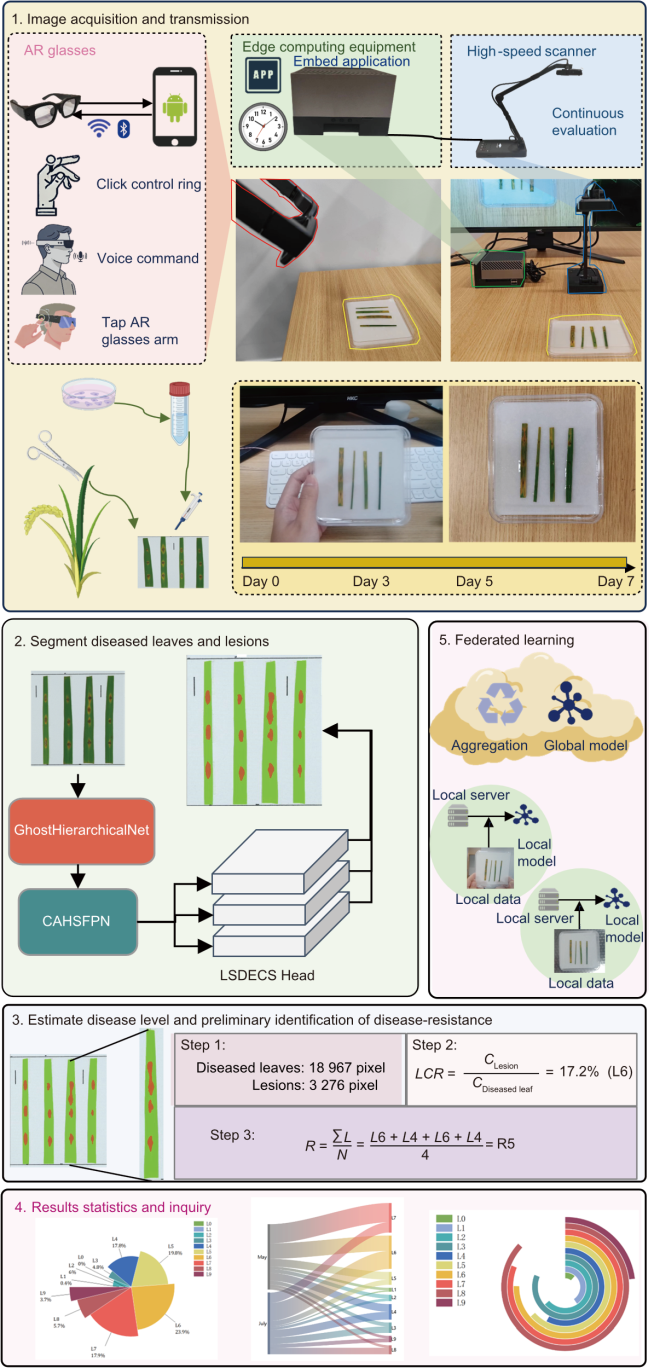
Fig. 7. Overall workflow diagram. AR, Augmented reality.
| Disease level | Lesion coverage ratio (LCR) |
|---|---|
| L0 | 0 |
| L1 | 0 < LCR ≤ 0.010 |
| L2 | 0.010 < LCR ≤ 0.020 |
| L3 | 0.020 < LCR ≤ 0.035 |
| L4 | 0.035 < LCR ≤ 0.060 |
| L5 | 0.060 < LCR ≤ 0.100 |
| L6 | 0.100 < LCR ≤ 0.250 |
| L7 | 0.250 < LCR ≤ 0.500 |
| L8 | 0.500 < LCR ≤ 0.750 |
| L9 | 0.750 < LCR ≤ 1.000 |
Table 1. Criteria for evaluation blast disease and disease-resistance in identification.
| Disease level | Lesion coverage ratio (LCR) |
|---|---|
| L0 | 0 |
| L1 | 0 < LCR ≤ 0.010 |
| L2 | 0.010 < LCR ≤ 0.020 |
| L3 | 0.020 < LCR ≤ 0.035 |
| L4 | 0.035 < LCR ≤ 0.060 |
| L5 | 0.060 < LCR ≤ 0.100 |
| L6 | 0.100 < LCR ≤ 0.250 |
| L7 | 0.250 < LCR ≤ 0.500 |
| L8 | 0.500 < LCR ≤ 0.750 |
| L9 | 0.750 < LCR ≤ 1.000 |
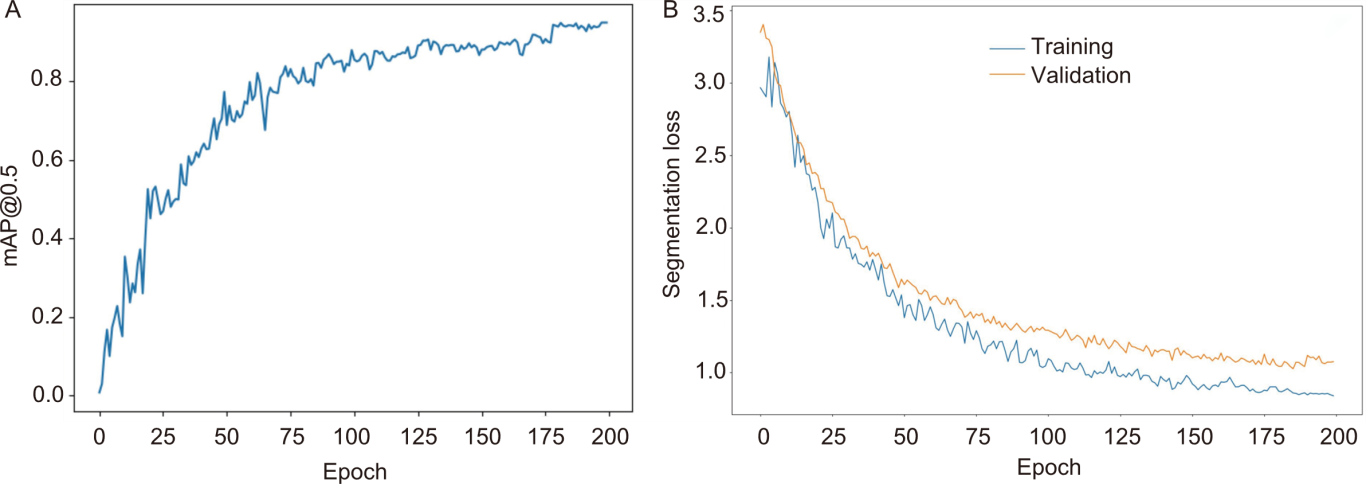
Fig. 8. Metrics variation during model training. A, Variation of mean average precision (mAP@0.5) across training epochs. B, Variation of segmentation loss across training epochs.
| Baseline | GhostHierarchicalNet | CAHSFPN | LSDECS Head | mAP@0.5 (%) | Parameter (M) | FLOPs (G) |
|---|---|---|---|---|---|---|
| ✓ | 94.4 | 3.2 | 12.0 | |||
| ✓ | ✓ | 95.4 | 2.5 | 10.7 | ||
| ✓ | ✓ | ✓ | 95.0 | 1.4 | 9.4 | |
| ✓ | ✓ | 95.7 | 2.2 | 11.3 | ||
| ✓ | ✓ | ✓ | 94.5 | 1.8 | 9.8 | |
| ✓ | ✓ | 94.7 | 2.4 | 10.0 | ||
| ✓ | ✓ | ✓ | 93.4 | 1.7 | 8.7 | |
| ✓ | ✓ | ✓ | ✓ | 95.0 | 1.2 | 9.0 |
Table 2. Comparative results of ablation experiments.
| Baseline | GhostHierarchicalNet | CAHSFPN | LSDECS Head | mAP@0.5 (%) | Parameter (M) | FLOPs (G) |
|---|---|---|---|---|---|---|
| ✓ | 94.4 | 3.2 | 12.0 | |||
| ✓ | ✓ | 95.4 | 2.5 | 10.7 | ||
| ✓ | ✓ | ✓ | 95.0 | 1.4 | 9.4 | |
| ✓ | ✓ | 95.7 | 2.2 | 11.3 | ||
| ✓ | ✓ | ✓ | 94.5 | 1.8 | 9.8 | |
| ✓ | ✓ | 94.7 | 2.4 | 10.0 | ||
| ✓ | ✓ | ✓ | 93.4 | 1.7 | 8.7 | |
| ✓ | ✓ | ✓ | ✓ | 95.0 | 1.2 | 9.0 |
| Treatment | mAP@0.5 (%) | FLOPs (G) | Parameter (M) |
|---|---|---|---|
| Before pruning | 95.0 | 9.0 | 1.20 |
| After pruning | 96.3 | 5.3 | 0.22 |
Table 3. Model performance before and after pruning.
| Treatment | mAP@0.5 (%) | FLOPs (G) | Parameter (M) |
|---|---|---|---|
| Before pruning | 95.0 | 9.0 | 1.20 |
| After pruning | 96.3 | 5.3 | 0.22 |
| Class | Precision | Recall | mAP@0.5 |
|---|---|---|---|
| Diseased leaf | 99.5 | 100.0 | 99.5 |
| Lesion | 94.0 | 90.6 | 93.1 |
| All | 96.7 | 95.3 | 96.3 |
Table 4. Performance evaluation on diseased leaf and lesion segmentation. %
| Class | Precision | Recall | mAP@0.5 |
|---|---|---|---|
| Diseased leaf | 99.5 | 100.0 | 99.5 |
| Lesion | 94.0 | 90.6 | 93.1 |
| All | 96.7 | 95.3 | 96.3 |
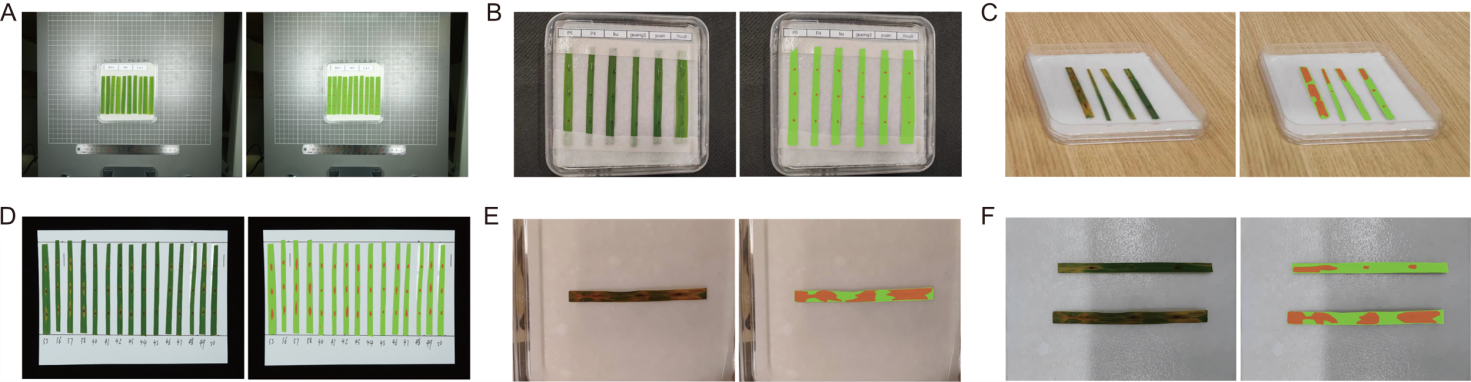
Fig. 9. Segmentation results under various conditions. A, Small diseased leaves and lesions in the image. B, Diseased leaves partially obstructed by wet filter paper, with water droplets obscuring the lesions. C, Misalignment of augmented reality (AR) glasses relative to diseased leaf during image capture. D, Re-evaluating historical experiment data in archive room. E, Warm color tone due to laboratory lighting conditions. F, Shadows affecting segmentation under high-speed scanner’s view. The left image shows original image, while the right image presents segmentation results. Green indicates diseased leaves, and orange represents lesions.
| Model | mAP@0.5 (%) | FLOPs (G) | Parameter (M) |
|---|---|---|---|
| FastInst | 83.1 | 112.9 | 53.0 |
| SparseInst | 88.5 | 86.0 | 51.2 |
| CondInst | 79.7 | 102.3 | 38.0 |
| BlendMask | 50.4 | 85.2 | 49.3 |
| Mask R-CNN | 58.8 | 149.0 | 44.7 |
| YOLOv8-Seg | 94.4 | 12.0 | 3.2 |
| YOLOv11-Seg | 91.2 | 10.4 | 2.8 |
| YOLOv12-Seg | 92.0 | 9.9 | 2.7 |
| Ours | 96.3 | 5.3 | 0.2 |
Table 5. Performance comparison of different segmentation models.
| Model | mAP@0.5 (%) | FLOPs (G) | Parameter (M) |
|---|---|---|---|
| FastInst | 83.1 | 112.9 | 53.0 |
| SparseInst | 88.5 | 86.0 | 51.2 |
| CondInst | 79.7 | 102.3 | 38.0 |
| BlendMask | 50.4 | 85.2 | 49.3 |
| Mask R-CNN | 58.8 | 149.0 | 44.7 |
| YOLOv8-Seg | 94.4 | 12.0 | 3.2 |
| YOLOv11-Seg | 91.2 | 10.4 | 2.8 |
| YOLOv12-Seg | 92.0 | 9.9 | 2.7 |
| Ours | 96.3 | 5.3 | 0.2 |
| Disease level | Number | Correct evaluation | Accuracy (%) |
|---|---|---|---|
| L0 | 0 | 0 | ‒ |
| L1 | 4 | 4 | 100.0 |
| L2 | 68 | 67 | 98.5 |
| L3 | 55 | 53 | 96.4 |
| L4 | 202 | 202 | 100.0 |
| L5 | 225 | 225 | 100.0 |
| L6 | 272 | 272 | 100.0 |
| L7 | 203 | 203 | 100.0 |
| L8 | 65 | 65 | 100.0 |
| L9 | 42 | 42 | 100.0 |
| Overall | 1 136 | 1 133 | 99.7 |
Table 6. Evaluation accuracy for different disease levels in test set.
| Disease level | Number | Correct evaluation | Accuracy (%) |
|---|---|---|---|
| L0 | 0 | 0 | ‒ |
| L1 | 4 | 4 | 100.0 |
| L2 | 68 | 67 | 98.5 |
| L3 | 55 | 53 | 96.4 |
| L4 | 202 | 202 | 100.0 |
| L5 | 225 | 225 | 100.0 |
| L6 | 272 | 272 | 100.0 |
| L7 | 203 | 203 | 100.0 |
| L8 | 65 | 65 | 100.0 |
| L9 | 42 | 42 | 100.0 |
| Overall | 1 136 | 1 133 | 99.7 |
| Disease-resistance level | Number | Correct evaluation | Accuracy (%) |
|---|---|---|---|
| R0 | 0 | 0 | ‒ |
| R1 | 3 | 3 | 100.0 |
| R2 | 2 | 2 | 100.0 |
| R3 | 12 | 11 | 91.7 |
| R4 | 11 | 11 | 100.0 |
| R5 | 10 | 10 | 100.0 |
| R6 | 26 | 26 | 100.0 |
| R7 | 23 | 23 | 100.0 |
| R8 | 8 | 8 | 100.0 |
| R9 | 5 | 5 | 100.0 |
| Overall | 100 | 99 | 99.0 |
Table 7. Disease-resistance identification accuracy for different disease resistance in practical testing.
| Disease-resistance level | Number | Correct evaluation | Accuracy (%) |
|---|---|---|---|
| R0 | 0 | 0 | ‒ |
| R1 | 3 | 3 | 100.0 |
| R2 | 2 | 2 | 100.0 |
| R3 | 12 | 11 | 91.7 |
| R4 | 11 | 11 | 100.0 |
| R5 | 10 | 10 | 100.0 |
| R6 | 26 | 26 | 100.0 |
| R7 | 23 | 23 | 100.0 |
| R8 | 8 | 8 | 100.0 |
| R9 | 5 | 5 | 100.0 |
| Overall | 100 | 99 | 99.0 |
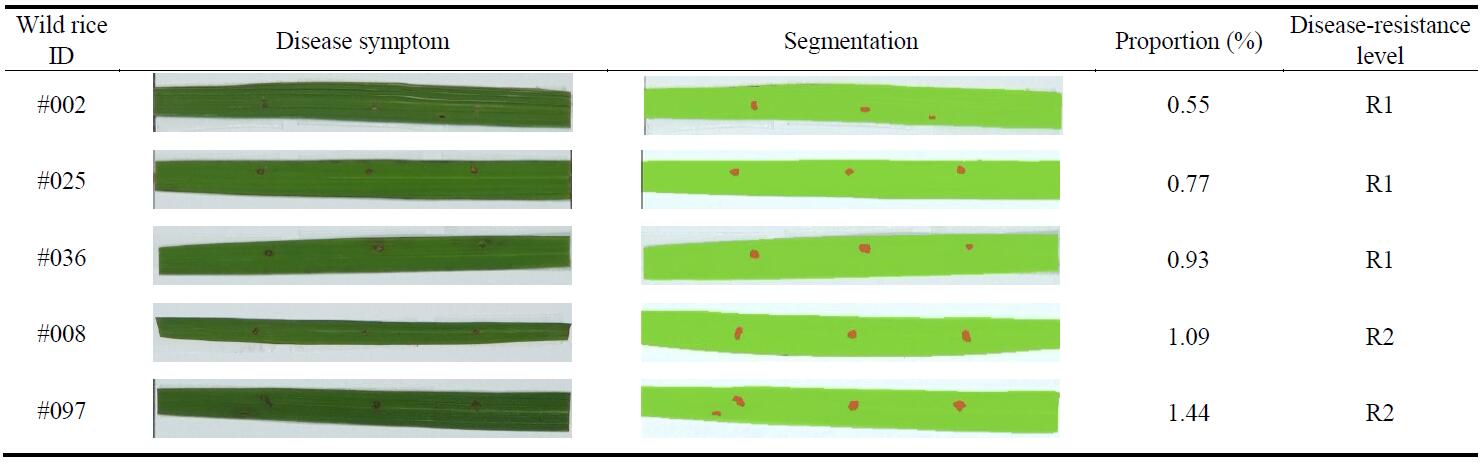 |
Table 8. Wild rice materials with strong disease resistance (R1 and R2) identified in practical testing.
| |
| Disease level | Number | Correct evaluating | Accuracy (%) |
|---|---|---|---|
| L0 | 1 | 1 | 100.0 |
| L1 | 8 | 7 | 87.5 |
| L2 | 11 | 11 | 100.0 |
| L3 | 14 | 14 | 100.0 |
| L4 | 10 | 10 | 100.0 |
| L5 | 11 | 11 | 100.0 |
| L6 | 13 | 13 | 100.0 |
| L7 | 14 | 13 | 92.9 |
| L8 | 15 | 13 | 86.7 |
| L9 | 3 | 3 | 100.0 |
| Total | 100 | 96 | 96.0 |
Table 9. Identification accuracy for different disease levels in generalization testing.
| Disease level | Number | Correct evaluating | Accuracy (%) |
|---|---|---|---|
| L0 | 1 | 1 | 100.0 |
| L1 | 8 | 7 | 87.5 |
| L2 | 11 | 11 | 100.0 |
| L3 | 14 | 14 | 100.0 |
| L4 | 10 | 10 | 100.0 |
| L5 | 11 | 11 | 100.0 |
| L6 | 13 | 13 | 100.0 |
| L7 | 14 | 13 | 92.9 |
| L8 | 15 | 13 | 86.7 |
| L9 | 3 | 3 | 100.0 |
| Total | 100 | 96 | 96.0 |
| [1] | Abràmoff M D, Magalhães P J, Ram S J. 2004. Image processing with ImageJ. In: Biophotonics International. Pittsfield, Massachusetts, USA: Laurin Publishing Co. Inc.: 36-42. |
| [2] | Cai X H, Lai Q X, Wang Y W, et al. 2024. Poly kernel inception network for remote sensing detection. arXiv e-prints: 2403.06258. https://arxiv.org/abs/2403.06258v2. |
| [3] | Campo S, Martín-Cardoso H, Olivé M, et al. 2020. Effect of root colonization by arbuscular mycorrhizal fungi on growth, productivity and blast resistance in rice. Rice, 13(1): 42. |
| [4] | Chen H, Sun K Y, Tian Z, et al. 2020. BlendMask: Top-down meets bottom-up for instance segmentation. arXiv e-prints: 2001.00309. https://arxiv.org/abs/2001.00309v3. |
| [5] | Chen J R, Kao S H, He H, et al. 2023. Run, don’t walk: Chasing higher FLOPS for faster neural networks. In: 2023 IEEE/CVF Conference on Computer Vision and Pattern Recognition (CVPR). June 17-24, 2023, Vancouver, BC, Canada: IEEE: 12021-12031. |
| [6] | Chen Y, Liu Z Q, Meng S, et al. 2023. OsCERK1 contributes to cupric oxide nanoparticles induced phytotoxicity and basal resistance against blast by regulating the anti-oxidant system in rice. J Fungi, 9(1): 36. |
| [7] | Chen Y F, Zhang C Y, Chen B, et al. 2024. Accurate leukocyte detection based on deformable-DETR and multi-level feature fusion for aiding diagnosis of blood diseases. Comput Biol Med, 170: 107917. |
| [8] | Chen Z X, He Z W, Lu Z M. 2024. DEA-net: Single image dehazing based on detail-enhanced convolution and content-guided attention. IEEE Trans Image Process, 33: 1002-1015. |
| [9] | Cheng T H, Wang X G, Chen S Y, et al. 2022. Sparse instance activation for real-time instance segmentation. arXiv e-prints: 2203.12827. https://arxiv.org/abs/2203.12827v1. |
| [10] | Culjak I, Abram D, Pribanic T, et al. 2012. A brief introduction to OpenCV. In: Proceedings of the 35th International Convention MIPRO. 21-25 May 2012, Opatija, Croatia: IEEE: 1725-1730. |
| [11] | Das A, Soubam D, Singh P K, et al. 2012. A novel blast resistance gene, Pi54rh cloned from wild species of rice, Oryza rhizomatis confers broad spectrum resistance to Magnaporthe oryzae. Funct Integr Genomics, 12(2): 215-228. |
| [12] | Devi S J S R, Singh K, Umakanth B, et al. 2015. Development and identification of novel rice blast resistant sources and their characterization using molecular markers. Rice Sci, 22(6): 300-308. |
| [13] | Fahad S, Adnan M, Noor M, et al. 2019. Major constraints for global rice production. In: Hasanuzzaman M, Fujita M, Nahar K, et al. Advances in Rice Research for Abiotic Stress Tolerance. Amsterdam, the Netherlands: Elsevier: 1-22. |
| [14] | Fernandez J, Lopez V, Kinch L, et al. 2021. Role of two metacaspases in development and pathogenicity of the rice blast fungus Magnaporthe oryzae. mBio, 12(1): e03471-20. |
| [15] | Han Q, Fan Z J, Dai Q, et al. 2021. On the connection between local attention and dynamic depth-wise convolution. arXiv e-prints: 2106.04263. https://arxiv.org/abs/2106.04263v5. |
| [16] | He J J, Li P Y, Geng Y F, et al. 2023. FastInst: A simple query-based model for real-time instance segmentation. arXiv e-prints: 2303. 08594. https://arxiv.org/abs/2303.08594v2. |
| [17] | He K M, Gkioxari G, Dollár P, et al. 2018. Mask R-CNN. IEEE Trans Pattern Anal Mach Intell, 42(2): 386-397. |
| [18] | Huang C L, Hwang S Y, Chiang Y C, et al. 2008. Molecular evolution of the Pi-ta gene resistant to rice blast in wild rice (Oryza rufipogon). Genetics, 179(3): 1527-1538. |
| [19] | Laha G S, Singh R, Ladhalakshmi D, et al. 2017. Importance and management of rice diseases: A global perspective. In: Chauhan B S, Jabran K, Mahajan Gulshan. Rice Production Worldwide. Cham: Springer International Publishing: 303-360. |
| [20] | Lamba S, Kukreja V, Baliyan A, et al. 2023. A novel hybrid severity prediction model for blast paddy disease using machine learning. Sustainability, 15(2): 1502. |
| [21] | Lee J, Park S, Mo S, et al. 2020. Layer-adaptive sparsity for the magnitude-based pruning. arXiv e-prints: 2010.07611. https://arxiv.org/abs/2010.07611v2. |
| [22] | Li W, Zhang M C, Yang Y L, et al. 2024. Molecular evolution of rice blast resistance gene bsr-d1. Rice Sci, 31(6): 700-711. |
| [23] | Li W T, Chern M, Yin J J, et al. 2019. Recent advances in broad-spectrum resistance to the rice blast disease. Curr Opin Plant Biol, 50: 114-120. |
| [24] | Liang Y, Yi Z F, Zhuang W, et al. 2025. Optimizing hybrid with improved resistance to rice blast and superior ratooning ability. Rice Sci, 32(3): 292-297. |
| [25] | Lin S D, Yao Y, Li J Y, et al. 2023. Application of UAV-based imaging and deep learning in assessment of rice blast resistance. Rice Sci, 30(6): 652-660. |
| [26] | Liu W D, Wang G L. 2016. Plant innate immunity in rice: A defense against pathogen infection. Natl Sci Rev, 3(3): 295-308. |
| [27] | Liu Y B, Lei B, Hu L, et al. 2020. The grading determination of rice blast: HSV color space method based on machine vision. J Agric, 10(10): 83-90. (in Chinese with English abstract) |
| [28] | Liu Y L, Feng N J, Zhong F T. 2022. First report of Pyricularia oryzae causing blast in wild rice (Oryza rufipogon) in China. Plant Dis, 106(11): 2997. |
| [29] | Meng F, He Y G, Chen J, et al. 2021. Analysis of natural variation of the rice blast resistance gene Pike and identification of a novel allele Pikg. Mol Genet Genomics, 296(4): 939-952. |
| [30] | Ministry of Agriculture of the People’s Republic of China. 2014. Technical specification for identification and evaluation of blast resistance in rice variety regional test: NY-T 2646-2014. Beijing, China: China Standards Press. [2025-02-25]. (in Chinese) |
| [31] | Pan P, Zhang J H, Zheng X M, et al. 2023a. Research progress of deep learning in intelligent identification of disease resistance of crops and their related species. Acta Agric Zhejiang, 35(8): 1993-2012. (in Chinese with English abstract) |
| [32] | Pan P, Guo W, Zheng X, et al. 2023b. Xoo-YOLO: A detection method for wild rice bacterial blight in the field from the perspective of unmanned aerial vehicles. Front Plant Sci, 14: 1256545. |
| [33] | Pan P, Yao Q, Shen J, et al. 2024a. CVW-etr: A high-precision method for estimating the severity level of cotton verticillium wilt disease. Plants-Basel, 13(21): 2960. |
| [34] | Pan P, Shao M, He P, et al. 2024b. Lightweight cotton diseases real-time detection model for resource-constrained devices in natural environments. Front Plant Sci, 15: 1383863. |
| [35] | Patil R R, Kumar S, Chiwhane S, et al. 2023. An artificial-intelligence-based novel rice grade model for severity estimation of rice diseases. Agriculture, 13(1): 47. |
| [36] | Qu S H, Liu G F, Zhou B, et al. 2006. The broad-spectrum blast resistance gene Pi9 encodes a nucleotide-binding site-leucine-rich repeat protein and is a member of a multigene family in rice. Genetics, 172(3): 1901-1914. |
| [37] | Ritharson P I, Raimond K, Mary X A, et al. 2024. DeepRice: A deep learning and deep feature based classification of rice leaf disease subtypes. Artif Intell Agric, 11: 34-49. |
| [38] | Russell B C, Torralba A, Murphy K P, et al. 2008. LabelMe: A database and web-based tool for image annotation. Int J Comput Vis, 77(1): 157-173. |
| [39] | Shen Q, Li Y, Zhang Y X, et al. 2025. CSW-YOLO: A traffic sign small target detection algorithm based on YOLOv8. PLoS One, 20(3): e0315334. |
| [40] | Sheng C, Yu D, Li X, et al. 2022. OsAPX1 positively contributes to rice blast resistance. Front Plant Sci, 13: 843271. |
| [41] | Shi D. 2023. TransNeXt: Robust foveal visual perception for vision transformers. arXiv e-prints: 2311.17132. https://arxiv.org/abs/2311.17132v3. |
| [42] | Tang Y H, Han K, Guo J Y, et al. 2022. GhostNetV2: Enhance cheap operation with long-range attention. arXiv e-prints: 2211.12905. https://arxiv.org/abs/2211.12905v1. |
| [43] | Terensan S, Salgadoe A S A, Kottearachchi N S, et al. 2024. Proximally sensed RGB images and colour indices for distinguishing rice blast and brown spot diseases by k-means clustering: Towards a mobile application solution. Smart Agric Technol, 9: 100532. |
| [44] | Tian Z, Shen C H, Chen H, et al. 2020. Conditional convolutions for instance segmentation. arXiv e-prints: 2003.05664. https://arxiv.org/abs/2003.05664v4. |
| [45] | Wing R A, Purugganan M D, Zhang Q F. 2018. The rice genome revolution: From an ancient grain to Green Super Rice. Nat Rev Genet, 19(8): 505-517. |
| [46] | Yang Z Y, Xu Z J, Yang Q W, et al. 2022. Conservation and utilization of genetic resources of wild rice in China. Rice Sci, 29(3): 216-224. |
| [47] | Zheng X M, Peng Y L, Qiao J Y, et al. 2024. Wild rice: Unlocking the future of rice breeding. Plant Biotechnol J, 22(11): 3218-3226. |
| [48] | Zhu X M, Li L, Wang J Y, et al. 2021. Vacuolar protein-sorting receptor MoVps13 regulates conidiation and pathogenicity in rice blast fungus Magnaporthe oryzae. J Fungi, 7(12): 1084. |
| No related articles found! |
| 阅读次数 | ||||||
|
全文 |
|
|||||
|
摘要 |
|
|||||