Rice Science
  • 首页
  • 期刊介绍
  • 编委会
  • 学术伦理
  • 投稿指南
  • 期刊订阅
  • 联系我们
  • English

Rice Science ›› 2026, Vol. 33 ›› Issue (4): 431-434.DOI: 10.1016/j.rsci.2026.03.006

• • 上一篇    下一篇

  • 收稿日期:2025-11-11 接受日期:2026-03-10 出版日期:2026-07-28 发布日期:2026-08-06

RichHTML

PDF

补充材料

1

可视化

0
  • 1. Supplemental data.pdf(1382KB)

摘要/Abstract

引用本文

. [J]. Rice Science, 2026, 33(4): 431-434.

使用本文

推荐

导出引用管理器 EndNote|Ris|BibTeX

链接本文: http://www.ricesci.org/CN/10.1016/j.rsci.2026.03.006

               http://www.ricesci.org/CN/Y2026/V33/I4/431

图/表 1

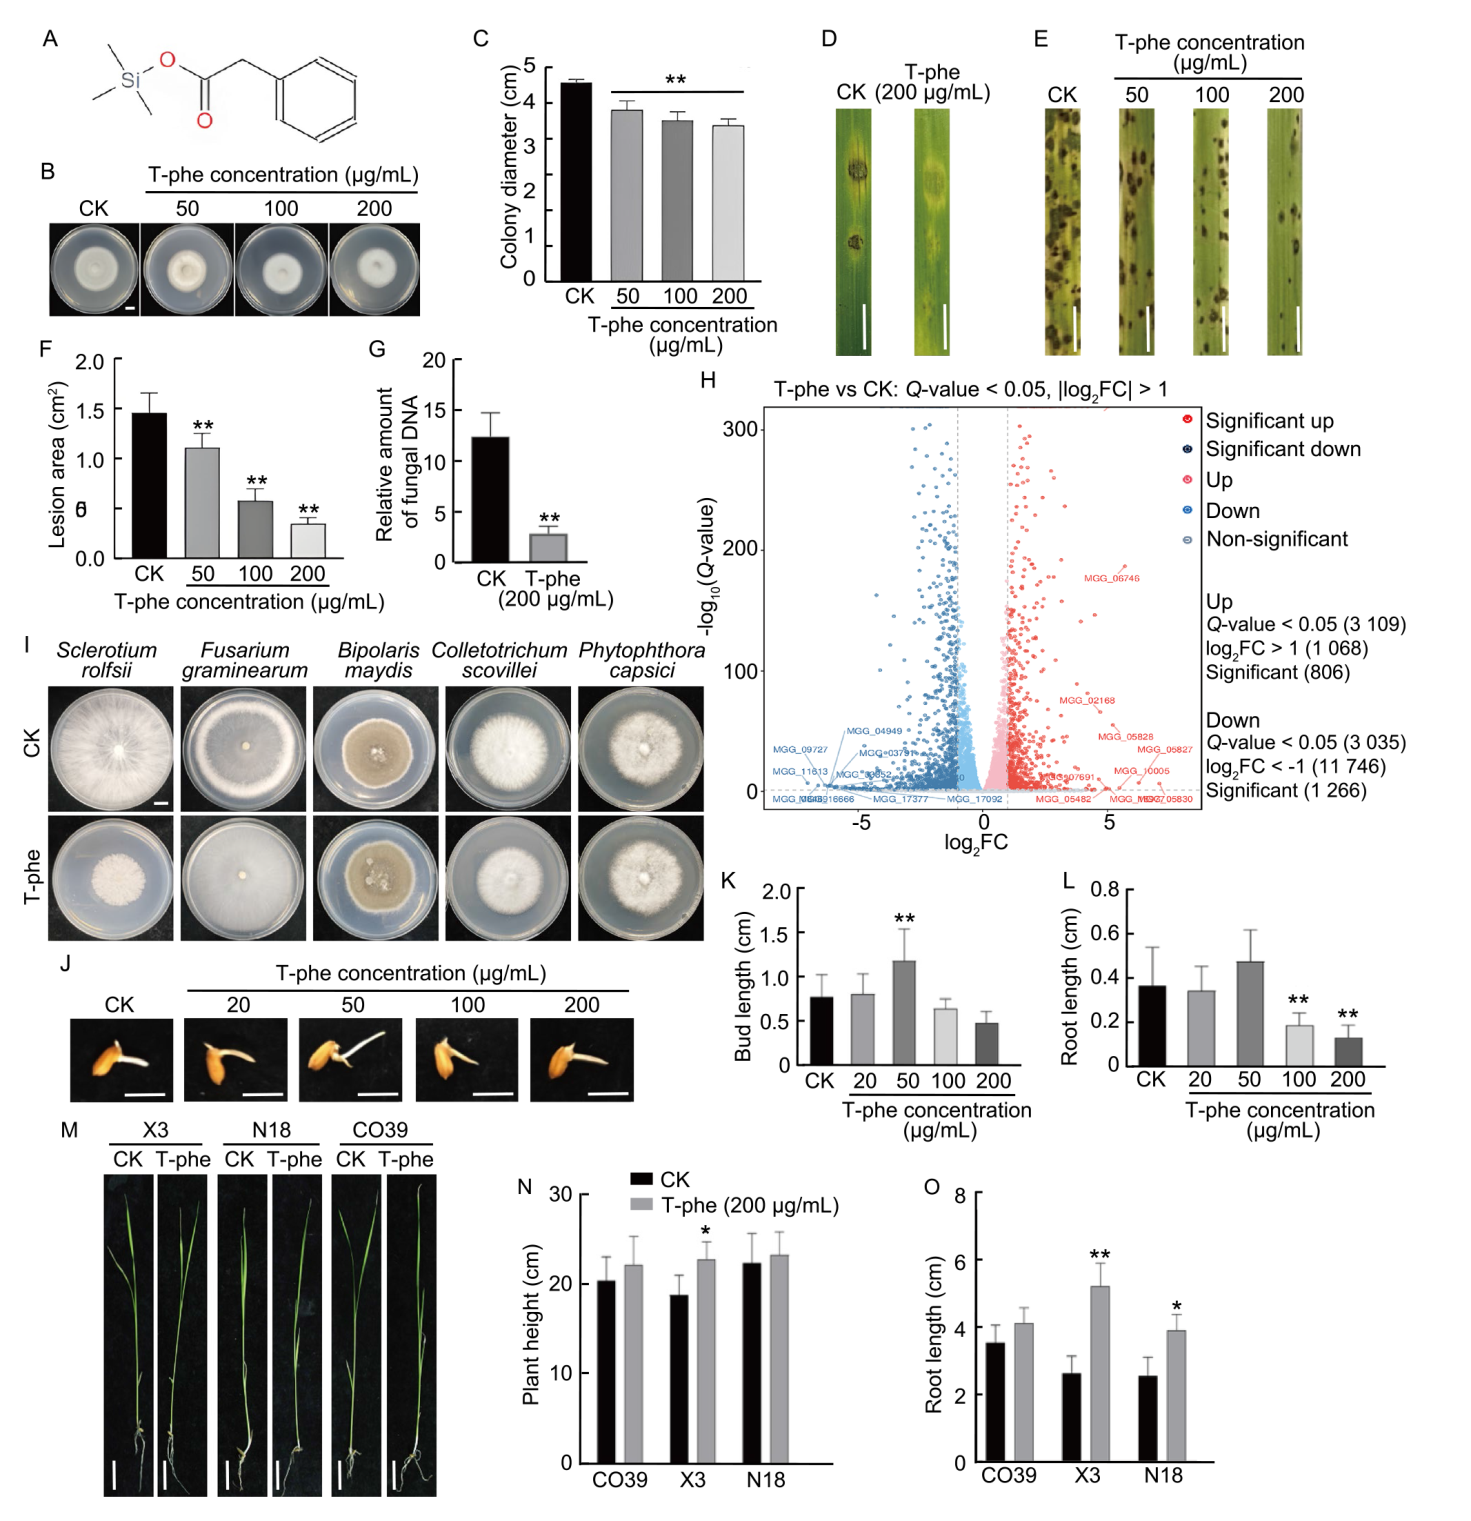
Fig. 1. Trimethylsilyl phenylacetate (T-phe) effectively antagonizes pathogenicity of Magnaporthe oryzae and promotes rice growth. A, Chemical structure of T-phe. B and C, Colony morphology (B) and colony diameter statistical analysis (C) of M. oryzae under different concentrations of T-phe. CK, Control group. Scale bar, 1 cm. D and E, Pathogenicity of different concentrations of T-phe on barley (D) and rice (E) by pot spray after conidia treatment. Scale bars, 1 cm. F, Rice leaf lesion areaquantified using ImageJ. G, Fungal biomass in CK and T-phe treated-infected rice leaves was quantified using DNA-based qPCR. The infected rice leaves were harvested at 4 d post-inoculation. H, Differential expression volcano plot between T-phe treatment group and CK group. The horizontal coordinate (log2FC) reflects the magnitude and direction of expression changes, while the vertical coordinate [-log10(Q-value)] indicates the statistical significance of differential expression. FC, Fold change. I, Comparison of colony growth of Sclerotium rolfsii, Fusarium graminearum, Bipolaris maydis, Colletotrichum scovillei, and Phytophthora capsici between the CK and T-phe treatment group. Scale bar, 1 cm. J−L, Phenotypes of germinating seeds (J), bud length (K), and root length (L) of rice seeds treated with T-phe. Scale bars, 1 cm. M−O, Plant height and root length of different rice variety seedlings treated with 200 μg/mL of T-phe after 14 d of transplantation. Scale bars, 1 cm. X3, Xizi 3; N18, Nongxiang 18. Data are presented as mean ± SD (n = 3). The comparison between the T-phe group and CK group was conducted using the independent sample t-test in G; the comparisons between multiple T-phe groups and CK groupwere performed using one-way analysis of variance (ANOVA), followed by Duncan’s multiple comparison test in C, F, K, L, N, O. *, P < 0.05; **, P < 0.01.

Fig. 1. Trimethylsilyl phenylacetate (T-phe) effectively antagonizes pathogenicity of Magnaporthe oryzae and promotes rice growth. A, Chemical structure of T-phe. B and C, Colony morphology (B) and colony diameter statistical analysis (C) of M. oryzae under different concentrations of T-phe. CK, Control group. Scale bar, 1 cm. D and E, Pathogenicity of different concentrations of T-phe on barley (D) and rice (E) by pot spray after conidia treatment. Scale bars, 1 cm. F, Rice leaf lesion areaquantified using ImageJ. G, Fungal biomass in CK and T-phe treated-infected rice leaves was quantified using DNA-based qPCR. The infected rice leaves were harvested at 4 d post-inoculation. H, Differential expression volcano plot between T-phe treatment group and CK group. The horizontal coordinate (log2FC) reflects the magnitude and direction of expression changes, while the vertical coordinate [-log10(Q-value)] indicates the statistical significance of differential expression. FC, Fold change. I, Comparison of colony growth of Sclerotium rolfsii, Fusarium graminearum, Bipolaris maydis, Colletotrichum scovillei, and Phytophthora capsici between the CK and T-phe treatment group. Scale bar, 1 cm. J−L, Phenotypes of germinating seeds (J), bud length (K), and root length (L) of rice seeds treated with T-phe. Scale bars, 1 cm. M−O, Plant height and root length of different rice variety seedlings treated with 200 μg/mL of T-phe after 14 d of transplantation. Scale bars, 1 cm. X3, Xizi 3; N18, Nongxiang 18. Data are presented as mean ± SD (n = 3). The comparison between the T-phe group and CK group was conducted using the independent sample t-test in G; the comparisons between multiple T-phe groups and CK groupwere performed using one-way analysis of variance (ANOVA), followed by Duncan’s multiple comparison test in C, F, K, L, N, O. *, P < 0.05; **, P < 0.01.

参考文献 12

[1] Cai M, Miao J Q, Chen F P, et al. 2021. Survival cost and diverse molecular mechanisms of Magnaporthe oryzae isolate resistance to epoxiconazole. Plant Dis, 105(2): 473-480.
[2] Garbe E, Vylkova S. 2019. Role of amino acid metabolism in the virulence of human pathogenic fungi. Curr Clin Microbiol Rep, 6(3): 108-119.
[3] Hayashi M, Endo Y, Komura T, et al. 2020. Synthesis and biological activity of a novel fungicide, flutianil. J Pestic Sci, 45(2): 105-108.
[4] Hsieh C H, Chung W C, Chen Y N, et al. 2013. Phylogenetic diversity and sensitivity to MBI and QoI fungicides of Magnaporthe oryzae in Taiwan. J Pestic Sci, 38(4): 194-199.
[5] Kouvela A, Zaravinos A, Stamatopoulou V. 2021. Adaptor molecules epitranscriptome reprograms bacterial pathogenicity. Int J Mol Sci, 22(16): 8409.
[6] Ling L J, Yue R, Wang Y Y, et al. 2025. Volatile organic compounds from Stenotrophomonas geniculata J-0 as potential biofumigants manage bulb rot caused by Fusarium oxysporum in postharvest Lanzhou lily. World J Microbiol Biotechnol, 41(1): 9.
[7] Liu L S, Xie Y C, Zhu B X, et al. 2024. Rice leaf chlorophyll content estimation with different crop coverages based on Sentinel-2. Ecol Inform, 81: 102622.
[8] Moin A T, Robin T B, Patil R B, et al. 2024. Antifungal plant flavonoids identified in silico with potential to control rice blast disease caused by Magnaporthe oryzae. PLoS One, 19(4): e0301519.
[9] Qin Y F, Wu X Y, Li C G, et al. 2024. Analysis of the antagonistic effect of Stenotrophomonas geniculata WXY 53 on Magnaporthe oryzae through bioassays and Whole-Genome sequencing. Biol Control, 196: 105587.
[10] Shao X, Li Z, Qian X. 2021. Research and development of green pesticides in China. In: Maienfisch P, Mangelinckx S. Recent Highlights in the Discovery and Optimization of Crop Protection Products. New York, USA: Academic Press: 39-64.
[11] Todd R B, Wong K H, Goldman G H. 2022. Editorial: Transcription factors and regulation of transcriptional programs in fungi. Front Fungal Biol, 3: 1117910.
[12] Zhang J, Li H M, Gu W L, et al. 2023. Peroxisome dynamics determines host-derived ROS accumulation and infectious growth of the rice blast fungus. mBio, 14(6): e02381-23.

相关文章 0

No related articles found!

编辑推荐

Metrics

阅读次数
全文


摘要

  • 摘要
  • 图/表
  • 参考文献
  • 相关文章
  • 编辑推荐
  • Metrics
回顶部
浙ICP备05004719号-15   公安备案号:33010302003355
版权所有 © 《Rice Science》编辑部
地址:浙江省杭州市体育场路359号 邮编:310006 电话:0571-63371017 E-mail:crrn@fy.hz.zn.cn; cjrs278@gmail.com
本系统由北京玛格泰克科技发展有限公司设计开发
总访问量: 今日访问: 在线人数: