Rice Science ›› 2017, Vol. 24 ›› Issue (1): 32-40.DOI: 10.1016/j.rsci.2016.05.006
收稿日期:2016-02-24
接受日期:2016-05-05
出版日期:2017-01-10
发布日期:2016-11-01
. [J]. Rice Science, 2017, 24(1): 32-40.
| QTL | Marker | Plant number |
|---|---|---|
| qHTSF1.1 | RM431 | IWP-201, IWP-143, IWP-245, IWP-215, IWP-275 |
| qHTSF4.1 | RM5757 | IWP-129, IWP-101, IWP-105, IWP-116, IWP-240 |
| qHTSF1.1 and qHTSF4.1 | RM431, RM5757 | IWP-295, IWP-277, IWP-246, IWP-296, IWP-166, IWP-158, IWP-265, IWP-153, IWP-139, IWP-233 |
| Absence of qHTSF1.1 and qHTSF4.1 | RM431, RM5757 | IWP-147, IWP-142, IWP-141, IWP-146, IWP-104 |
Table 1 Segregating progenies selected with different combinations of QTLs related to high-temperature stress in rice.
| QTL | Marker | Plant number |
|---|---|---|
| qHTSF1.1 | RM431 | IWP-201, IWP-143, IWP-245, IWP-215, IWP-275 |
| qHTSF4.1 | RM5757 | IWP-129, IWP-101, IWP-105, IWP-116, IWP-240 |
| qHTSF1.1 and qHTSF4.1 | RM431, RM5757 | IWP-295, IWP-277, IWP-246, IWP-296, IWP-166, IWP-158, IWP-265, IWP-153, IWP-139, IWP-233 |
| Absence of qHTSF1.1 and qHTSF4.1 | RM431, RM5757 | IWP-147, IWP-142, IWP-141, IWP-146, IWP-104 |
| Date | Ambient chamber | Elevated chamber | Date | Ambient chamber | Elevated chamber | ||||||
|---|---|---|---|---|---|---|---|---|---|---|---|
| Tmax (ºC) | RH (%) | Tmax (ºC) | RH (%) | Tmax (ºC) | RH (%) | Tmax (ºC) | RH (%) | ||||
| 2015-03-01 | 34.0 | 86.3 | 36.2 | 84.1 | 2015-03-19 | 35.8 | 78.7 | 37.1 | 77.8 | ||
| 2015-03-02 | 34.2 | 85.6 | 36.2 | 83.7 | 2015-03-20 | 35.6 | 80.3 | 37.7 | 78.4 | ||
| 2015-03-03 | 34.0 | 85.9 | 36.1 | 83.0 | 2015-03-21 | 35.2 | 82.8 | 37.2 | 81.5 | ||
| 2015-03-04 | 33.0 | 90.3 | 35.2 | 88.1 | 2015-03-22 | 35.5 | 69.1 | 37.3 | 67.6 | ||
| 2015-03-05 | 34.4 | 85.1 | 36.7 | 84.2 | 2015-03-23 | 36.5 | 81.5 | 38.2 | 79.7 | ||
| 2015-03-06 | 34.0 | 83.2 | 36.5 | 82.5 | 2015-03-24 | 37.0 | 86.2 | 39.9 | 85.2 | ||
| 2015-03-07 | 34.0 | 89.6 | 36.1 | 88.7 | 2015-03-25 | 37.0 | 82.4 | 39.4 | 80.4 | ||
| 2015-03-08 | 33.7 | 83.7 | 35.8 | 81.0 | 2015-03-26 | 36.2 | 74.5 | 38.1 | 72.0 | ||
| 2015-03-09 | 33.2 | 80.0 | 35.4 | 78.5 | 2015-03-27 | 34.5 | 87.6 | 36.3 | 85.4 | ||
| 2015-03-10 | 33.0 | 81.4 | 36.5 | 80.4 | 2015-03-28 | 35.0 | 85.8 | 37.2 | 83.1 | ||
| 2015-03-11 | 33.8 | 79.4 | 36.0 | 77.2 | 2015-03-29 | 34.8 | 84.9 | 36.1 | 82.9 | ||
| 2015-03-12 | 33.2 | 83.5 | 35.7 | 81.9 | 2015-03-30 | 36.0 | 84.1 | 38.9 | 82.7 | ||
| 2015-03-13 | 32.5 | 79.1 | 35.3 | 77.8 | 2015-03-31 | 35.4 | 78.0 | 35.6 | 76.5 | ||
| 2015-03-14 | 33.6 | 78.9 | 35.2 | 77.5 | 2015-04-01 | 36.2 | 80.4 | 38.1 | 78.1 | ||
| 2015-03-15 | 33.5 | 82.8 | 35.5 | 80.1 | 2015-04-02 | 37.4 | 76.2 | 39.5 | 74.2 | ||
| 2015-03-16 | 31.7 | 85.6 | 33.6 | 84.6 | 2015-04-03 | 38.7 | 86.1 | 40.0 | 85.5 | ||
| 2015-03-17 | 33.4 | 83.5 | 36.2 | 81.7 | 2015-04-04 | 38.4 | 87.5 | 40.2 | 85.4 | ||
| 2015-03-18 | 34.8 | 77.4 | 36.0 | 75.6 | 2015-04-05 | 39.8 | 81.7 | 41.2 | 80.6 | ||
Table 2 Maximum temperature (Tmax) and related humidity (RH) in ambient and elevated chambers from 1 March to 5 April in 2015.
| Date | Ambient chamber | Elevated chamber | Date | Ambient chamber | Elevated chamber | ||||||
|---|---|---|---|---|---|---|---|---|---|---|---|
| Tmax (ºC) | RH (%) | Tmax (ºC) | RH (%) | Tmax (ºC) | RH (%) | Tmax (ºC) | RH (%) | ||||
| 2015-03-01 | 34.0 | 86.3 | 36.2 | 84.1 | 2015-03-19 | 35.8 | 78.7 | 37.1 | 77.8 | ||
| 2015-03-02 | 34.2 | 85.6 | 36.2 | 83.7 | 2015-03-20 | 35.6 | 80.3 | 37.7 | 78.4 | ||
| 2015-03-03 | 34.0 | 85.9 | 36.1 | 83.0 | 2015-03-21 | 35.2 | 82.8 | 37.2 | 81.5 | ||
| 2015-03-04 | 33.0 | 90.3 | 35.2 | 88.1 | 2015-03-22 | 35.5 | 69.1 | 37.3 | 67.6 | ||
| 2015-03-05 | 34.4 | 85.1 | 36.7 | 84.2 | 2015-03-23 | 36.5 | 81.5 | 38.2 | 79.7 | ||
| 2015-03-06 | 34.0 | 83.2 | 36.5 | 82.5 | 2015-03-24 | 37.0 | 86.2 | 39.9 | 85.2 | ||
| 2015-03-07 | 34.0 | 89.6 | 36.1 | 88.7 | 2015-03-25 | 37.0 | 82.4 | 39.4 | 80.4 | ||
| 2015-03-08 | 33.7 | 83.7 | 35.8 | 81.0 | 2015-03-26 | 36.2 | 74.5 | 38.1 | 72.0 | ||
| 2015-03-09 | 33.2 | 80.0 | 35.4 | 78.5 | 2015-03-27 | 34.5 | 87.6 | 36.3 | 85.4 | ||
| 2015-03-10 | 33.0 | 81.4 | 36.5 | 80.4 | 2015-03-28 | 35.0 | 85.8 | 37.2 | 83.1 | ||
| 2015-03-11 | 33.8 | 79.4 | 36.0 | 77.2 | 2015-03-29 | 34.8 | 84.9 | 36.1 | 82.9 | ||
| 2015-03-12 | 33.2 | 83.5 | 35.7 | 81.9 | 2015-03-30 | 36.0 | 84.1 | 38.9 | 82.7 | ||
| 2015-03-13 | 32.5 | 79.1 | 35.3 | 77.8 | 2015-03-31 | 35.4 | 78.0 | 35.6 | 76.5 | ||
| 2015-03-14 | 33.6 | 78.9 | 35.2 | 77.5 | 2015-04-01 | 36.2 | 80.4 | 38.1 | 78.1 | ||
| 2015-03-15 | 33.5 | 82.8 | 35.5 | 80.1 | 2015-04-02 | 37.4 | 76.2 | 39.5 | 74.2 | ||
| 2015-03-16 | 31.7 | 85.6 | 33.6 | 84.6 | 2015-04-03 | 38.7 | 86.1 | 40.0 | 85.5 | ||
| 2015-03-17 | 33.4 | 83.5 | 36.2 | 81.7 | 2015-04-04 | 38.4 | 87.5 | 40.2 | 85.4 | ||
| 2015-03-18 | 34.8 | 77.4 | 36.0 | 75.6 | 2015-04-05 | 39.8 | 81.7 | 41.2 | 80.6 | ||
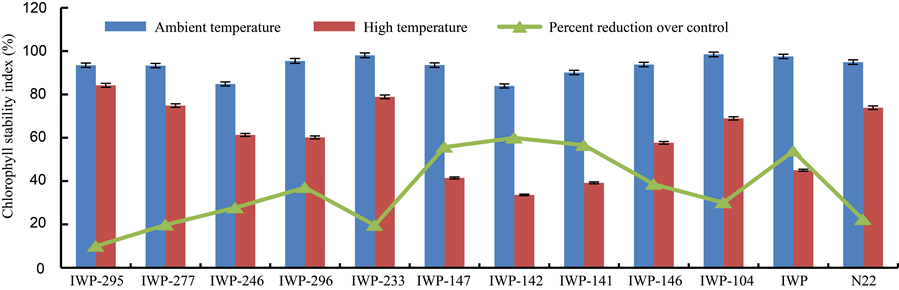
Fig. 1. Changes in chlorophyll stability index in parents (IWP and N22), progenies with target QTLs (IWP-295, IWP-277, IWP-246, IWP-296 and IWP-233) and progenies without target QTLs (IWP-147, IWP-142, IWP-141, IWP-146 and IWP-104).Bars represent the standard errors of the mean values (n = 5).
| Progeny of IWP × N22 | MDA content (µmol/g) | Percent increase over control (%) | |
|---|---|---|---|
| Ambient temperature | High temperature | ||
| Progeny only with allele of RM431 | |||
| IWP-201 | 0.359 ± 0.004 | 0.690 ± 0.007 | 92.20 |
| IWP-143 | 0.311 ± 0.003 | 0.500 ± 0.005 | 60.77 |
| IWP-245 | 0.401 ± 0.004 | 0.608 ± 0.007 | 51.62 |
| IWP-215 | 0.305 ± 0.004 | 0.502 ± 0.006 | 64.59 |
| IWP-275 | 0.388 ± 0.004 | 0.676 ± 0.007 | 74.23 |
| Progeny only with allele of RM5757 | |||
| IWP-129 | 0.349 ± 0.004 | 0.655 ± 0.007 | 87.68 |
| IWP-107 | 0.374 ± 0.004 | 0.599 ± 0.006 | 60.16 |
| IWP-105 | 0.239 ± 0.003 | 0.550 ± 0.006 | 130.13 |
| IWP-116 | 0.244 ± 0.003 | 0.642 ± 0.008 | 163.11 |
| IWP-240 | 0.254 ± 0.003 | 0.542 ± 0.006 | 113.39 |
| Progeny with both alleles of RM431 and RM5757 | |||
| IWP-295 | 0.418 ± 0.005 | 0.572 ± 0.006 | 36.84 |
| IWP-277 | 0.308 ± 0.003 | 0.456 ± 0.005 | 48.05 |
| IWP-246 | 0.319 ± 0.004 | 0.412 ± 0.005 | 29.15 |
| IWP-296 | 0.335 ± 0.004 | 0.509 ± 0.006 | 51.94 |
| IWP-166 | 0.216 ± 0.002 | 0.447 ± 0.005 | 106.94 |
| IWP-158 | 0.352 ± 0.004 | 0.578 ± 0.006 | 64.20 |
| IWP-265 | 0.245 ± 0.003 | 0.472 ± 0.005 | 92.65 |
| IWP-153 | 0.294 ± 0.003 | 0.604 ± 0.007 | 105.44 |
| IWP-139 | 0.350 ± 0.004 | 0.667 ± 0.007 | 90.57 |
| IWP-233 | 0.300 ± 0.003 | 0.502 ± 0.005 | 67.33 |
| Progeny without alleles of RM431 and RM5757 | |||
| IWP-147 | 0.350 ± 0.004 | 0.843 ± 0.009 | 140.86 |
| IWP-142 | 0.365 ± 0.004 | 0.898 ± 0.010 | 146.03 |
| IWP-141 | 0.498 ± 0.006 | 0.943 ± 0.010 | 89.36 |
| IWP-146 | 0.314 ± 0.004 | 0.874 ± 0.010 | 178.34 |
| IWP-104 | 0.341 ± 0.004 | 0.988 ± 0.011 | 189.74 |
| Parent | |||
| IWP | 0.326 ± 0.004 | 0.675 ± 0.007 | 107.06 |
| N22 | 0.309 ± 0.003 | 0.423 ± 0.005 | 36.89 |
| SE = 0.0082; CD = 0.0163 (P < 0.05). | |||
Table 3 Malondialdehyde (MDA) content (Mean ± SE, n = 5) in progenies of IWP × N22 exposed to high-temperature stress.
| Progeny of IWP × N22 | MDA content (µmol/g) | Percent increase over control (%) | |
|---|---|---|---|
| Ambient temperature | High temperature | ||
| Progeny only with allele of RM431 | |||
| IWP-201 | 0.359 ± 0.004 | 0.690 ± 0.007 | 92.20 |
| IWP-143 | 0.311 ± 0.003 | 0.500 ± 0.005 | 60.77 |
| IWP-245 | 0.401 ± 0.004 | 0.608 ± 0.007 | 51.62 |
| IWP-215 | 0.305 ± 0.004 | 0.502 ± 0.006 | 64.59 |
| IWP-275 | 0.388 ± 0.004 | 0.676 ± 0.007 | 74.23 |
| Progeny only with allele of RM5757 | |||
| IWP-129 | 0.349 ± 0.004 | 0.655 ± 0.007 | 87.68 |
| IWP-107 | 0.374 ± 0.004 | 0.599 ± 0.006 | 60.16 |
| IWP-105 | 0.239 ± 0.003 | 0.550 ± 0.006 | 130.13 |
| IWP-116 | 0.244 ± 0.003 | 0.642 ± 0.008 | 163.11 |
| IWP-240 | 0.254 ± 0.003 | 0.542 ± 0.006 | 113.39 |
| Progeny with both alleles of RM431 and RM5757 | |||
| IWP-295 | 0.418 ± 0.005 | 0.572 ± 0.006 | 36.84 |
| IWP-277 | 0.308 ± 0.003 | 0.456 ± 0.005 | 48.05 |
| IWP-246 | 0.319 ± 0.004 | 0.412 ± 0.005 | 29.15 |
| IWP-296 | 0.335 ± 0.004 | 0.509 ± 0.006 | 51.94 |
| IWP-166 | 0.216 ± 0.002 | 0.447 ± 0.005 | 106.94 |
| IWP-158 | 0.352 ± 0.004 | 0.578 ± 0.006 | 64.20 |
| IWP-265 | 0.245 ± 0.003 | 0.472 ± 0.005 | 92.65 |
| IWP-153 | 0.294 ± 0.003 | 0.604 ± 0.007 | 105.44 |
| IWP-139 | 0.350 ± 0.004 | 0.667 ± 0.007 | 90.57 |
| IWP-233 | 0.300 ± 0.003 | 0.502 ± 0.005 | 67.33 |
| Progeny without alleles of RM431 and RM5757 | |||
| IWP-147 | 0.350 ± 0.004 | 0.843 ± 0.009 | 140.86 |
| IWP-142 | 0.365 ± 0.004 | 0.898 ± 0.010 | 146.03 |
| IWP-141 | 0.498 ± 0.006 | 0.943 ± 0.010 | 89.36 |
| IWP-146 | 0.314 ± 0.004 | 0.874 ± 0.010 | 178.34 |
| IWP-104 | 0.341 ± 0.004 | 0.988 ± 0.011 | 189.74 |
| Parent | |||
| IWP | 0.326 ± 0.004 | 0.675 ± 0.007 | 107.06 |
| N22 | 0.309 ± 0.003 | 0.423 ± 0.005 | 36.89 |
| SE = 0.0082; CD = 0.0163 (P < 0.05). | |||
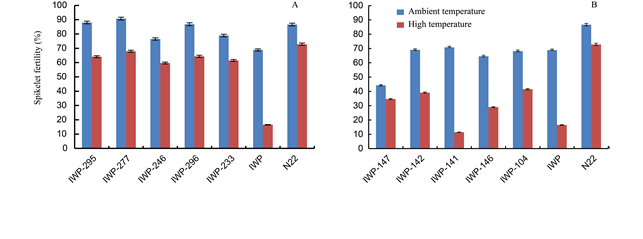
Fig. 2. Spikelet fertility in parents (IWP and N22), progenies with target QTLs (IWP-295, IWP-277, IWP-246, IWP-296 and IWP-233) (A) and progenies without target QTLs (IWP-147, IWP-142, IWP-141, IWP-146 and IWP-104) (B).Bars represent the standard errors of the mean values (n = 5).
| Progeny of IWP × N22 | Grain yield/plant | TDM | |||||||
|---|---|---|---|---|---|---|---|---|---|
| Ambient temperature | High temperature | Ambient temperature | High temperature | ||||||
| Progeny only with allele of RM431 | |||||||||
| IWP-201 | 39.18 | 35.97 | 125.8 | 118.7 | |||||
| IWP-143 | 36.52 | 33.81 | 117.7 | 109.7 | |||||
| IWP-245 | 32.71 | 29.26 | 109.8 | 97.7 | |||||
| IWP-215 | 33.68 | 30.92 | 112.7 | 105.7 | |||||
| IWP-275 | 37.79 | 33.26 | 123.9 | 107.7 | |||||
| Progeny only with allele of RM5757 | |||||||||
| IWP-129 | 38.51 | 34.49 | 125.8 | 115.7 | |||||
| IWP-107 | 31.89 | 28.37 | 105.7 | 95.6 | |||||
| IWP-105 | 34.05 | 30.70 | 114.8 | 101.7 | |||||
| IWP-116 | 31.64 | 27.53 | 104.6 | 98.6 | |||||
| IWP-240 | 36.97 | 33.64 | 120.8 | 108.8 | |||||
| Progeny with both alleles of RM431 and RM5757 | |||||||||
| IWP-295 | 38.68 | 36.21 | 128.8 | 121.8 | |||||
| IWP-277 | 40.42 | 38.86 | 152.9 | 148.9 | |||||
| IWP-246 | 39.57 | 36.95 | 139.0 | 133.9 | |||||
| IWP-296 | 37.94 | 35.41 | 129.8 | 123.8 | |||||
| IWP-166 | 32.68 | 29.73 | 108.8 | 98.7 | |||||
| IWP-158 | 35.67 | 32.86 | 116.8 | 107.7 | |||||
| IWP-265 | 31.03 | 28.98 | 102.7 | 97.7 | |||||
| IWP-153 | 33.08 | 30.19 | 110.8 | 101.7 | |||||
| IWP-139 | 37.45 | 34.44 | 126.9 | 119.8 | |||||
| IWP-233 | 36.75 | 33.14 | 122.8 | 118.7 | |||||
| Progeny without alleles of RM431 and RM5757 | |||||||||
| IWP-147 | 36.74 | 30.14 | 118.7 | 101.6 | |||||
| IWP-142 | 32.25 | 26.49 | 107.7 | 92.6 | |||||
| IWP-141 | 30.44 | 25.21 | 101.7 | 89.6 | |||||
| IWP-146 | 34.90 | 28.97 | 114.7 | 97.6 | |||||
| IWP-104 | 33.17 | 28.63 | 110.8 | 95.7 | |||||
| Parent | |||||||||
| IWP | 38.41 | 32.87 | 124.8 | 107.7 | |||||
| N22 | 32.55 | 30.29 | 108.7 | 101.6 | |||||
| SE = 1.768; CD = 3.504 (P < 0.05). | |||||||||
Table 4 Genetic variation of grain yield and total dry matter (TDM) in IWP, N22 and their progenies.
| Progeny of IWP × N22 | Grain yield/plant | TDM | |||||||
|---|---|---|---|---|---|---|---|---|---|
| Ambient temperature | High temperature | Ambient temperature | High temperature | ||||||
| Progeny only with allele of RM431 | |||||||||
| IWP-201 | 39.18 | 35.97 | 125.8 | 118.7 | |||||
| IWP-143 | 36.52 | 33.81 | 117.7 | 109.7 | |||||
| IWP-245 | 32.71 | 29.26 | 109.8 | 97.7 | |||||
| IWP-215 | 33.68 | 30.92 | 112.7 | 105.7 | |||||
| IWP-275 | 37.79 | 33.26 | 123.9 | 107.7 | |||||
| Progeny only with allele of RM5757 | |||||||||
| IWP-129 | 38.51 | 34.49 | 125.8 | 115.7 | |||||
| IWP-107 | 31.89 | 28.37 | 105.7 | 95.6 | |||||
| IWP-105 | 34.05 | 30.70 | 114.8 | 101.7 | |||||
| IWP-116 | 31.64 | 27.53 | 104.6 | 98.6 | |||||
| IWP-240 | 36.97 | 33.64 | 120.8 | 108.8 | |||||
| Progeny with both alleles of RM431 and RM5757 | |||||||||
| IWP-295 | 38.68 | 36.21 | 128.8 | 121.8 | |||||
| IWP-277 | 40.42 | 38.86 | 152.9 | 148.9 | |||||
| IWP-246 | 39.57 | 36.95 | 139.0 | 133.9 | |||||
| IWP-296 | 37.94 | 35.41 | 129.8 | 123.8 | |||||
| IWP-166 | 32.68 | 29.73 | 108.8 | 98.7 | |||||
| IWP-158 | 35.67 | 32.86 | 116.8 | 107.7 | |||||
| IWP-265 | 31.03 | 28.98 | 102.7 | 97.7 | |||||
| IWP-153 | 33.08 | 30.19 | 110.8 | 101.7 | |||||
| IWP-139 | 37.45 | 34.44 | 126.9 | 119.8 | |||||
| IWP-233 | 36.75 | 33.14 | 122.8 | 118.7 | |||||
| Progeny without alleles of RM431 and RM5757 | |||||||||
| IWP-147 | 36.74 | 30.14 | 118.7 | 101.6 | |||||
| IWP-142 | 32.25 | 26.49 | 107.7 | 92.6 | |||||
| IWP-141 | 30.44 | 25.21 | 101.7 | 89.6 | |||||
| IWP-146 | 34.90 | 28.97 | 114.7 | 97.6 | |||||
| IWP-104 | 33.17 | 28.63 | 110.8 | 95.7 | |||||
| Parent | |||||||||
| IWP | 38.41 | 32.87 | 124.8 | 107.7 | |||||
| N22 | 32.55 | 30.29 | 108.7 | 101.6 | |||||
| SE = 1.768; CD = 3.504 (P < 0.05). | |||||||||
| CSI | MDA | Sterility | Yield | TDM | |
|---|---|---|---|---|---|
| CSI | 1.0000 | ||||
| MDA | -0.3476* | 1.0000 | |||
| Sterility | -0.3006* | 0.7759** | 1.0000 | ||
| Yield | 0.6209** | -0.5207** | -0.5358** | 1.0000 | |
| TDM | 0.5621** | -0.4921** | -0.5256** | 0.9633** | 1.0000 |
| CSI, Chlorophyll stability index; MDA, Malondialdehyde content; TDM, Total dry matter. * and ** mean significant difference at the 0.05 and 0.01 levels, repectively, by two tailed Pearson’s correlation. | |||||
Table 5 Correlation of physiological traits with yield under high- temperature stress.
| CSI | MDA | Sterility | Yield | TDM | |
|---|---|---|---|---|---|
| CSI | 1.0000 | ||||
| MDA | -0.3476* | 1.0000 | |||
| Sterility | -0.3006* | 0.7759** | 1.0000 | ||
| Yield | 0.6209** | -0.5207** | -0.5358** | 1.0000 | |
| TDM | 0.5621** | -0.4921** | -0.5256** | 0.9633** | 1.0000 |
| CSI, Chlorophyll stability index; MDA, Malondialdehyde content; TDM, Total dry matter. * and ** mean significant difference at the 0.05 and 0.01 levels, repectively, by two tailed Pearson’s correlation. | |||||
| 1 | Cao L Y, Zhao J G, Zhan X D, Li D L, He L B, Cheng S H.2003. Mapping QTLs for heat tolerance and correlation between heat tolerance and photosynthetic rate in rice.Chin J Rice Sci, 17(3): 223-227. (in Chinese with English abstract) |
| 2 | Ceccarelli S, Grando S, Maatougui M, Michael M, Slash M, Haghparast R, Rahmanian M, Taheri A, Al-Yassin A, Benbelkacem A, Labdi M, Mimoun H, Nachit M.2010. Plant breeding and climate changes.J Agric Sci, 148(6): 627-637. |
| 3 | Funaba M, Ishibashi Y, Molla A H, Iwanami K, Iwaya-Inone M.2006. Influence of low/high temperature on water status in developing and maturing rice grains.Plant Prod Sci, 9: 347-354. |
| 4 | Gomez K A, Gomez A A.2010. Statistical Procedures for Agricultural Research. 2nd edn. New York: John Wiley and Sons. |
| 5 | Heath R L, Packer L.1968. Photoperoxidation in isolated chloroplasts: I. Kinetics and stoichiometry of fatty acid peroxidation.Arch Biochem Biophys, 125(1): 189-198. |
| 6 | Jagadish S V K, Cairns J, Lafitte R, Wheeler T R, Price A H, Craufurd P Q.2010. Genetic analysis of heat tolerance at anthesis in rice.Crop Sci, 50(5): 1633-1641. |
| 7 | Jagadish S V K, Craufurd P Q, Wheeler T R.2007. High temperature stress and spikelet fertility in rice (Oryza sativa L.).J Exp Bot, 58(7): 1627-1635. |
| 8 | Jiang J, Zhuang J Y, Fan Y Y, Shen B.2009. Mapping of QTLs for leaf malondialdehyde content associated with stress tolerance in rice.Rice Sci, 16(1): 72-74. |
| 9 | Koleyoras A S.1958. A new method of determining drought resistance.Plant Physiol, 33(3): 232-233. |
| 10 | Kumari M, Dass S M, Virnala Y, Arora P.2004. Physiological parameters governing drought in maize.Ind J Plant Physiol, 9(2): 203-207. |
| 11 | Lan L, Chen W, Lai Y, Suo J F, Kong Z S, Li C, Lu Y, Zhang Y J, Zhao X Y, Zhang X S, Zhang Y S, Han B, Cheng J, Xue Y B.2004. Monitoring of gene expression profiles and isolation of candidate genes involved in pollination and fertilization in rice (Oryza sativa L.) with a 10 K cDNA microarray.Plant Mol Biol, 54: 471-487. |
| 12 | Los D A, Murata N.2004. Membrane fluidity and its roles in the perception of environmental signals.Biochem Biophys Acta, 1666: 142-157. |
| 13 | Mohammed A R, Tarpley L.2009. Impact of high nighttime temperature on respiration, membrane stability, antioxidant capacity, and yield of rice plants.Crop Sci, 49: 313-322. |
| 14 | Mohan M M, Narayanan S L, Ibrahim S M.2000. Chlorophyll stability index (CSI): Its impact on salt tolerance in rice.Int Rice Res Notes, 25(2): 38-39. |
| 15 | Muthulakshmi S.2014. Molecular Breeding for Improving Submergence Tolerance in Rice. Coimbatore: Tamil Nadu Agricultural University. |
| 16 | Prasad P V, Boote K J, Allen Jr L H, Sheehy J E, Thomas J M G.2006. Species, ecotype and cultivar differences in spikelet fertility and harvest index of rice in response to high temperature stress.Field Crops Res, 95: 398-411. |
| 17 | Ristic Z, Bukovnik U, Prasad P V V.2007. Correlation between heat stability of thylakoid membranes and loss of chlorophyll in winter wheat under heat stress.Crop Sci, 47: 2067-2073. |
| 18 | Ristic Z, Bukovnik U, Momcilovi I, Fu J, Prasad P V V.2008. Heat induced accumulation of chloroplast protein synthesis elongation factor, EF-Tu, in winter wheat.J Plant Physiol, 165: 192-202. |
| 19 | Sairam R K, Desmukh P S, Shukla D S.1997. Tolerance of drought and temperature stress in relation to increased antioxidant enzyme activity in wheat.J Agron Crop Sci, 178(3): 171-177. |
| 20 | Samundeswari.2013. Genetic and Physiological Improvement of Rice Variety CO43 for Submergence Tolerance. Coimbatore: Tamil Nadu Agricultural University. |
| 21 | Savchenko G E, Klyuchareva E A, Abrabchik L M, Serdyuchenko E V.2002. Effect of periodic heat shock on the membrane system of etioplasts.Russ J Plant Physiol, 49(3): 349-359. |
| 22 | Snedecor, G W, Cochran W G. 1989. Statistical Methods. 8th edn. Ames, IA: The Iowa State University Press. |
| 23 | Todorov D T, Karanov E N, Smith A R, Hall M A.2003. Chlorophyllase activity and chlorophyll content in wild type and eti5 mutant of A. thaliana subjected to low and high temperature.Biol Plant, 46(4): 633-636. |
| 24 | Talukder S K, Babar M A, Vijayalakshmi K, Poland J, Prasad P V V, Bowden R, Fritz A.2014. Mapping QTL for the traits associated with heat tolerance in wheat (Triticum aestivum L.).BMC Genet, 15: 97. |
| 25 | Wahid A, Gelani S, Ashraf M, Foolad M R.2007. Heat tolerance in plants: An overview.Environ Exp Bot, 61(3): 199-233. |
| 26 | Wassmann R, Jagadish S V K, Heuer S, Ismail A, Redona E, Serraj R, Singh R K, Howell G, Pathak H, Sumfleth K.2009. Climate change affecting rice production: The physiological and agronomic basis for possible adaptation strategies.Adv Agron, 101: 59-122. |
| 27 | Watanabe T, Kume T.2009. A general adaptation strategy for climate change impacts on paddy cultivation: Special reference to the Japanese context.Paddy Water Environ, 7(4): 313-320. |
| 28 | Xiao Y H, Pan Y, Luo L H, Zhang G L, Deng H B, Dai L Y, Liu X L, Tang W B, Chen L Y, Wang G L.2011. Quantitative trait loci associated with seed set under high temperature stress at the flowering stage in rice.Euphytica, 178(3): 331-338. |
| 29 | Ye C R, Argayoso M A, Redoña E D, Sierra S N, Laza M A, Dilla C J, Mo Y J, Thomson M J, Chin J, Delaviña C B, Diaz G Q, Hernandez J E.2012. Mapping QTL for heat tolerance at flowering stage in rice using SNP markers.Plant Breeding, 131(1): 33-41. |
| 30 | Zhang G Z, Chen L Y, Zhang S T, Xiao Y J, He Z Z, Lei D Y.2006. Effect of high temperature stress on protective enzyme activities and membrane permeability of flag leaf in rice.Acta Agron Sin, 32(9): 1306-1310. |
| 31 | Zhou W H, Xue D W, Zhang G P.2012. Identification and physiological characterization of thermo-tolerant rice genotypes.J Zhejiang Univ, 38: 1-9. |
| 32 | Zhu X, Gong H, Chen G, Wang S, Zhang C.2005. Different solute levels in two spring wheat cultivars induced by progressive field water stress at different developmental stages.J Arid Environ, 62(1): 1-14. |
| No related articles found! |
| 阅读次数 | ||||||
|
全文 |
|
|||||
|
摘要 |
|
|||||