Rice Science ›› 2016, Vol. 23 ›› Issue (6): 287-296.DOI: 10.1016/j.rsci.2016.09.002
• • 下一篇
收稿日期:2016-07-25
接受日期:2016-09-22
出版日期:2016-12-12
发布日期:2016-08-10
. [J]. Rice Science, 2016, 23(6): 287-296.
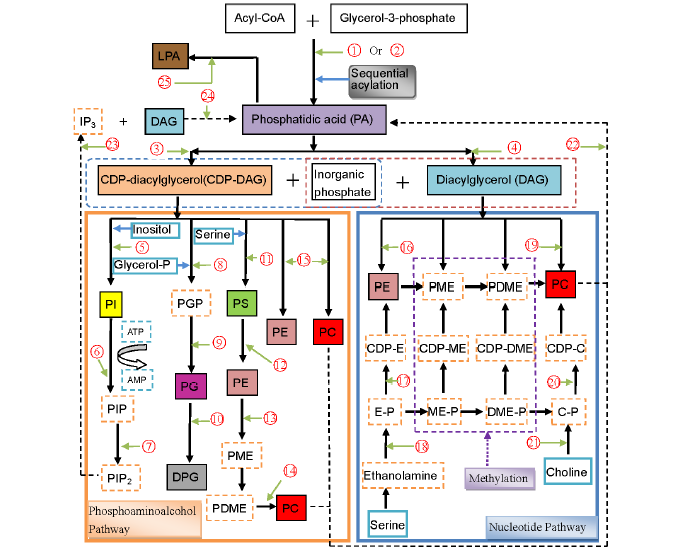
Fig. 1. Conceivable biosynthetic pathways of phospholipids in cereals. Drawn based on Kinney (1993), D’Arrigo and Servi (2010) and Liu et al (2013). E, Ethanolamine; ME, Methylethanolamine; DME, Dimethylethanolamine; IP3, inositol 1,4,5-triphosphate; LPA, Lysophosphatidic acid; C, Choline; P, Phosphate; CDP, Cytidinediphosphate; PE, Phosphatidylethanolamine; PME, Phosphatidylmethylethanolamine; PDME, Phosphatidyldimethyle- thanolamine; PC, Phosphatidylcholine; PS, Phosphatidylserine; PI, Phosphatidylinositol; PIP, Phosphatidylinositol phosphate; PIP2, Phosphati- dylinositolbisphosphate; PGP, Phosphoglycerol phosphate; PG, Phosphatidylglycerol; DPG, Diphosphatidylglycerol; , Glycerol-3-phosphate acyltransferase; , 1-monoacylglycerol-3-phosphate acyltransferase; , CDP-diacylglycerol synthase (CTP: phosphatidatecytidylyltransferase); , Phosphatidatephosphohydrolase; , PI synthase (CDP-diacylglycerol: myo-inositol phosphatidyltransferase); , PI 4-kinase (ATP: phosphati- dylinositol-4-phosphotransferase); , PIP kinase (ATP: phosphatidylinositol 4-phosphate 5-phosphotransferase); , PGP synthase (CDP-diacylgly- cerolphosphatidyltransferase); , PGP phosphatase (phosphatidylglycerol-phosphate phosphohydrolase); , CDP diacylglycerolphosphatidly- transerase; , PS synthase (CDP-diacylglycerol: L-serine O-phosphatidyltransferase); , PS decarboxylase; , PE N-methyltransferase; , Phospholipid N-methyltransferase; , Aminoalcoholphosphotransferase; , Ethanolaminephosphotransferase (CDP-ethanolamine: 1,2-diacylglycerol cytidylyltransferase); , Ethanolamine phosphate cytidylyltransferase (CTP: ethanolamine phosphate cytidylyltransferase); , Ethanolamine kinase (ATP: ethanolamine phosphotransferase); , Cholinephosphotransferase (CDP-choline: 1,2-diacylglycerol cytidylyltransferase); , Choline phosphate cytidylyltransferase (CTP: choline phosphate cytidylyltransferase); , Choline kinase (ATP: choline phosphotransferase); , Phospholipase D (PLD) (Phosphatidylcholinephosphatidohydrolase); , Phospholipase C (PLC); , Diacylglycerol (DAG) kinase; , Phospholipase A2 (PLA2).
| Trait | Year | Model | QTL | Chr | Position a (bp) | P-value | Major allele | Minor allele | Minor allele frequency | Allelic effect (R2) | |
| LPC16:0 | 2011 | K | qC160-6-1 | 6 | 26 685 967 | 4.72 × 10⁻³ | C | T | 0.30 | 0.8011 | |
| 2012 | K | qC160-6-2 | 6 | 3 235 560 | 4.41 × 10⁻³ | G | A | 0.25 | 0.5573 | ||
| qC160-8 | 8 | 8 481 084 | 3.64 × 10⁻³ | A | G | 0.40 | 0.5872 | ||||
| LPC18:1 | 2012 | Q+K | qC181-2 | 2 | 14 522 544 | 3.15 × 10⁻³ | G | A | 0.20 | 0.8346 | |
| qC181-1 | 1 | 27 729 601 | 4.20 × 10⁻³ | C | T | 0.30 | 0.8107 | ||||
| LPC18:2 | 2011 | K | qC182-9 | 9 | 15 125 638 | 4.37 × 10⁻³ | C | T | 0.20 | 0.5585 | |
| 2012 | K | qC182-11 | 11 | 17 847 796 | 4.07 × 10⁻³ | A | T | 0.30 | 0.5698 | ||
| LPC18:3 | 2011 | K | qC183-1 | 1 | 23 517 183 | 3.27 × 10⁻³ | A | C | 0.25 | 0.6047 | |
| 2012 | K | qC183-1 | 1 | 23 517 183 | 4.89 × 10⁻³ | A | C | 0.25 | 0.5411 | ||
| TLPC | 2011 | ANOVA | qC-5 | 5 | 23 465 186 | 4.20 × 10⁻³ | G | A | 0.25 | 0.5647 | |
| qC-9 | 9 | 15 125 638 | 2.62 × 10⁻³ | C | T | 0.20 | 0.6409 | ||||
| qC-12 | 12 | 21 175 392 | 3.73 × 10⁻³ | T | A | 0.25 | 0.5835 | ||||
| 2012 | K | qC-10 | 10 | 5 339 258 | 4.36 × 10⁻³ | G | A | 0.25 | 0.5589 | ||
| LPE16:0 | 2011 | ANOVA | qE160-1 | 1 | 6 971 525 | 3.33 × 10⁻³ | G | A | 0.25 | 0.6016 | |
| LPE18:1 | 2011 | Q+K | qE181-2 | 2 | 14 522 544 | 3.26 × 10⁻³ | G | A | 0.20 | 0.7802 | |
| 2012 | Q+K | qE181-2 | 2 | 14 522 544 | 2.17 × 10⁻³ | G | A | 0.20 | 0.8364 | ||
| LPE18:2 | 2011 | K | qE182-1 | 1 | 23 585 360 | 3.23 × 10⁻³ | C | T | 0.25 | 0.6064 | |
| qE182-4 | 4 | 31 271 474 | 4.23 × 10⁻³ | T | C | 0.20 | 0.5637 | ||||
| qE182-11 | 11 | 17 943 118 | 3.82 × 10⁻³ | T | A | 0.35 | 0.5798 | ||||
| LPE18:3 | 2011 | K | qE183-1 | 1 | 23 517 183 | 4.27 × 10⁻³ | A | C | 0.25 | 0.5623 | |
| 2012 | K | qE183-1 | 1 | 23 517 183 | 4.33 × 10⁻³ | A | C | 0.25 | 0.5600 | ||
| TLPE | 2011 | ANOVA | qE-10 | 10 | 5 339 258 | 4.69 × 10⁻³ | G | A | 0.25 | 0.5477 | |
| TLPL | 2011 | ANOVA | qL-9 | 9 | 15 125 638 | 2.92 × 10⁻³ | C | T | 0.20 | 0.6229 | |
| qL-10 | 10 | 5 339 258 | 4.67 × 10⁻³ | G | A | 0.25 | 0.5482 | ||||
| qL-12 | 12 | 21 175 392 | 4.93 × 10⁻³ | T | A | 0.25 | 0.5399 | ||||
| 2012 | K | qL-10 | 10 | 5 339 258 | 4.19 × 10⁻³ | G | A | 0.25 | 0.5649 | ||
| LPC14:0, 1-myristoyl-2-hydroxy-sn-glycero-3-phosphocholine; LPC16:0, 1-palmitoyl-2-hydroxy-sn-glycero-3-phosphocholine; LPC18:1, 1-oleoyl- 2-hydroxy-sn-glycero-3-phosphocholine; LPC18:2, 1-linoleoyl-2-hydroxy-sn-glycero-3-phosphocholine; LPC18:3, 1-linolenoyl-2-hydroxy-sn- glycero-3-phosphocholine; LPE14:0, 1-myristoyl-2-hydroxy-sn-glycero-3-phosphoethanolamine; LPE16:0, 1-palmitoyl-2-hydroxy-sn-glycero-3- phosphoethanolamine; LPE18:1, 1-oleoyl-2-hydroxy-sn-glycero-3-phosphoethanolamine; LPE18:2, 1-linoleoyl-2-hydroxy-sn-glycero-3-phosphoethanolamine; LPE18:3, 1-linolenoyl-2-hydroxy-sn-glycero-3-phosphoethanolamine; TLPC, Total lysophosphatidylcholine; TLPE, Total lysophosphatidylethanolamine; TLPL, Total lysophospholipid; Q, Population structure; K, Kinship; ANOVA, Analysis of variance; Chr, Chromosome. a, Position in base pairs for the leading SNP of rice sequence. | |||||||||||
Table 1 Genome-wide significantly associated QTLs for rice lysophospholipids (LPLs)
| Trait | Year | Model | QTL | Chr | Position a (bp) | P-value | Major allele | Minor allele | Minor allele frequency | Allelic effect (R2) | |
| LPC16:0 | 2011 | K | qC160-6-1 | 6 | 26 685 967 | 4.72 × 10⁻³ | C | T | 0.30 | 0.8011 | |
| 2012 | K | qC160-6-2 | 6 | 3 235 560 | 4.41 × 10⁻³ | G | A | 0.25 | 0.5573 | ||
| qC160-8 | 8 | 8 481 084 | 3.64 × 10⁻³ | A | G | 0.40 | 0.5872 | ||||
| LPC18:1 | 2012 | Q+K | qC181-2 | 2 | 14 522 544 | 3.15 × 10⁻³ | G | A | 0.20 | 0.8346 | |
| qC181-1 | 1 | 27 729 601 | 4.20 × 10⁻³ | C | T | 0.30 | 0.8107 | ||||
| LPC18:2 | 2011 | K | qC182-9 | 9 | 15 125 638 | 4.37 × 10⁻³ | C | T | 0.20 | 0.5585 | |
| 2012 | K | qC182-11 | 11 | 17 847 796 | 4.07 × 10⁻³ | A | T | 0.30 | 0.5698 | ||
| LPC18:3 | 2011 | K | qC183-1 | 1 | 23 517 183 | 3.27 × 10⁻³ | A | C | 0.25 | 0.6047 | |
| 2012 | K | qC183-1 | 1 | 23 517 183 | 4.89 × 10⁻³ | A | C | 0.25 | 0.5411 | ||
| TLPC | 2011 | ANOVA | qC-5 | 5 | 23 465 186 | 4.20 × 10⁻³ | G | A | 0.25 | 0.5647 | |
| qC-9 | 9 | 15 125 638 | 2.62 × 10⁻³ | C | T | 0.20 | 0.6409 | ||||
| qC-12 | 12 | 21 175 392 | 3.73 × 10⁻³ | T | A | 0.25 | 0.5835 | ||||
| 2012 | K | qC-10 | 10 | 5 339 258 | 4.36 × 10⁻³ | G | A | 0.25 | 0.5589 | ||
| LPE16:0 | 2011 | ANOVA | qE160-1 | 1 | 6 971 525 | 3.33 × 10⁻³ | G | A | 0.25 | 0.6016 | |
| LPE18:1 | 2011 | Q+K | qE181-2 | 2 | 14 522 544 | 3.26 × 10⁻³ | G | A | 0.20 | 0.7802 | |
| 2012 | Q+K | qE181-2 | 2 | 14 522 544 | 2.17 × 10⁻³ | G | A | 0.20 | 0.8364 | ||
| LPE18:2 | 2011 | K | qE182-1 | 1 | 23 585 360 | 3.23 × 10⁻³ | C | T | 0.25 | 0.6064 | |
| qE182-4 | 4 | 31 271 474 | 4.23 × 10⁻³ | T | C | 0.20 | 0.5637 | ||||
| qE182-11 | 11 | 17 943 118 | 3.82 × 10⁻³ | T | A | 0.35 | 0.5798 | ||||
| LPE18:3 | 2011 | K | qE183-1 | 1 | 23 517 183 | 4.27 × 10⁻³ | A | C | 0.25 | 0.5623 | |
| 2012 | K | qE183-1 | 1 | 23 517 183 | 4.33 × 10⁻³ | A | C | 0.25 | 0.5600 | ||
| TLPE | 2011 | ANOVA | qE-10 | 10 | 5 339 258 | 4.69 × 10⁻³ | G | A | 0.25 | 0.5477 | |
| TLPL | 2011 | ANOVA | qL-9 | 9 | 15 125 638 | 2.92 × 10⁻³ | C | T | 0.20 | 0.6229 | |
| qL-10 | 10 | 5 339 258 | 4.67 × 10⁻³ | G | A | 0.25 | 0.5482 | ||||
| qL-12 | 12 | 21 175 392 | 4.93 × 10⁻³ | T | A | 0.25 | 0.5399 | ||||
| 2012 | K | qL-10 | 10 | 5 339 258 | 4.19 × 10⁻³ | G | A | 0.25 | 0.5649 | ||
| LPC14:0, 1-myristoyl-2-hydroxy-sn-glycero-3-phosphocholine; LPC16:0, 1-palmitoyl-2-hydroxy-sn-glycero-3-phosphocholine; LPC18:1, 1-oleoyl- 2-hydroxy-sn-glycero-3-phosphocholine; LPC18:2, 1-linoleoyl-2-hydroxy-sn-glycero-3-phosphocholine; LPC18:3, 1-linolenoyl-2-hydroxy-sn- glycero-3-phosphocholine; LPE14:0, 1-myristoyl-2-hydroxy-sn-glycero-3-phosphoethanolamine; LPE16:0, 1-palmitoyl-2-hydroxy-sn-glycero-3- phosphoethanolamine; LPE18:1, 1-oleoyl-2-hydroxy-sn-glycero-3-phosphoethanolamine; LPE18:2, 1-linoleoyl-2-hydroxy-sn-glycero-3-phosphoethanolamine; LPE18:3, 1-linolenoyl-2-hydroxy-sn-glycero-3-phosphoethanolamine; TLPC, Total lysophosphatidylcholine; TLPE, Total lysophosphatidylethanolamine; TLPL, Total lysophospholipid; Q, Population structure; K, Kinship; ANOVA, Analysis of variance; Chr, Chromosome. a, Position in base pairs for the leading SNP of rice sequence. | |||||||||||
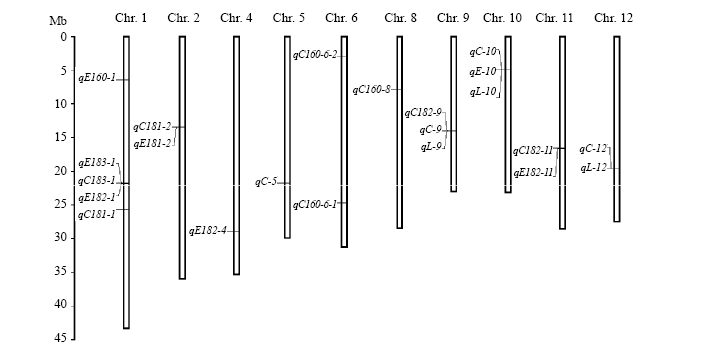
Fig. 2. Location of QTLs for rice starch lysophospholipids (LPLs) on chromosomes (Chr). C160, C181, C182, C183, E160, E181, E182, E183, C, E and L in the QTLs represent LPC16:0, LPC18:1, LPC18:2, LPC18:3, LPE16:0, LPE18:1, LPE18:2, LPE18:3, total lysophosphatidylcholine, total lysophosphatidylethanolamine and total lysophospholipid, respectively.
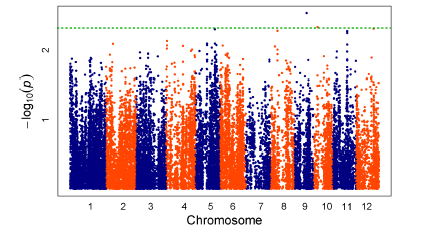
Fig. 3. Manhattan plots of association test for total lysophospholipid.
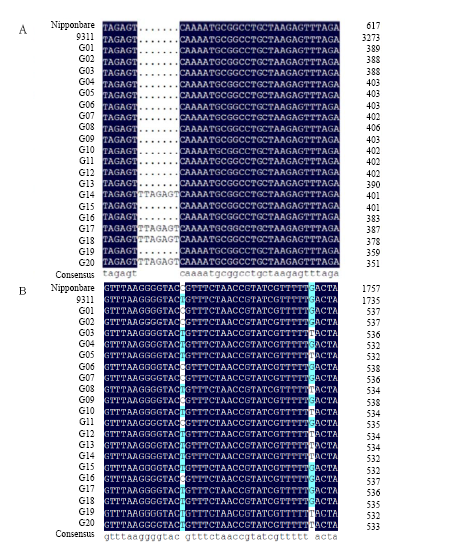
Fig. 4. Part sequence alignments of AAPT and PLA2 genes. A, InDel found in AAPT gene among G01-G20; B, Single nucleotide polymorphism found in PLA2 gene among G01-G20. AAPT, Aminoalcoholphosphotransferase; PLA2, Phospholipase A2.
| Primer | Type | Sequence (5′-3′) | PCR product (bp) | Restriction enzyme | Enzyme digestion product (bp) |
| AAPT1-F | InDel | CCAGCCTTGTTTCAATACCTG | 134/127 | - | - |
| AAPT1-R | AAATGTAGGAAGTTTTTACTTGC | ||||
| AAPT2-F | dCAPS | AAGAGCAAGTAAAAACTTCCTAAATT | 222 | ApoI | 22, 200 |
| AAPT2-R | GATACAAATGCCCAAATACCA | ||||
| AAPT3-F | dCAPS | CAAAGATCAATGCTGGGTAATTTC | 184 | SphI | 22, 162 |
| AAPT3-R | AGGTAAATCAGTTCACCTGTGCA | ||||
| PLD1-F | dCAPS | CATCCTGCACTAAAAACAGTTGAAT | 214 | HinfI | 22, 192 |
| PLD1-R | TGCACAACACCAGAGCCCCACC | ||||
| PLD2-F | dCAPS | CCTCCCAAAGTTTAGGCGGAAAAGGCC | 187 | HpaII | 27, 160 |
| PLD2-R | TCAAAGCTCACAATAGCAGAATA | ||||
| PLA21-F | dCAPS | TTCCTATTGTTTCTTCCTCCCTCTT | 230 | HinfI | 20, 210 |
| PLA21-R | GAAAAAACAAAATTAAAAAAGAGT | ||||
| dCAPS, Development of derived cleaved amplified polymorphic sequences. Underlined letter means the mismatch base. | |||||
Table 2 Primers for enzyme digestion of several single nucleotide polymorphisms
| Primer | Type | Sequence (5′-3′) | PCR product (bp) | Restriction enzyme | Enzyme digestion product (bp) |
| AAPT1-F | InDel | CCAGCCTTGTTTCAATACCTG | 134/127 | - | - |
| AAPT1-R | AAATGTAGGAAGTTTTTACTTGC | ||||
| AAPT2-F | dCAPS | AAGAGCAAGTAAAAACTTCCTAAATT | 222 | ApoI | 22, 200 |
| AAPT2-R | GATACAAATGCCCAAATACCA | ||||
| AAPT3-F | dCAPS | CAAAGATCAATGCTGGGTAATTTC | 184 | SphI | 22, 162 |
| AAPT3-R | AGGTAAATCAGTTCACCTGTGCA | ||||
| PLD1-F | dCAPS | CATCCTGCACTAAAAACAGTTGAAT | 214 | HinfI | 22, 192 |
| PLD1-R | TGCACAACACCAGAGCCCCACC | ||||
| PLD2-F | dCAPS | CCTCCCAAAGTTTAGGCGGAAAAGGCC | 187 | HpaII | 27, 160 |
| PLD2-R | TCAAAGCTCACAATAGCAGAATA | ||||
| PLA21-F | dCAPS | TTCCTATTGTTTCTTCCTCCCTCTT | 230 | HinfI | 20, 210 |
| PLA21-R | GAAAAAACAAAATTAAAAAAGAGT | ||||
| dCAPS, Development of derived cleaved amplified polymorphic sequences. Underlined letter means the mismatch base. | |||||
| Accession | AAPT1 | AAPT2 | AAPT3 | PLD1 | PLD2 | PLA21 | Accession | AAPT1 | AAPT2 | AAPT3 | PLD1 | PLD2 | PLA21 |
| G01 | D | T | A | C | G | G | G18 | I | A | G | C | C | G |
| G02 | D | T | A | C | G | G | G19 | D | T | A | C | G | T |
| G03 | D | T | A | A | C | T | G20 | I | A | G | A | C | T |
| G04 | D | T | A | A | C | G | R01 | D | T | A | C | C | G |
| G05 | D | T | A | C | C | T | R02 | D | T | A | C | C | G |
| G06 | D | T | A | C | G | G | R03 | D | T | A | C | G | T |
| G07 | D | T | A | C | G | G | R04 | D | T | A | C | C | G |
| G08 | D | T | A | C | C | T | R05 | D | T | A | C | C | T |
| G09 | D | T | A | C | G | G | R06 | D | T | A | C | C | G |
| G10 | D | T | A | A | C | T | R07 | D | T | A | C | G | G |
| G11 | D | T | A | C | G | G | R08 | I | A | G | C | C | G |
| G12 | D | T | A | C | C | T | R09 | D | T | A | C | C | T |
| G13 | D | T | A | C | C | T | R10 | I | A | G | C | C | T |
| G14 | I | A | G | C | C | T | R11 | D | T | A | C | C | T |
| G15 | D | T | A | C | C | G | R12 | D | T | A | C | C | T |
| G16 | D | T | A | C | G | G | R13 | I | A | G | C | C | T |
| G17 | I | A | G | C | C | G | |||||||
| AAPT, Aminoalcoholphosphotransferase; PLD, Phospholipase D; PLA2, Phospholipase A2; I, Insertion; D, Deletion. | |||||||||||||
Table 3 Summary of alleles of three candidate genes.
| Accession | AAPT1 | AAPT2 | AAPT3 | PLD1 | PLD2 | PLA21 | Accession | AAPT1 | AAPT2 | AAPT3 | PLD1 | PLD2 | PLA21 |
| G01 | D | T | A | C | G | G | G18 | I | A | G | C | C | G |
| G02 | D | T | A | C | G | G | G19 | D | T | A | C | G | T |
| G03 | D | T | A | A | C | T | G20 | I | A | G | A | C | T |
| G04 | D | T | A | A | C | G | R01 | D | T | A | C | C | G |
| G05 | D | T | A | C | C | T | R02 | D | T | A | C | C | G |
| G06 | D | T | A | C | G | G | R03 | D | T | A | C | G | T |
| G07 | D | T | A | C | G | G | R04 | D | T | A | C | C | G |
| G08 | D | T | A | C | C | T | R05 | D | T | A | C | C | T |
| G09 | D | T | A | C | G | G | R06 | D | T | A | C | C | G |
| G10 | D | T | A | A | C | T | R07 | D | T | A | C | G | G |
| G11 | D | T | A | C | G | G | R08 | I | A | G | C | C | G |
| G12 | D | T | A | C | C | T | R09 | D | T | A | C | C | T |
| G13 | D | T | A | C | C | T | R10 | I | A | G | C | C | T |
| G14 | I | A | G | C | C | T | R11 | D | T | A | C | C | T |
| G15 | D | T | A | C | C | G | R12 | D | T | A | C | C | T |
| G16 | D | T | A | C | G | G | R13 | I | A | G | C | C | T |
| G17 | I | A | G | C | C | G | |||||||
| AAPT, Aminoalcoholphosphotransferase; PLD, Phospholipase D; PLA2, Phospholipase A2; I, Insertion; D, Deletion. | |||||||||||||
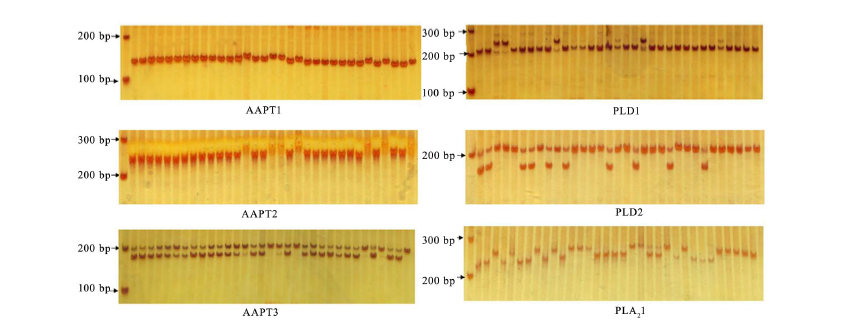
Fig. 5. Polymorphism of InDel and simple nucleotide polymorphisms in AAPT, PLD and PLA2 genes in rice accessions G01-G20 and R01-R13. AAPT, Aminoalcoholphosphotransferase; PLD, Phospholipase D; PLA2, Phospholipase A2. Lanes from left to right in each part are marker, G01-G20 and R01-R13, respectively.
| Gene | Marker | Trait | Non-waxy accession (31) | All rice accession (33) | QTL | |||
| p_Marker | R2_Marker | p_Marker | R2_Marker | |||||
| PLD | PLD1 | LPC16:0 | 0.0149 | 0.1876 | 0.0984 | 0.0856 | qC160-6-1 | |
| PLA2 | PLA21 | LPC18:2 | 0.0902 | 0.0958 | 0.0277 | 0.1468 | qC182-11, qE182-11 | |
| PLD, Phospholipase D; PLA2, Phospholipase A2. | ||||||||
Table 4 Marker loci associated with starch lysophospholipids (LPLs) traits detected with analysis of variance (ANOVA) model in 31 non-waxy and all the 33 rice accessions.
| Gene | Marker | Trait | Non-waxy accession (31) | All rice accession (33) | QTL | |||
| p_Marker | R2_Marker | p_Marker | R2_Marker | |||||
| PLD | PLD1 | LPC16:0 | 0.0149 | 0.1876 | 0.0984 | 0.0856 | qC160-6-1 | |
| PLA2 | PLA21 | LPC18:2 | 0.0902 | 0.0958 | 0.0277 | 0.1468 | qC182-11, qE182-11 | |
| PLD, Phospholipase D; PLA2, Phospholipase A2. | ||||||||
| 1 | Ambrosewicz-Walacik M, Tańska M, Rotkiewicz D.2015. Phospholipids of rapeseeds and rapeseed oils: Factors determining their content and technological significance: A review.Food Rev Int, 31(4): 385-400. |
| 2 | Bessoule J J, Moreau P.2004. Phospholipid synthesis and dynamics in plant cells. In: Daum G. Lipid Metabolism and Membrane Biogenesis. Berlin, Germany: Springer: 89-124. |
| 3 | Bohdanowicz M, Grinstein S.2013. Role of phospholipids in endocytosis, phagocytosis, and macropinocytosis.Physiol Rev, 93(1): 69-106. |
| 4 | Choi S K, Takahashi E, Inatsu O, Mano Y, Ohnishi M.2005. Component fatty acids of acidic glycerophospholipids in rice grains: Universal order of unsaturation index in each lipid among varieties.J Oleo Sci, 54(7): 369-373. |
| 5 | D’Arrigo P, Servi S.2010. Synthesis of lysophospholipids.Molecules, 15: 1354-1377. |
| 6 | Doyle J.1991. DNA protocols for plants: CTAB total DNA isolation. In: Hewitt G M, Johnston A. Molecular Techniques in Taxonomy. Berlin, Germany: Springer: 283-293. |
| 7 | Eastmond P J, Quettier A L, Kroon J T M, Craddock C, Adams N, Slabas A R.2010. PHOSPHATIDIC ACID PHOSPHOHYDRO- LASE1 and 2 regulate phospholipid synthesis at the endoplasmic reticulum inArabidopsis. Plant Cell, 22(8): 2796-2811. |
| 8 | Farquharson K L.2010. Regulation of phospholipid biosynthesis inArabidopsis. Plant Cell, 22(8): 2527. |
| 9 | Gaspar M L, Hofbauer H F, Kohlwein S D, Henry S A.2011. Coordination of storage lipid synthesis and membrane biogenesis evidence for cross-talk between triacylglycerol metabolism and phosphatidylinositol synthesis.J Biol Chem, 286(3): 1696-1708. |
| 10 | Hofbauer H F, Schopf F H, Schleifer H, Knittelfelder O L, Pieber B, Rechberger G N, Wolinski H, Gaspar M L, Kappe C O, Stadlmann J, Mechtler K, Zenz A, Lohner K, Tehlivets O, Henry S A, Kohlwein S D.2014. Regulation of gene expression through a transcriptional repressor that senses acyl-chain length in membrane phospholipids.Dev Cell, 29(6): 729-739. |
| 11 | Kinney A J.1993. Phospholipid head groups. In: Moore T S J. Lipid Metabolism in Plants. Boca Raton, Florida, USA: CRC Press: 259-284. |
| 12 | Kuhn S, Slavetinsky C J, Peschel A.2015. Synthesis and function of phospholipids inStaphylococcus aureus. Int J Med Microbiol, 305(2): 196-202. |
| 13 | Konieczny A, Ausubel F M.1993. A procedure for mappingArabidopsis mutations using co-dominant ecotype-specific PCR- based markers. Plant J, 4(2): 403-410. |
| 14 | Li H, Peng Z Y, Yang X H, Wang W D, Fu J J, Wang J H, Han Y J, Chai Y C, Guo T T, Yang N, Liu J, Warburton M L, Cheng Y B, Hao X M, Zhang P, Zhao J Y, Liu Y J, Wang G Y, Li J S, Yan J B.2013. Genome-wide association study dissects the genetic architecture of oil biosynthesis in maize kernels.Nat Genet, 45(1): 43-50. |
| 15 | Lipka A E, Tian F, Wang Q S, Peiffer J, Li M, Bradbury P J, Gore M A, Buckler E S, Zhang Z W.2012. GAPIT: Genome association and prediction integrated tool.Bioinformatics, 28(18): 2397-2399. |
| 16 | Liu L, Waters D L E, Rose T J, Bao J S, King G J.2013. Phospholipids in rice: Significance in grain quality and health benefits: A review.Food Chem, 139(1/2/3/4): 1133-1145. |
| 17 | Liu L, Tong C, Bao J S, Waters D L E, Rose T J, King G J.2014. Determination of starch lysophospholipids in rice using liquid chromatography-mass spectrometry (LC-MS).J Agric Food Chem, 62(28): 6600-6607. |
| 18 | Liu W J, Zeng J, Jiang G H, He Y Q.2009. QTLs identification of crude fat content in brown rice and its genetic basis analysis using DH and two backcross populations.Euphytica, 169(2): 197-205. |
| 19 | Maniñgat C C, Juliano B O.1980. Starch lipids and their effect on rice starch properties.Starch Stärke, 32(3): 76-82. |
| 20 | Martin P K, Li T, Sun D X, Biek D P, Schmid M B.1999. Role in cell permeability of an essential two-component system inStaphylococcus aureus. J Bacteriol, 181(12): 3666-3673. |
| 21 | Nakamura A, Ocirc N T, Funahashi S.1958. Nature of lysolecithin in rice grains.Bull Agric Chem Soc Jpn, 22(5): 320-324. |
| 22 | Neff M M, Neff J D, Chory J, Pepper A E.1998. dCAPS, a simple technique for the genetic analysis of single nucleotide polymorphisms: Experimental applications inArabidopsis thaliana genetics. Plant J, 14(3): 387-392. |
| 23 | Perry H J, Harwood J L.1993. Radiolabelling studies of acyl lipids in developing seeds ofBrassica napus: Use of [1-14C]acetate precursor. Phytochemistry, 33(2): 329-333. |
| 24 | Putseys J A, Lamberts L, Delcour J A.2010. Amylose-inclusion complexes: Formation, identity and physico-chemical properties.J Cereal Sci, 51(3): 238-247. |
| 25 | Qin Y, Kim S M, Zhao X H, Lee H S, Jia B Y, Kim K M, Eun M Y, Sohn J K.2010. QTL detection and MAS selection efficiency for lipid content in brown rice (Oryza sativa L.). Genes Genom, 32(6): 506-512. |
| 26 | Ren J, Zhao X Q, Ding Z S, Xiang C, Zhang J, Wang C, Zhang J W, Joseph C A, Zhang Q, Pang Y L, Gao Y M, Shi Y Y.2015. Dissection and QTL mapping of low-phosphorus tolerance using selected introgression lines in rice.Chin J Rice Sci, 29(1): 1-13. (in Chinese with English abstract) |
| 27 | Shen Y Y, Zhang W W, Liu X, Chen L M, Liu S J, Zheng L N, Li J J, Chen Y L, Wu T, Yu Y, Zhong Z Z, Jiang L, Wan J M.2012. Identification of two stably expressed QTLs for fat content in rice (Oryza sativa). Genome, 55(8): 585-590. |
| 28 | Shewry P R, Pinfield N J, Stobart A K.1973. Phospholipids and the phospholipid fatty acids of germinating hazel seeds (Corylus avellana L.). J Exp Bot, 24(6): 1100-1105. |
| 29 | Suzuki Y.2011a. Isolation and characterization of a rice (Oryza sativa L.) mutant deficient in seed phospholipase D, an enzyme involved in the degradation of oil-body membranes. Crop Sci, 51(2): 567-573. |
| 30 | Suzuki Y, Takeuchi Y, Shirasawa K.2011b. Identification of a seed phospholipase D null allele in rice (Oryza sativa L.) and development of SNP markers for phospholipase D deficiency. Crop Sci, 51(5): 2113-2118. |
| 31 | Tong C, Liu L, Waters D L E, Rose T J, Bao J S, King G J.2014. Genotypic variation in lysophospholipids of milled rice.J Agric Food Chem, 62(38): 9353-9361. |
| 32 | Tong C, Liu L, Waters D L E, Huang Y, Bao J S.2015. The contribution of lysophospholipids to pasting and thermal properties of nonwaxy rice starch.Carbohyd Polym, 133: 187-193. |
| 33 | Xu C C, Shanklin J.2016. Triacylglycerol metabolism, function, and accumulation in plant vegetative tissues.Annu Rev Plant Biol, 67: 179-206. |
| 34 | Xu F F, Tang F F, Shao Y F, Chen Y L, Tong C, Bao J S.2014. Genotype × environment interactions for agronomic traits of rice revealed by association mapping.Rice Sci, 21(3): 133-141. |
| 35 | Yang F, Chen Y L, Tong C, Huang Y, Xu F F, Li K H, Corke H, Sun M, Bao J S.2014. Association mapping of starch physicochemical properties with starch synthesis-related gene markers in nonwaxy rice (Oryza sativa L.). Mol Breeding, 34(4): 1747-1763. |
| 36 | Ying J Z, Shan J X, Gao J P, Zhu M Z, Shi M, Lin H X.2012. Identification of quantitative trait loci for lipid metabolism in rice seeds.Mol Plant, 5(4): 865-875. |
| 37 | Yoshida H, Tanigawa T, Yoshida N, Kuriyama I, Tomiyama Y, Mizushina Y.2011. Lipid components, fatty acid distributions of triacylglycerols and phospholipids in rice brans.Food Chem, 129(2): 479-484. |
| 38 | Zhan X D, Yu P, Lin Z C, Chen D B, Shen X H, Zhang Y X, Fu J L, Cheng S H, Cao L Y.2014. QTL mapping of heading date and yield-related traits in rice using a recombination inbred lines (RILs) population derived from BG1/XLJ.Chin J Rice Sci, 28(6): 570-580. (in Chinese with English abstract) |
| 39 | (Managing Editor: Li Guan) |
| No related articles found! |
| 阅读次数 | ||||||
|
全文 |
|
|||||
|
摘要 |
|
|||||