Rice Science ›› 2018, Vol. 25 ›› Issue (3): 121-131.DOI: 10.1016/j.rsci.2018.04.001
• • 下一篇
收稿日期:2018-01-15
接受日期:2018-03-13
出版日期:2018-05-04
发布日期:2018-03-07
. [J]. Rice Science, 2018, 25(3): 121-131.

Fig. 1. Morphological characteristics of the parents and F1 generations.Left, Female parent; Middle, Male parent; Right, F1. Bars in A and B are 20 cm whereas bars in C and D are 5 mm.
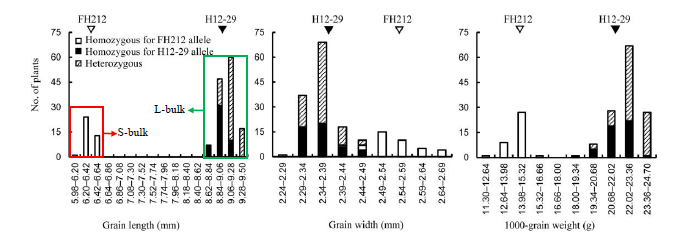
Fig. 2. Frequency distribution of grain trait performance in the NIL-F2 population and construction of two extremely bulks based on the segregation of grain length.
| Sample a | No. of raw reads | No. of clean reads | Raw base (Gb) | Clean base (Gb) | Percentage of high quality base b (%) | GC content (%) | Average depth | Genome coverage (%) |
|---|---|---|---|---|---|---|---|---|
| H12-29 | 127 306 420 | 123 917 740 | 15.91 | 15.23 | 98.33 | 43.47 | 40.02× | 92.13 |
| FH212 | 115 010 274 | 112 007 606 | 14.38 | 13.77 | 98.35 | 43.56 | 36.12× | 91.89 |
| L-bulk | 121 555 464 | 117 864 724 | 15.19 | 14.48 | 98.30 | 43.77 | 37.85× | 92.57 |
| S-bulk | 128 780 448 | 125 643 324 | 16.10 | 15.46 | 98.42 | 43.85 | 40.43× | 92.50 |
Table 1 Summary of the paired-end sequencing results.
| Sample a | No. of raw reads | No. of clean reads | Raw base (Gb) | Clean base (Gb) | Percentage of high quality base b (%) | GC content (%) | Average depth | Genome coverage (%) |
|---|---|---|---|---|---|---|---|---|
| H12-29 | 127 306 420 | 123 917 740 | 15.91 | 15.23 | 98.33 | 43.47 | 40.02× | 92.13 |
| FH212 | 115 010 274 | 112 007 606 | 14.38 | 13.77 | 98.35 | 43.56 | 36.12× | 91.89 |
| L-bulk | 121 555 464 | 117 864 724 | 15.19 | 14.48 | 98.30 | 43.77 | 37.85× | 92.57 |
| S-bulk | 128 780 448 | 125 643 324 | 16.10 | 15.46 | 98.42 | 43.85 | 40.43× | 92.50 |
| Sample | No. of SNPs | No. of InDels |
|---|---|---|
| H12-29 | 3 525 128 | 421 211 |
| FH212 | 3 539 142 | 415 224 |
| L-bulk | 3 620 518 | 425 506 |
| S-bulk | 3 627 828 | 428 012 |
Table 2 Number of single nucleotide polymorphisms (SNPs) and InDels detected in pools and parental lines.
| Sample | No. of SNPs | No. of InDels |
|---|---|---|
| H12-29 | 3 525 128 | 421 211 |
| FH212 | 3 539 142 | 415 224 |
| L-bulk | 3 620 518 | 425 506 |
| S-bulk | 3 627 828 | 428 012 |
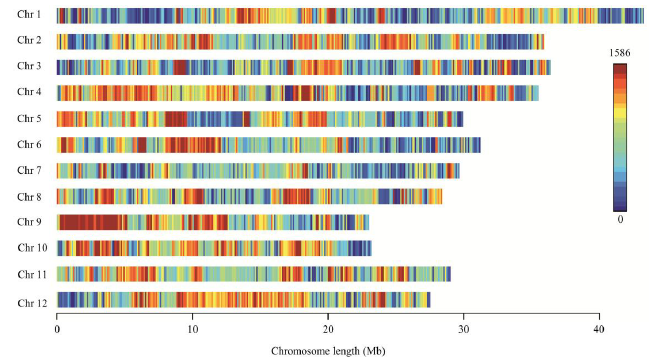
Fig. 3. Distribution of 455 262 SNPs used in QTL-seq analysis on rice genome. Chr, Chromosome; SNP, Single nucleotide polymorphism. X-axis is the position of SNP on chromosome. Different colors represent the density of SNPs within a sliding window of 50 kb.
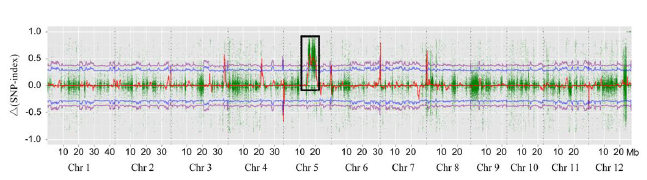
Fig. 4. Δ(SNP-index) graph for the whole genome was plotted by plotting the average Δ(SNP-index) using a sliding window of 1 Mb with a step of 10 kb. SNP, Single nucleotide polymorphism. Each spot represents a SNP, and X-axis corresponds to the position of rice genome. Red line is the average value of Δ(SNP-index). Δ(SNP-index) plot with the statistical confidence interval under the null hypothesis of no QTL (P < 0.05, blue line; P < 0.01, purple line). A significant region on chromosome 5 (black box) was identified for grain length and weight (15-20 Mb).
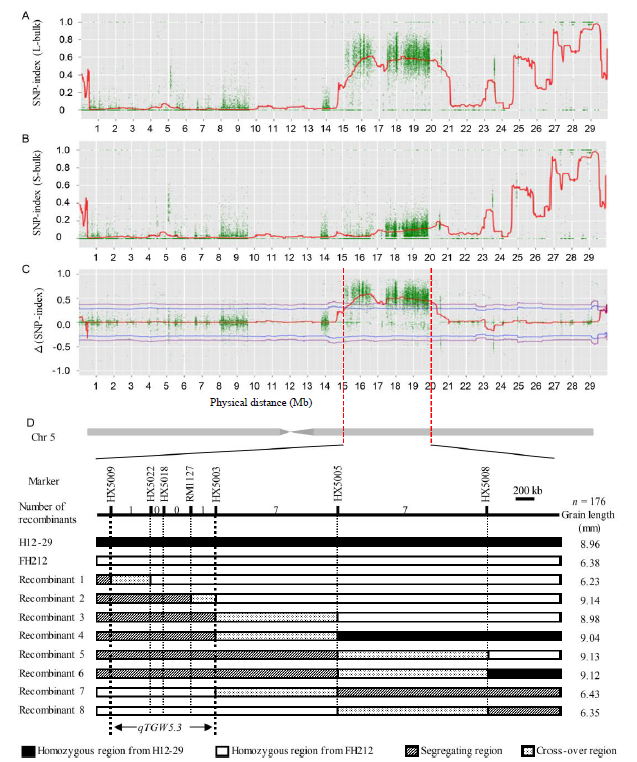
Fig. 5. Mapping of qTGW5.3. A to C, SNP-index graphs of L-bulk and S-bulk, and Δ(SNP-index) from QTL-seq analysis, respectively; D, Graphical genomic regions of the eight recombinants and the location of qTGW5.3 identified for grain length and weight. Chr, Chromosome.
| Marker | Physical position (bp) a | Forward primer | Reverse primer | |
|---|---|---|---|---|
| HX5009 | 15 151 174- | 15 151 528 | AAACAAGAGCCAAAGAAGTCA | TTCCGCTACATCCAACAAATA |
| HX5022 | 15 580 256- | 15 580 414 | AACGCTCACCTACAGATT | GTAATGAACAGGCGAATT |
| HX5018 | 15 722 159- | 15 722 347 | TCAGCATCGGAACAAATC | GAAGGGACGGACAGAAAC |
| HX5003 | 16 285 064- | 16 285 514 | CTCAGGAAGGTAGTCCGAGTCAT | CACAAGCCGTCAAGTTTATCACA |
| HX5005 | 17 602 063- | 17 602 197 | GGCAATACCAATCTATCGCCTCT | GCTGGCACCATTATCAAAGTTCA |
| HX5008 | 19 224 457- | 19 224 922 | CGTTCAGGCTTGTCTTCTTCTTAC | AATCACGGCTCCACCTGTTATTT |
Table 3 Sequences and physical location of the markers.
| Marker | Physical position (bp) a | Forward primer | Reverse primer | |
|---|---|---|---|---|
| HX5009 | 15 151 174- | 15 151 528 | AAACAAGAGCCAAAGAAGTCA | TTCCGCTACATCCAACAAATA |
| HX5022 | 15 580 256- | 15 580 414 | AACGCTCACCTACAGATT | GTAATGAACAGGCGAATT |
| HX5018 | 15 722 159- | 15 722 347 | TCAGCATCGGAACAAATC | GAAGGGACGGACAGAAAC |
| HX5003 | 16 285 064- | 16 285 514 | CTCAGGAAGGTAGTCCGAGTCAT | CACAAGCCGTCAAGTTTATCACA |
| HX5005 | 17 602 063- | 17 602 197 | GGCAATACCAATCTATCGCCTCT | GCTGGCACCATTATCAAAGTTCA |
| HX5008 | 19 224 457- | 19 224 922 | CGTTCAGGCTTGTCTTCTTCTTAC | AATCACGGCTCCACCTGTTATTT |
| Trait | Homozygous genotypic groups (Mean ± SD) | P | A | R2 (%) | |
|---|---|---|---|---|---|
| NILH12-29 | NILFH212 | ||||
| GL (mm) | 8.98 ± 0.07 | 6.70 ± 0.07 | < 0.0001 | -1.14 | 99.64 |
| GW (mm) | 2.57 ± 0.02 | 2.79 ± 0.02 | < 0.0001 | 0.11 | 95.51 |
| TGW (g) | 24.53 ± 0.49 | 18.30 ± 0.55 | < 0.0001 | -3.11 | 97.32 |
| NPP | 6.40 ± 0.90 | 6.00 ± 0.80 | 0.0457 | -0.24 | 6.34 |
| NGP | 171.80 ± 16.90 | 182.10 ± 20.0 | 0.0191 | 5.12 | 7.27 |
| NSP | 191.90 ± 20.10 | 203.30 ± 16.90 | 0.006 | 5.72 | 8.85 |
| GY (g) | 27.13 ± 4.85 | 19.95 ± 3.89 | < 0.0001 | -3.59 | 40.65 |
Table 4 QTL analysis in near isogenic line (NIL) populations.
| Trait | Homozygous genotypic groups (Mean ± SD) | P | A | R2 (%) | |
|---|---|---|---|---|---|
| NILH12-29 | NILFH212 | ||||
| GL (mm) | 8.98 ± 0.07 | 6.70 ± 0.07 | < 0.0001 | -1.14 | 99.64 |
| GW (mm) | 2.57 ± 0.02 | 2.79 ± 0.02 | < 0.0001 | 0.11 | 95.51 |
| TGW (g) | 24.53 ± 0.49 | 18.30 ± 0.55 | < 0.0001 | -3.11 | 97.32 |
| NPP | 6.40 ± 0.90 | 6.00 ± 0.80 | 0.0457 | -0.24 | 6.34 |
| NGP | 171.80 ± 16.90 | 182.10 ± 20.0 | 0.0191 | 5.12 | 7.27 |
| NSP | 191.90 ± 20.10 | 203.30 ± 16.90 | 0.006 | 5.72 | 8.85 |
| GY (g) | 27.13 ± 4.85 | 19.95 ± 3.89 | < 0.0001 | -3.59 | 40.65 |
| [1] | Abe A, Kosugi S, Yoshida K, Natsume S, Takagi H, Kanzaki H, Matsumura H, Yoshida K, Mitsuoka C, Tamiru M, Innan H, Cano L, Kamoun S, Terauchi R.2012. Genome sequencing reveals agronomically important loci in rice using MutMap.Nat Biotechnol, 30: 174-178. |
| [2] | Austin R S, Vidaurre D, Stamatiou G, Breit R, Provart N J, Bonetta D, Zhang J, Fung P, Gong Y, Wang P W, McCourt P, Guttman D S.2011. Next-generation mapping ofArabidopsis genes. Plant J, 67(4): 715-725. |
| [3] | Bai X F, Wu B, Xing Y Z.2012. Yield-related QTLs and their applications in rice genetic improvement.J Integr Plant Biol, 54(5): 300-311. |
| [4] | Bhatia D, Wing R A, Yu Y, Chougule K, Kudrna D, Lee S, Rang A, Singh K.2018. Genotyping by sequencing of rice interspecific backcross inbred lines identifies QTLs for grain weight and grain length.Euphytica, 214: 41. |
| [5] | Chen X, Temnykh S, Xu Y, Cho Y G, McCouch S R.1997. Development of a microsatellite framework map providing genome-wide coverage in rice (Oryza sativa L.). Theor Appl Genet, 95(4): 553-567. |
| [6] | Cheng S H, Zhuang J Y, Fan Y Y, Du J H, Cao L Y.2007. Progress in research and development on hybrid rice: A super-domesticate in China.Ann Bot, 100(5): 959-966. |
| [7] | Daware A, Das S, Srivastava R, Badoni S, Singh A K, Agarwal P, Parida S K, Tyagi A K.2016. An efficient strategy combining SSR markers- and advanced QTL-seq-driven QTL mapping unravels candidate genes regulating grain weight in rice.Front Plant Sci, 7: 1535. |
| [8] | Duan P G, Xu J S, Zeng D L, Zhang B L, Geng M F, Zhang G Z, Huang K, Huang L J, Xu R, Ge S, Qian Q, Li Y H.2017. Natural variation in the promoter ofGSE5 contributes to grain size diversity in rice. Mol Plant, 10(5): 685-694. |
| [9] | Ehrenreich I M, Torabi N, Jia Y, Kent J, Martis S, Shapiro J A, Gresham D, Caudy A A, Kruglyak L.2010. Dissection of genetically complex traits with extremely large pools of yeast segregants.Nature, 464: 1039-1042. |
| [10] | Fang Y X, Wu W M, Zhang X Q, Jiang H, Lu W Y, Pan J J, Hu J, Guo L B, Zeng D L, Xue D W.2015. Identification of quantitative trait loci associated with tolerance to low potassium and related ions concentrations at seedling stage in rice (Oryza sativa L.). Plant Growth Regul, 77(2): 157-166. |
| [11] | Giovannoni J J, Wing R A, Ganal M W, Tanksley S D.1991. Isolation of molecular markers from specific chromosomal intervals using DNA pools from existing mapping populations.Nucl Acids Res, 19: 6553-6558. |
| [12] | Huang H X, Qian Q.2017. Progress in genetic research of rice grain shape and breeding achievements of long-grain shape and good qualityjaponica rice. Chin J Rice Sci, 31(6): 665-672. (in Chinese with English abstract) |
| [13] | Huang K, Wang D K, Duan P G, Zhang B L, Xu R, Li N, Li Y H.2017. WIDE AND THICK GRAIN 1, which encodes an otubain- like protease with deubiquitination activity, influences grain size and shape in rice.Plant J, 91(5): 849-860. |
| [14] | Illa-Berenguer E, van Houten J, Huang Z, van der Knaap E.2015. Rapid and reliable identification of tomato fruit weight and locule number loci by QTL-seq.Theor Appl Genet, 128(7): 1329-1342. |
| [15] | Li D Y, Huang Z Y, Song S H, Xin Y Y, Mao D H, Lv Q M, Zhou M, Tian D M, Tang M F, Wu Q, Liu X, Chen T T, Song X W, Fu X Q, Zhao B R, Liang C Z, Li A H, Liu G Z, Li S G, Hu S N, Cao X F, Yu J, Yuan L P, Chen C Y, Zhu L H.2016. Integrated analysis of phenome, genome, and transcriptome of hybrid rice uncovered multiple heterosis-related loci for yield increase.Proc Natl Acad Sci USA, 113: 6026-6035. |
| [16] | Li H, Durbin R.2009. Fast and accurate short read alignment with Burrows-Wheeler transform.Bioinformatics, 25: 1754-1760. |
| [17] | Li N, Li Y H.2016. Signaling pathways of seed size control in plants.Curr Opin Plant Biol, 33: 23-32. |
| [18] | Lu H F, Lin T, Klein J, Wang S H, Qi J J, Zhou Q, Sun J J, Zhang Z H, Weng Y Q, Huang S W.2014. QTL-seq identifies an early flowering QTL located near flowering locusT in cucumber. Theor Appl Genet, 127(7): 1491-1499. |
| [19] | Lu X, Xiong Q, Cheng T, Li Q T, Liu X L, Bi Y D, Li W, Zhang W K, Ma B, Lai Y C, Du W G, Man W Q, Chen S Y, Zhang J S.2017. APP2C-1 allele underlying a quantitative trait locus enhances soybean 100-seed weight. Mol Plant, 10(5): 670-684. |
| [20] | Michelmore R W, Paran I, Kesseli R V.1991. Identification of markers linked to disease-resistance genes by bulked segregant analysis: A rapid method to detect markers in specific genomic regions by using segregating populations.Proc Natl Acad Sci USA, 88: 9828-9832. |
| [21] | Murray M G, Thompson W F.1980. Rapid isolation of high molecular weight plant DNA.Nucl Acids Res, 8: 4321-4325. |
| [22] | Ogiso-Tanaka E, Tanaka T, Tanaka K, Nonoue Y, Sasaki T, Fushimi E, Koide Y, Okumoto Y, Yano M, Saito H.2017. Detection of novel QTLs qDTH4.5 and qDTH6.3, which confer late heading under short-day conditions, by SSR marker-based and QTL-seq analysis. Breeding Sci, 67: 101-109. |
| [23] | Schneeberger K, Ossowski S, Lanz C, Juul T, Petersen A H, Nielsen K L, Jorgensen J E, Weigel D, Andersen S U.2009. SHOREmap: Simultaneous mapping and mutation identification by deep sequencing.Nat Methods, 6(8): 550-551. |
| [24] | Schneeberger K, Weigel D.2011. Fast-forward genetics enabled by new sequencing technologies.Trends Plant Sci, 16(5): 282-288. |
| [25] | Shao G N, Tang S Q, Luo J, Jiao G A, Wei X J, Tang A, Wu J L, Zhuang J Y, Hu P S.2010. Mapping ofqGL7-2, a grain length QTL on chromosome 7 of rice. J Genet Genom, 37(8): 523-531. |
| [26] | Song X J, Kuroha T, Ayano M, Furuta T, Nagai K, Komeda N, Segami S, Miura K, Ogawa D, Kamura T, Suzuki T, Higashiyama T, Yamasaki M, Mori H, Inukai Y, Wu J, Kitano H, Sakakibara H, Jacobsen S E, Ashikari M.2015. Rare allele of a previously unidentified histone H4 acetyltransferase enhances grain weight, yield, and plant biomass in rice.Proc Natl Acad Sci USA, 112(1): 76-81. |
| [27] | Sun X W, Liu D Y, Zhang X F, Li W B, Liu H, Hong W G, Jiang C B, Guan N, Ma C X, Zeng H P, Xu C H, Song J, Huang L, Wang C M, Shi J J, Wang R, Zheng X H, Lu C Y, Wang X W, Zheng H K.2013. SLAF-seq: An efficient method of large-scale de novo SNP discovery and genotyping using high-throughput sequencing. PLoS One, 8: e58700. |
| [28] | Takagi H, Abe A, Yoshida K, Kosugi S, Natsume S, Mitsuoka C, Uemura A, Utsushi H, Tamiru M, Takuno S, Innan H, Cano L M, Kamoun S, Terauchi R.2013. QTL-seq: Rapid mapping of quantitative trait loci in rice by whole genome resequencing of DNA from two bulked populations.Plant J, 74(1): 174-183. |
| [29] | Wang S S, Wu K, Qian Q, Liu Q, Li Q, Pan Y J, Ye Y F, Liu X Y, Wang J, Zhang J Q, Li S, Wu Y J, Fu X D.2017. Non-canonical regulation of SPL transcription factors by a human OTUB1-like deubiquitinase defines a new plant type rice associated with higher grain yield. Cell Res, 27: 1142-1156. |
| [30] | Wang Y X, Xiong G S, Hu J, Jiang L, Yu H, Xu J, Fang Y X, Zeng L J, Xu E, Xu J, Ye W J, Meng X B, Liu R F, Chen H Q, Jing Y H, Wang Y H, Zhu X D, Li J Y, Qian Q.2015. Copy number variation at the GL7 locus contributes to grain size diversity in rice. Nat Genet, 47: 944-948. |
| [31] | Yamanaka N, Watanabe S, Toda K, Hayashi M, Fuchigami H, Takahashi R, Harada K.2005. Fine mapping of the FT1 locus for soybean flowering time using a residual heterozygous line derived from a recombinant inbred line. Theor Appl Genet, 110(4): 634-639. |
| [32] | Yan W H, Wang P, Chen H X, Zhou H J, Li Q P, Wang C R, Ding Z H, Zhang Y S, Yu S B, Xing Y Z, Zhang Q F.2011. A major QTL,Ghd8, plays pleiotropic roles in regulating grain productivity, plant height, and heading date in rice. Mol Plant, 4: 319-330. |
| [33] | Yi C D, Wang D R, Jiang W, Li W, Cheng X J, Wang Y, Zhou Y, Liang G H, Gu M H.2016. Development of functional markers and identification of haplotypes for rice grain width gene GS5. Chin J Rice Sci, 30(5): 487-492. (in Chinese with English abstract) |
| [34] | Ying J Z, Shan J X, Gao J P, Zhu M Z, Shi M, Lin H X.2012. Identification of quantitative trait loci for lipid metabolism in rice seeds.Mol Plant, 5(4): 865-875. |
| [35] | Yoon D B, Kang K H, Kim H J, Ju H G, Kwon S J, Suh J P, Jeong O Y, Ahn S N.2006. Mapping quantitative trait loci for yield components and morphological traits in an advanced backcross population between Oryza grandiglumis and the O. sativa japonica cultivar Hwaseongbyeo. Theor Appl Genet, 112: 1052-1062. |
| [36] | Yu J P, Xiong H Y, Zhu X Y, Zhang H L, Li H H, Miao J L, Wang W S, Tang Z S, Zhang Z Y, Yao G X, Zhang Q, Pan Y H, Wang X, Rashid M A R, Li J J, Gao Y M, Li Z K, Yang W C, Fu X D, Li Z C.2017. OsLG3 contributing to rice grain length and yield was mined by Ho-LAMap.BMC Biol, 15: 28. |
| [37] | Zhang Y, Luo L J, Xu C, Zhang Q F, Xing Y Z.2006. Quantitative trait loci for panicle size, heading date and plant height co- segregating in trait-performance derived near-isogenic lines of rice (Oryza sativa). Theor Appl Genet, 113(2): 361-368. |
| [38] | Zuo J R, Li J Y.2014. Molecular genetic dissection of quantitative trait loci regulating rice grain size.Annu Rev Genet, 48: 99-118. |
| No related articles found! |
| 阅读次数 | ||||||
|
全文 |
|
|||||
|
摘要 |
|
|||||