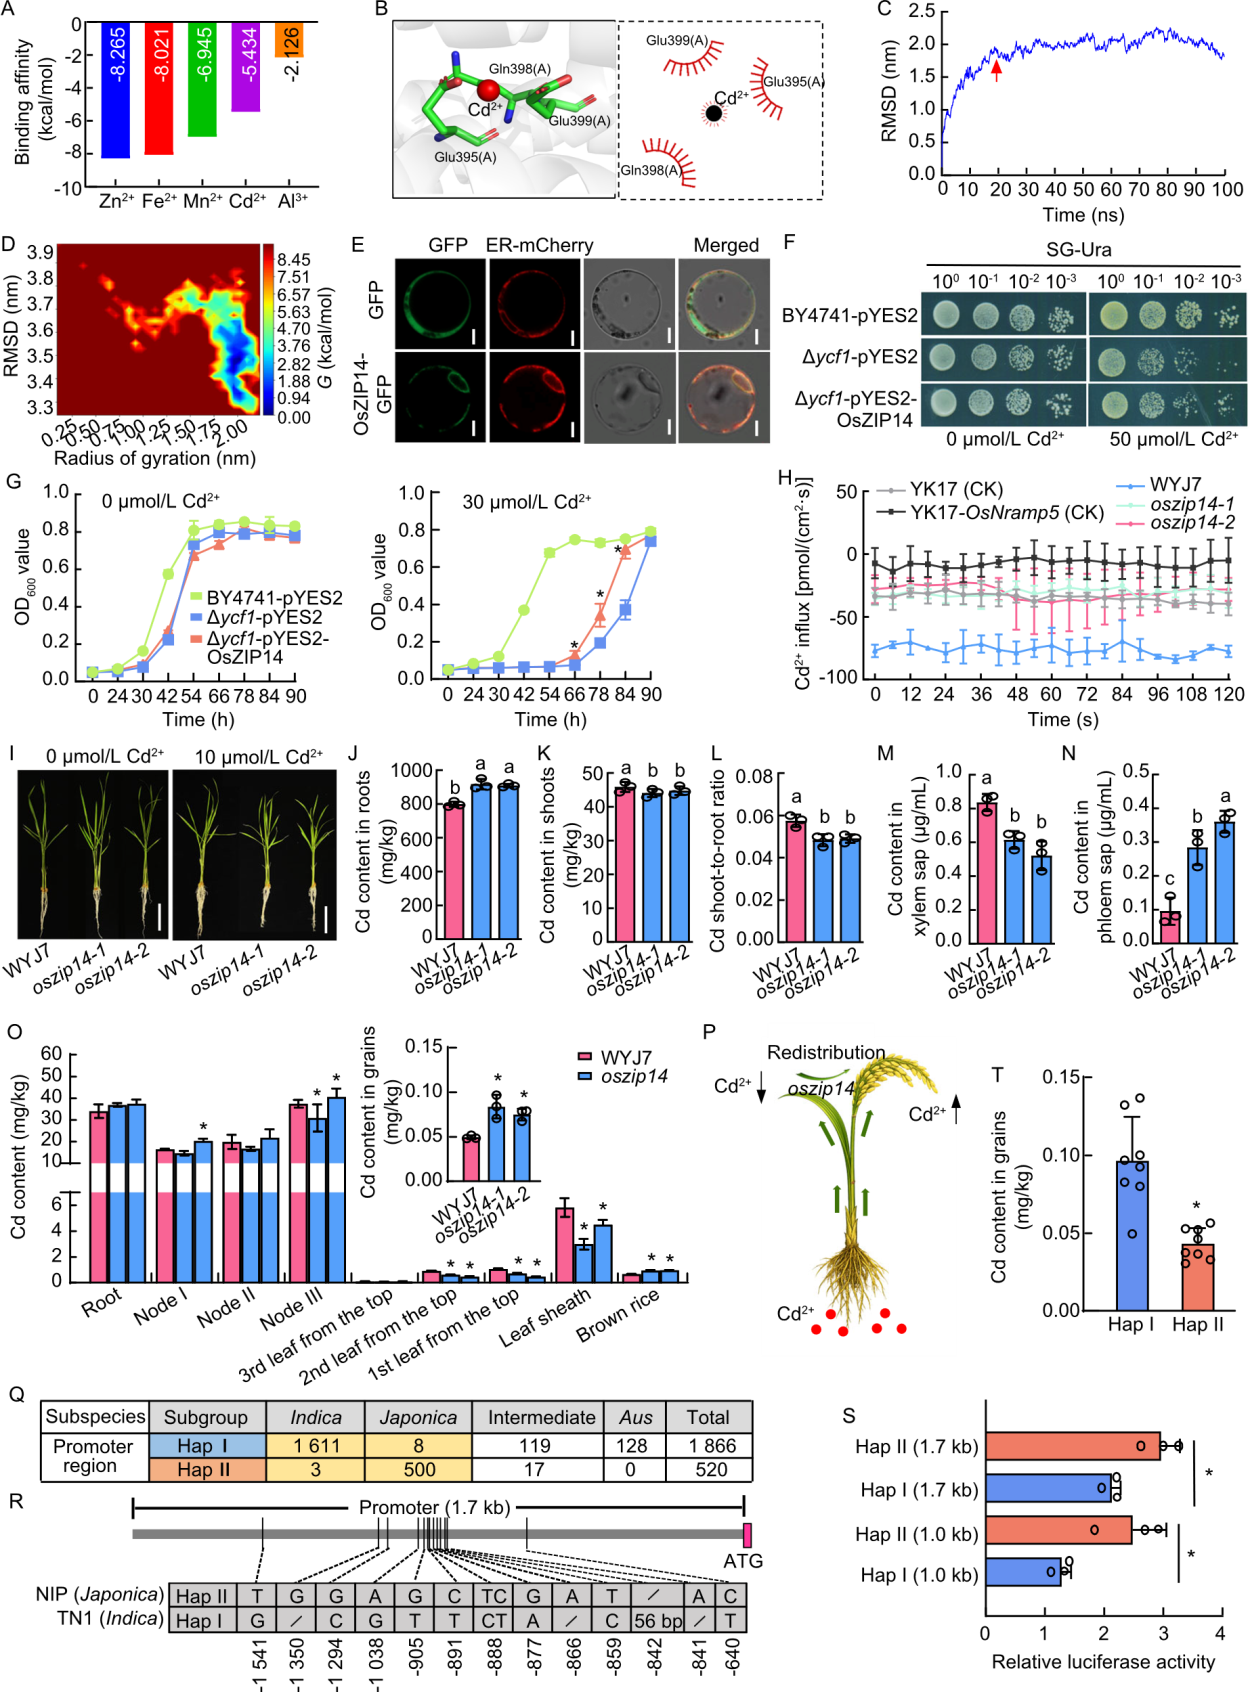
Fig. 1. OsZIP14 controls cadmium (Cd) accumulation in rice. A, Zn2+, Fe²⁺, Mn2+, Cd2+, and Al3+ ions were separately docked into the OsZIP14 protein structure using AutoDock 4. Binding energy values of the top-ranked docking conformations for each ion are shown. B, PyMol-based visualization of the interaction interface between OsZIP14 and Cd2+. Hydrophobic interactions at the Cd2+-OsZIP14 protein interface were mediated by the residues Glu(395), Gln(398), and Glu(399). ‘(A)’ denotes chain A of OsZIP14. C, RMSD (root mean square deviation) analysis of OsZIP14-Cd2+ complex during molecular dynamics simulation. The red arrow indicates the RMSD value reached stability after 20 ns. D, Gibbs energy landscape of OsZIP14-Cd2+ complex. Low-energy basins (blue regions) represent stable conformational states of the complex. E, Subcellular localization of OsZIP14. Free green fluorescent protein (GFP) and fusion protein (OsZIP14-GFP) were transiently expressed in rice protoplasts. OsZIP14-GFP colocalized with endoplasmic reticulum (ER)-mCherry. Scale bars, 2 μm. F, Wild-type (BY4741) and Δycf1 mutant yeasts transformed with pYES2 (empty vector) or pYES2-OsZIP14 were grown on synthetic galactose (SG) agar medium without uracil (SG-Ura) supplemented with 0 and 50 μmol/L Cd2+ for 4 d. G, Saccharomyces cerevisiae transformants of BY4741-pYES2, Δycf1-pYES2, and Δycf1-pYES2-OsZIP14 grown in SG-Ura liquid medium treated with 0 and 30 μmol/L CdCl2 for 90 h. The initial OD600 was 0.01, and measurements were taken at 0, 24, 30, 42, 54, 66, 78, 84, and 90 h. H, Non-invasive micro-test technique (NMT) was used to measure the instantaneous Cd2+ fluxes at the root surfaces of rice variety Wuyunjing 7 (WYJ7, wild type) and oszip14 mutant (oszip14-1 and oszip14-2) plants under 100 μmol/L Cd2+. YK17 and YK17-OsNramp5 (+1T, 269-aa premature) were used as controls. Data are presented as mean ± SD (n = 3). I, Phenotype comparison of WYJ7 and oszip14 mutant lines with 10 μmol/L Cd2+ treatment at the 12-d hydroponic seedlings. Scale bars, 5 cm. J‒L, Cd contents in roots (J) and shoots (K), and shoot/root ratio of Cd content (L) of WYJ7 and oszip14 mutant lines under 10 μmol/L Cd2+ treatment. M and N, Cd contents in xylem sap (M) and phloem sap (N) of WYJ7 and oszip14 mutant lines. Rice plants at the booting stage in the field were used for sampling. O, Cd contents in different tissues of wild type WYJ7 and two independent OsZIP14 knockout lines. Plants were grown in Cd-contaminated soils until maturity and Cd contents in different tissues were determined. The upper right figure represents Cd content in rice grains under normal paddy field conditions. P, Proposed mechanistic model for OsZIP14-mediated regulation of Cd accumulation in rice grains. Q, Haplotype (Hap) analysis of OsZIP14 based on single nucleotide polymorphisms (SNPs) with a major allele frequency more than 5% in the 1.7-kb promoter region. R, Sequence identification of the promoter regions of representative varieties for the two OsZIP14 haplotypes. S, Relative luciferase activities expressed under the control of OsZIP14 promoters from two representative rice accessions. NIP, Nipponbare. T, Cd content in grains of eight Hap I varieties (indica rice) and eight Hap II varieties (japonica rice). Data are presented as mean ± SD (n = 3 in G, J‒O, and S; n = 8 in T). * indicates significant difference at P ≤ 0.05 (Student’s t-test). Different lowercase letters above bars in J‒N indicate significant differences at P ≤ 0.05 according to one-way ANOVA and Tukey’s multiple comparison tests.
Fig. 1. OsZIP14 controls cadmium (Cd) accumulation in rice. A, Zn2+, Fe²⁺, Mn2+, Cd2+, and Al3+ ions were separately docked into the OsZIP14 protein structure using AutoDock 4. Binding energy values of the top-ranked docking conformations for each ion are shown. B, PyMol-based visualization of the interaction interface between OsZIP14 and Cd2+. Hydrophobic interactions at the Cd2+-OsZIP14 protein interface were mediated by the residues Glu(395), Gln(398), and Glu(399). ‘(A)’ denotes chain A of OsZIP14. C, RMSD (root mean square deviation) analysis of OsZIP14-Cd2+ complex during molecular dynamics simulation. The red arrow indicates the RMSD value reached stability after 20 ns. D, Gibbs energy landscape of OsZIP14-Cd2+ complex. Low-energy basins (blue regions) represent stable conformational states of the complex. E, Subcellular localization of OsZIP14. Free green fluorescent protein (GFP) and fusion protein (OsZIP14-GFP) were transiently expressed in rice protoplasts. OsZIP14-GFP colocalized with endoplasmic reticulum (ER)-mCherry. Scale bars, 2 μm. F, Wild-type (BY4741) and Δycf1 mutant yeasts transformed with pYES2 (empty vector) or pYES2-OsZIP14 were grown on synthetic galactose (SG) agar medium without uracil (SG-Ura) supplemented with 0 and 50 μmol/L Cd2+ for 4 d. G, Saccharomyces cerevisiae transformants of BY4741-pYES2, Δycf1-pYES2, and Δycf1-pYES2-OsZIP14 grown in SG-Ura liquid medium treated with 0 and 30 μmol/L CdCl2 for 90 h. The initial OD600 was 0.01, and measurements were taken at 0, 24, 30, 42, 54, 66, 78, 84, and 90 h. H, Non-invasive micro-test technique (NMT) was used to measure the instantaneous Cd2+ fluxes at the root surfaces of rice variety Wuyunjing 7 (WYJ7, wild type) and oszip14 mutant (oszip14-1 and oszip14-2) plants under 100 μmol/L Cd2+. YK17 and YK17-OsNramp5 (+1T, 269-aa premature) were used as controls. Data are presented as mean ± SD (n = 3). I, Phenotype comparison of WYJ7 and oszip14 mutant lines with 10 μmol/L Cd2+ treatment at the 12-d hydroponic seedlings. Scale bars, 5 cm. J‒L, Cd contents in roots (J) and shoots (K), and shoot/root ratio of Cd content (L) of WYJ7 and oszip14 mutant lines under 10 μmol/L Cd2+ treatment. M and N, Cd contents in xylem sap (M) and phloem sap (N) of WYJ7 and oszip14 mutant lines. Rice plants at the booting stage in the field were used for sampling. O, Cd contents in different tissues of wild type WYJ7 and two independent OsZIP14 knockout lines. Plants were grown in Cd-contaminated soils until maturity and Cd contents in different tissues were determined. The upper right figure represents Cd content in rice grains under normal paddy field conditions. P, Proposed mechanistic model for OsZIP14-mediated regulation of Cd accumulation in rice grains. Q, Haplotype (Hap) analysis of OsZIP14 based on single nucleotide polymorphisms (SNPs) with a major allele frequency more than 5% in the 1.7-kb promoter region. R, Sequence identification of the promoter regions of representative varieties for the two OsZIP14 haplotypes. S, Relative luciferase activities expressed under the control of OsZIP14 promoters from two representative rice accessions. NIP, Nipponbare. T, Cd content in grains of eight Hap I varieties (indica rice) and eight Hap II varieties (japonica rice). Data are presented as mean ± SD (n = 3 in G, J‒O, and S; n = 8 in T). * indicates significant difference at P ≤ 0.05 (Student’s t-test). Different lowercase letters above bars in J‒N indicate significant differences at P ≤ 0.05 according to one-way ANOVA and Tukey’s multiple comparison tests.

 ), Hu Shikai(