Rice Science ›› 2016, Vol. 23 ›› Issue (2): 78-87.DOI: 10.1016/j.rsci.2016.09.006
收稿日期:2015-05-10
接受日期:2015-09-14
出版日期:2016-04-10
发布日期:2015-12-31
. [J]. Rice Science, 2016, 23(2): 78-87.
| Treatment | Growth stage | ||
|---|---|---|---|
| Tillering | Heading | Maturity | |
| P (kg/hm2) | |||
| ########### | 2.8 c | 14.2 c | 12.5 c |
| ########### | 3.4 b | 17.7 b | 17.9 b |
| ########### | 3.7 a | 18.6 a | 19.4 a |
| ########### | 3.8 a | 18.5 ab | 19.4 a |
| LSD (P = 0.05) | 0.11 | 0.84 | 0.86 |
| Zn (kg/hm2) | |||
| ########### | 3.2 c | 16.7 c | 15.9 c |
| ########### | 3.4 b | 16.9 bc | 17.1 b |
| ########### | 3.6 a | 17.6 ab | 17.9 a |
| ########### | 3.6 a | 17.8 a | 18.2 a |
| LSD (P = 0.05) | 0.09 | 0.75 | 0.64 |
| Genotype (G) | |||
| Bamati-385 (Fine) | 3.1 c | 16.1 b | 16.4 b |
| F-Malakand (Coarse) | 3.3 b | 16.1 b | 16.5 b |
| Pukhraj (Coarse) | 3.9 a | 19.5 a | 18.9 a |
| LSD (P = 0.05) | 0.09 | 0.73 | 0.75 |
| Year (Mean) | |||
| 2011 | 3.2 b | 16.2 b | 16.9 a |
| 2012 | 3.7 a | 18.3 a | 17.6 a |
| Interaction | |||
| P × Zn | *** | ns | ns |
| P × Zn × G | *** | ns | ns |
Table 1 Culm dry matter at different growth stages of rice genotypes as affected by phosphorus (P) and zinc (Zn). G
| Treatment | Growth stage | ||
|---|---|---|---|
| Tillering | Heading | Maturity | |
| P (kg/hm2) | |||
| ########### | 2.8 c | 14.2 c | 12.5 c |
| ########### | 3.4 b | 17.7 b | 17.9 b |
| ########### | 3.7 a | 18.6 a | 19.4 a |
| ########### | 3.8 a | 18.5 ab | 19.4 a |
| LSD (P = 0.05) | 0.11 | 0.84 | 0.86 |
| Zn (kg/hm2) | |||
| ########### | 3.2 c | 16.7 c | 15.9 c |
| ########### | 3.4 b | 16.9 bc | 17.1 b |
| ########### | 3.6 a | 17.6 ab | 17.9 a |
| ########### | 3.6 a | 17.8 a | 18.2 a |
| LSD (P = 0.05) | 0.09 | 0.75 | 0.64 |
| Genotype (G) | |||
| Bamati-385 (Fine) | 3.1 c | 16.1 b | 16.4 b |
| F-Malakand (Coarse) | 3.3 b | 16.1 b | 16.5 b |
| Pukhraj (Coarse) | 3.9 a | 19.5 a | 18.9 a |
| LSD (P = 0.05) | 0.09 | 0.73 | 0.75 |
| Year (Mean) | |||
| 2011 | 3.2 b | 16.2 b | 16.9 a |
| 2012 | 3.7 a | 18.3 a | 17.6 a |
| Interaction | |||
| P × Zn | *** | ns | ns |
| P × Zn × G | *** | ns | ns |
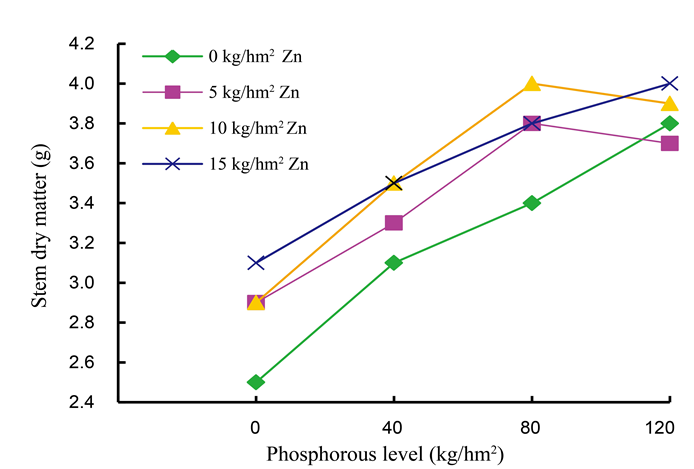
Fig. 1. Clum dry matter at rice tillering stage as affected by phosphorus and zinc (P × Zn) interaction.
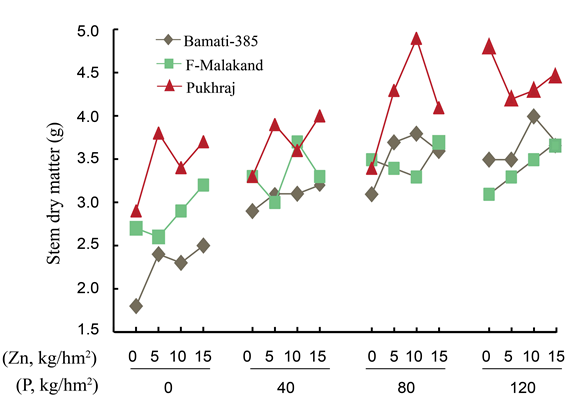
Fig. 2. Clum dry matter at rice tillering stage as affected by phosphorus, zinc and genotype (P × Zn × G) interaction.
| Treatment | Growth stage | ||
|---|---|---|---|
| Tillering | Heading | Maturity | |
| P (kg/hm2) | |||
| ########### | 4.3 d | 19.0 c | 19.2 c |
| ########### | 5.0 c | 23.3 b | 23.5 b |
| ########### | 5.6 b | 24.6 a | 25.1 a |
| ########### | 5.8 a | 24.7 a | 25.3 a |
| LSD (P = 0.05) | 0.17 | 0.57 | 0.83 |
| Zn (kg/hm2) | |||
| ########### | 4.8 c | 22.3 b | 21.9 c |
| ########### | 5.1 b | 22.8 ab | 23.1 b |
| ########### | 5.4 a | 23.3 a | 23.7 ab |
| ########### | 5.4 a | 23.2 a | 24.3 a |
| LSD (P = 0.05) | 0.14 | 0.56 | 0.78 |
| Genotype (G) | |||
| Bamati-385 (Fine) | 4.7 c | 21.0 c | 22.0 b |
| F-Malakand (Coarse) | 4.9 b | 23.3 b | 22.7 b |
| Pukhraj (Coarse) | 5.9 a | 24.5 a | 25.0 a |
| LSD (P = 0.05) | 0.14 | 0.49 | 0.72 |
| Year (Mean) | |||
| 2011 | 4.8 b | 20.8 b | 21.9 b |
| 2012 | 5.5 b | 25.0 a | 24.6 a |
| Interaction | |||
| P × Zn | *** | ns | ns |
| P × Zn × G | *** | ** | ns |
Table 2 Leaf dry matter at different growth stages of rice genotypes as affected by phosphorus (P) and zinc (Zn). G
| Treatment | Growth stage | ||
|---|---|---|---|
| Tillering | Heading | Maturity | |
| P (kg/hm2) | |||
| ########### | 4.3 d | 19.0 c | 19.2 c |
| ########### | 5.0 c | 23.3 b | 23.5 b |
| ########### | 5.6 b | 24.6 a | 25.1 a |
| ########### | 5.8 a | 24.7 a | 25.3 a |
| LSD (P = 0.05) | 0.17 | 0.57 | 0.83 |
| Zn (kg/hm2) | |||
| ########### | 4.8 c | 22.3 b | 21.9 c |
| ########### | 5.1 b | 22.8 ab | 23.1 b |
| ########### | 5.4 a | 23.3 a | 23.7 ab |
| ########### | 5.4 a | 23.2 a | 24.3 a |
| LSD (P = 0.05) | 0.14 | 0.56 | 0.78 |
| Genotype (G) | |||
| Bamati-385 (Fine) | 4.7 c | 21.0 c | 22.0 b |
| F-Malakand (Coarse) | 4.9 b | 23.3 b | 22.7 b |
| Pukhraj (Coarse) | 5.9 a | 24.5 a | 25.0 a |
| LSD (P = 0.05) | 0.14 | 0.49 | 0.72 |
| Year (Mean) | |||
| 2011 | 4.8 b | 20.8 b | 21.9 b |
| 2012 | 5.5 b | 25.0 a | 24.6 a |
| Interaction | |||
| P × Zn | *** | ns | ns |
| P × Zn × G | *** | ** | ns |
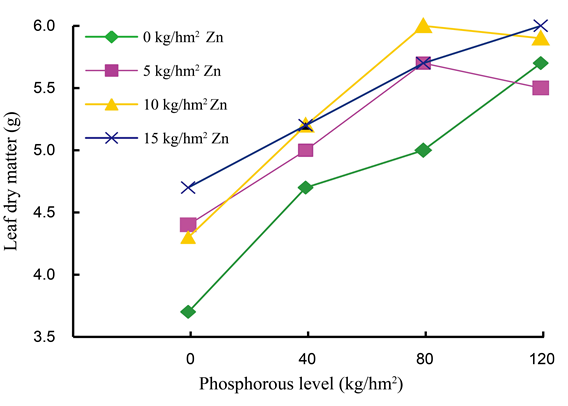
Fig. 3. Leaf dry matter at rice tillering stage as affected by phosphorus and zinc (P × Zn) interaction.
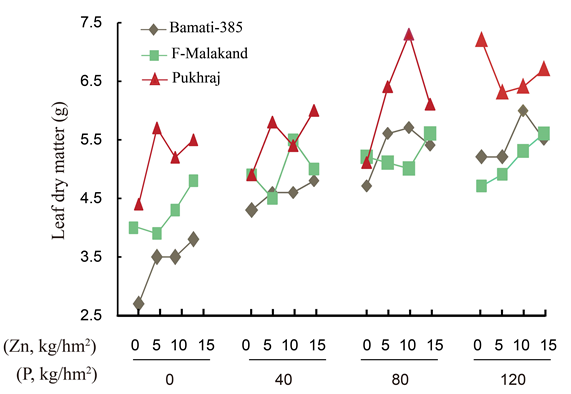
Fig. 4. Leaf dry matter at rice tillering stage as affected by phosphorus, zinc and genotype (P × Zn × G) interaction.
| Treatment | Growth stage | |
|---|---|---|
| Heading | Maturity | |
| P (kg/hm2) | ||
| ########### | 18.2 d | 31.4 d |
| ########### | 24.7 c | 43.8 c |
| ########### | 30.2 b | 48.5 b |
| ########### | 33.3 a | 51.7 a |
| LSD (P = 0.05) | 0.94 | 1.96 |
| Zn (kg/hm2) | ||
| ########### | 24.5 d | 40.5 c |
| ########### | 26.1 c | 42.7 b |
| ########### | 27.6 b | 45.1 a |
| ########### | 28.4 a | 47.2 a |
| LSD (P = 0.05) | 0.66 | 2.26 |
| Genotype (G) | ||
| Bamati-385 (Fine) | 18.2 c | 29.2 c |
| F-Malakand (Coarse) | 25.7 b | 41.9 b |
| Pukhraj (Coarse) | 35.9 a | 60.5 a |
| LSD (P = 0.05) | 0.81 | 1.7 |
| Year (Mean) | ||
| 2011 | 24.2 b | 39.6 b |
| 2012 | 29.1 a | 48.1 a |
| Interaction | ||
| P × Zn | ns | ns |
| P × Zn × G | *** | ns |
Table 3 Panicle dry matter at different growth stages of rice genotypes as affected by phosphorus (P) and zinc (Zn). G
| Treatment | Growth stage | |
|---|---|---|
| Heading | Maturity | |
| P (kg/hm2) | ||
| ########### | 18.2 d | 31.4 d |
| ########### | 24.7 c | 43.8 c |
| ########### | 30.2 b | 48.5 b |
| ########### | 33.3 a | 51.7 a |
| LSD (P = 0.05) | 0.94 | 1.96 |
| Zn (kg/hm2) | ||
| ########### | 24.5 d | 40.5 c |
| ########### | 26.1 c | 42.7 b |
| ########### | 27.6 b | 45.1 a |
| ########### | 28.4 a | 47.2 a |
| LSD (P = 0.05) | 0.66 | 2.26 |
| Genotype (G) | ||
| Bamati-385 (Fine) | 18.2 c | 29.2 c |
| F-Malakand (Coarse) | 25.7 b | 41.9 b |
| Pukhraj (Coarse) | 35.9 a | 60.5 a |
| LSD (P = 0.05) | 0.81 | 1.7 |
| Year (Mean) | ||
| 2011 | 24.2 b | 39.6 b |
| 2012 | 29.1 a | 48.1 a |
| Interaction | ||
| P × Zn | ns | ns |
| P × Zn × G | *** | ns |
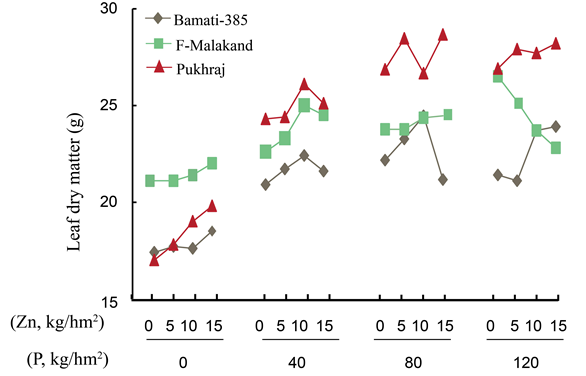
Fig. 5. Leaf dry matter at rice heading stage as affected by phosphorus, zinc and genotype (P × Zn × G) interaction.
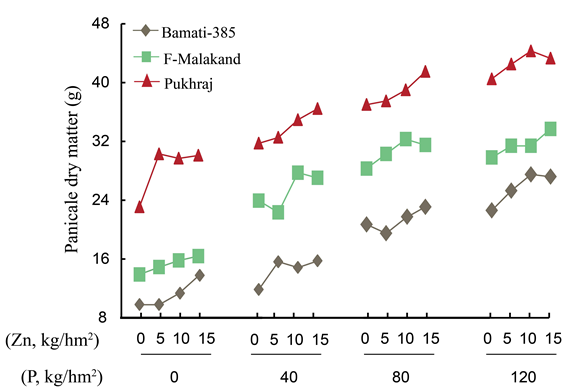
Fig. 6. Panicle dry matter at rice heading stage as affected by phosphorus, zinc and genotype (P × Zn × G) interaction.
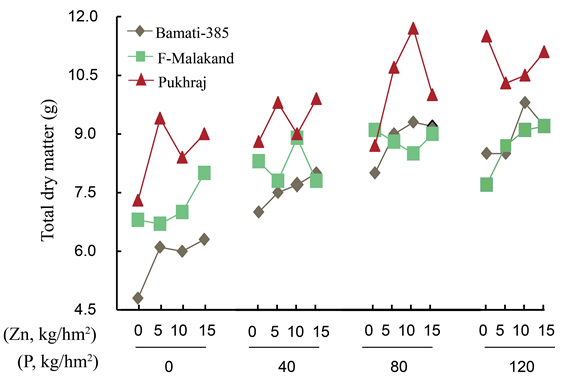
Fig. 7. Total dry matter at rice tillering stage as affected by phosphorus, zinc and genotype (P × Zn × G) interaction.
| Treatment | Growth stage | ||
|---|---|---|---|
| Tillering | Heading | Maturity | |
| P (kg/hm2) | |||
| ########### | 7.2 c | 51.4 d | 63.1 d |
| ########### | 8.4 b | 65.8 c | 85.2 c |
| ########### | 9.3 a | 73.3 b | 93.0 b |
| ########### | 9.5 a | 76.2 a | 96.4 a |
| LSD (P = 0.05) | 0.44 | 1.64 | 2.86 |
| Zn (kg/hm2) | |||
| ########### | 8.0 b | 63.1 c | 78.3 d |
| ########### | 8.6 a | 65.7 b | 82.9 c |
| ########### | 8.8 a | 68.5 a | 86.8 b |
| ########### | 8.9 a | 69.4 a | 89.7 a |
| LSD (P = 0.05) | 0.32 | 1.32 | 2.68 |
| Genotype (G) | |||
| Bamati-385 (Fine) | 7.8 c | 55.3 c | 67.6 c |
| F-Malakand (Coarse) | 8.2 b | 64.8 b | 81.1 b |
| Pukhraj (Coarse) | 9.8 a | 80.0 a | 104.5 a |
| LSD (P = 0.05) | 0.38 | 1.42 | 2.47 |
| Year (Mean) | |||
| 2011 | 8.0 b | 61.0 b | 78.4 b |
| 2012 | 9.2 a | 72.3 a | 90.4 a |
| Interaction | |||
| P × Zn | ns | ns | ns |
| P × Zn × G | *** | ns | ns |
Table 4 Total dry matter accumulation at different growth stages of rice genotypes as affected by phosphorus (P) and zinc (Zn). G
| Treatment | Growth stage | ||
|---|---|---|---|
| Tillering | Heading | Maturity | |
| P (kg/hm2) | |||
| ########### | 7.2 c | 51.4 d | 63.1 d |
| ########### | 8.4 b | 65.8 c | 85.2 c |
| ########### | 9.3 a | 73.3 b | 93.0 b |
| ########### | 9.5 a | 76.2 a | 96.4 a |
| LSD (P = 0.05) | 0.44 | 1.64 | 2.86 |
| Zn (kg/hm2) | |||
| ########### | 8.0 b | 63.1 c | 78.3 d |
| ########### | 8.6 a | 65.7 b | 82.9 c |
| ########### | 8.8 a | 68.5 a | 86.8 b |
| ########### | 8.9 a | 69.4 a | 89.7 a |
| LSD (P = 0.05) | 0.32 | 1.32 | 2.68 |
| Genotype (G) | |||
| Bamati-385 (Fine) | 7.8 c | 55.3 c | 67.6 c |
| F-Malakand (Coarse) | 8.2 b | 64.8 b | 81.1 b |
| Pukhraj (Coarse) | 9.8 a | 80.0 a | 104.5 a |
| LSD (P = 0.05) | 0.38 | 1.42 | 2.47 |
| Year (Mean) | |||
| 2011 | 8.0 b | 61.0 b | 78.4 b |
| 2012 | 9.2 a | 72.3 a | 90.4 a |
| Interaction | |||
| P × Zn | ns | ns | ns |
| P × Zn × G | *** | ns | ns |
| Treatment | Tillering | Heading | Maturity | ||||||
|---|---|---|---|---|---|---|---|---|---|
| Culm | Leaf | Panicle | Culm | Leaf | Panicle | Culm | Leaf | Panicle | |
| P (kg/hm2) | |||||||||
| 0 | 39 | 61 | - | 28 | 37 | 35 | 20 | 30 | 50 |
| 40 | 40 | 60 | - | 27 | 35 | 38 | 21 | 28 | 51 |
| 80 | 40 | 60 | - | 25 | 34 | 41 | 21 | 27 | 52 |
| 120 | 40 | 60 | - | 24 | 32 | 44 | 20 | 26 | 54 |
| Zn (kg/hm2) | |||||||||
| 0 | 40 | 60 | 26 | 35 | 39 | 20 | 28 | 52 | |
| 5 | 40 | 60 | 26 | 35 | 40 | 21 | 28 | 52 | |
| 10 | 40 | 60 | 26 | 34 | 40 | 21 | 27 | 52 | |
| 15 | 40 | 60 | 26 | 33 | 41 | 20 | 27 | 53 | |
| Genotype (G) | |||||||||
| Bamati-385 | 40 | 60 | 29 | 38 | 33 | 24 | 33 | 43 | |
| F-Malakand | 40 | 60 | 25 | 36 | 39 | 20 | 28 | 52 | |
| Pukhraj | 40 | 60 | 24 | 31 | 45 | 18 | 24 | 58 | |
Table 5 Percent of dry matter partitioning into culm, leaf and panicle at tillering, heading and physiological maturity in rice genotypes as affected by phosphorus (P) and zinc (Zn). %
| Treatment | Tillering | Heading | Maturity | ||||||
|---|---|---|---|---|---|---|---|---|---|
| Culm | Leaf | Panicle | Culm | Leaf | Panicle | Culm | Leaf | Panicle | |
| P (kg/hm2) | |||||||||
| 0 | 39 | 61 | - | 28 | 37 | 35 | 20 | 30 | 50 |
| 40 | 40 | 60 | - | 27 | 35 | 38 | 21 | 28 | 51 |
| 80 | 40 | 60 | - | 25 | 34 | 41 | 21 | 27 | 52 |
| 120 | 40 | 60 | - | 24 | 32 | 44 | 20 | 26 | 54 |
| Zn (kg/hm2) | |||||||||
| 0 | 40 | 60 | 26 | 35 | 39 | 20 | 28 | 52 | |
| 5 | 40 | 60 | 26 | 35 | 40 | 21 | 28 | 52 | |
| 10 | 40 | 60 | 26 | 34 | 40 | 21 | 27 | 52 | |
| 15 | 40 | 60 | 26 | 33 | 41 | 20 | 27 | 53 | |
| Genotype (G) | |||||||||
| Bamati-385 | 40 | 60 | 29 | 38 | 33 | 24 | 33 | 43 | |
| F-Malakand | 40 | 60 | 25 | 36 | 39 | 20 | 28 | 52 | |
| Pukhraj | 40 | 60 | 24 | 31 | 45 | 18 | 24 | 58 | |
| Treatment | Year | Mean | |
|---|---|---|---|
| 2011 | 2012 | ||
| P (kg/hm2) | |||
| ########### | 36 | 36.7 | 36.4 c |
| ########### | 37.3 | 41.3 | 39.3 b |
| ########### | 40.2 | 41.7 | 41.0 a |
| ########### | 39.8 | 43 | 41.4 a |
| LSD (P = 0.05) | 1.69 | 1.72 | 1.18 |
| Zn (kg/hm2) | |||
| ########### | 37.9 | 38.7 | 38.3 b |
| ########### | 38.8 | 40.7 | 39.8 a |
| ########### | 38 | 41.5 | 39.8 a |
| ########### | 38.6 | 41.8 | 40.2 a |
| LSD (P = 0.05) | ns | 1.45 | 1.15 |
| Genotype (G) | |||
| Bamati-385 (fine) | 27.5 | 29.1 | 28.3 c |
| F-Malakand (coarse) | 41 | 45.2 | 43.1 b |
| Pukhraj (coarse) | 46.5 | 47.8 | 47.2 a |
| LSD (P = 0.05) | 1.46 | 1.5 | 1.02 |
| Year (Mean) | 38.3 b | 40.7 a | |
| Interaction | |||
| Zn × G | ns | ||
| P × Zn × G | ns | ||
Table 6 Harvest index of rice genotypes as affected by phosphorus (P) and zinc (Zn). %
| Treatment | Year | Mean | |
|---|---|---|---|
| 2011 | 2012 | ||
| P (kg/hm2) | |||
| ########### | 36 | 36.7 | 36.4 c |
| ########### | 37.3 | 41.3 | 39.3 b |
| ########### | 40.2 | 41.7 | 41.0 a |
| ########### | 39.8 | 43 | 41.4 a |
| LSD (P = 0.05) | 1.69 | 1.72 | 1.18 |
| Zn (kg/hm2) | |||
| ########### | 37.9 | 38.7 | 38.3 b |
| ########### | 38.8 | 40.7 | 39.8 a |
| ########### | 38 | 41.5 | 39.8 a |
| ########### | 38.6 | 41.8 | 40.2 a |
| LSD (P = 0.05) | ns | 1.45 | 1.15 |
| Genotype (G) | |||
| Bamati-385 (fine) | 27.5 | 29.1 | 28.3 c |
| F-Malakand (coarse) | 41 | 45.2 | 43.1 b |
| Pukhraj (coarse) | 46.5 | 47.8 | 47.2 a |
| LSD (P = 0.05) | 1.46 | 1.5 | 1.02 |
| Year (Mean) | 38.3 b | 40.7 a | |
| Interaction | |||
| Zn × G | ns | ||
| P × Zn × G | ns | ||
| [1] | Akita S.1989. Improving yield potential in tropical rice. In: Progress in Irrigated Rice Research. Manila, the Philippines, International Rice Research Institute: 41-73. |
| [2] | Akinrinde E A, Gaizer T.2006. Differences in the performance and phosphorus-use efficiency of some tropical rice (Oryza sativa L.) varieties. Pak J Nutr, 5(3): 206-211. |
| [3] | Alloway B J.2009. Soil factors associated with zinc deficiency in crops and humans. Environ Geochem Health, 31(5): 537-548. |
| [4] | Alam M M, Ali M H, Hasanuzzaman M, Nahar K, Islam M R.2009. Dry matter partitioning in hybrid and inbred rice varieties under variable doses of phosphorus. Int J Sust Agric, 1(1): 10-19. |
| [5] | Amano T, Zhu Q, Wang Y, Inoue N, Tanaka H.1993. Case studies on high yields of paddy rice in Jiangsu Province China: I. Characteristics of grain production. Jpn J Crop Sci, 62(2): 267-274. |
| [6] | Amanullah K, Hidayat R, Shah Z, Shah P.2008. Effects of plant density and N on growth dynamics and light interception in maize. Arch Agron Soil Sci, 54: 401-411. |
| [7] | Amanullah, Khan M W.2010. Interactive effects of potassium and phosphorus application on phenology and grain yield of sunflower in Northwest Pakistan. Pedosphere, 20(5): 674-680. |
| [8] | Cakmak I.2000. Tansley review No.111. possible roles of zinc in protecting plant cells from damage by reactive oxygen species. New Phytol, 146: 185-205. |
| [9] | Confalonieri R, Bocchi S.2005. Evaluation of cropsyst for simulating the yield of flooded rice in northern Italy. Eur J Agron, 23(5): 315-332. |
| [10] | Das K, Dang R, Shivananda T N, Sur P.2005. Interaction between phosphorus and zinc on the biomass yield and yield attributes of the medicinal plant stevia (Stevia rebaudiana). Sci World J, 5: 390-395. |
| [11] | Donalad C M, Hamblin J.1976. The biological yield and harvest index of cereals as agronomic and plant breeding criteria. Adv Agron, 28: 361-405. |
| [12] | Epstein E, Bloom A J.2005. Mineral Nutrition of Plants: Principles and Perspectives. Sunderland, MA: Sinauer Associates, Inc. Publishers. |
| [13] | Evans L T.1975. The physiological basis of crop yield. In: Evans L T. Crop Physiolog, London: Cambridge University Press. |
| [14] | Fageria N K, Oliveira I P, Dutra L G.1996. Nutrient Deficiencies in Common Bean Crop and Their Correction. Goiania, Brazil: 65. |
| [15] | Fageria N K, Slaton N A, Baligar V C.2003. Nutrient management for improving lowland rice productivity and sustainability. Adv Agron, 80: 63-152. |
| [16] | Fageria N K, Baligar V C.2005. Nutrient availability. In: Hillel D. Encyclopedia of Soils in the Environment. San Diego, California, Elsevier: 63-71. |
| [17] | Fageria N K, Filho M P B.2007. Dry‐matter and grain yield, nutrient uptake, and phosphorus use‐efficiency of lowland rice as influenced by phosphorus fertilization. Comm Soil Sci Plant Anal, 38: 1289-1297. |
| [18] | Fageria N K, Dos Santos A B, Heinemann A B.2011a. Lowland rice genotypes evaluation for phosphorus use efficiency in tropical lowland. J Plant Nutr, 34(8): 1087-1095. |
| [19] | Fageria N K, Dos Santos A B, Cobucci T.2011b. Zinc nutrition of lowland rice. Comm Soil Sci Plant Anal, 42: 1719-1727. |
| [20] | Foy C D.1992. Soil chemical factors limiting plant root growth. Adv Soil Sci, 19: 97-149. |
| [21] | Haldar M, Mandal L N.1981. Effect of phosphorus and zinc on the growth and phosphorus, zinc, copper, iron and manganese nutrition of rice. Plant Soil, 59(3): 415-425. |
| [22] | Hasegawa H.2003. High yielding rice cultivars perform best even at reduced nitrogen fertilizer rate. Crop Sci, 43: 921-926. |
| [23] | IRRI.1995. Rice Facts. Los Baños, the Philippines, International Rice Research Institute. |
| [24] | Ismail A M, Heuer S, Thomson M J, Wissuwa M.2007. Genetic and genomic approaches to develop rice germplasm for problem soils. Plant Mol Biol, 65(4): 547-570. |
| [25] | Khan P, Memon M Y, Imtiaz M, Depar N, Aslam M, Memon M S, Shah J A.2012. Determining the zinc requirements of rice genotype sarshar evolved at NIA Tandojam. Sarh J Agric, 28(1): 1-7. |
| [26] | Khorgamy A, Farnia A.2009. Effect of phosphorus and zinc fertilization on yield and yield components of chick pea cultivars. Afr Crop Sci Conf Proc, 9: 205-208. |
| [27] | Kiniry J R, Mc-Cauley G, Xie Y, Arnold J G.2001. Rice parameters describing crop performance of four rice cultivars. Agron J, 93: 1354-1361. |
| [28] | Lafarge T, Bueno C S.2009. Higher crop performance of rice hybrids than of elite inbreds in the tropics: 2. Does sink regulation, rather than sink size, play a major role. Field Crop Res, 112: 238-244. |
| [29] | Lal B, Majumdar B, Venkatesh M S.2000. Individual and interactive effects of phosphorus and zinc in lowland rice. Ind J Hill Farm, 13: 44-46. |
| [30] | Mae T.1997. Physiological nitrogen efficiency in rice: Nitrogen utilization, photosynthesis, and yield potential. Plant Soil, 196: 201-210. |
| [31] | Mafi S, Sadeghi S M, Doroodian H.2013. Effect of zinc and phosphorus fertilizers on yield and component yield of rice (Hashemi). Pers Gulf Crop Prot, 2: 30-36. |
| [32] | Marschner H.2002. Mineral Nutrition of Higher Plants. 2nd ed. San Diego, CA: Academic Press. |
| [33] | Peng S, Cassman K G, Virmani S S, Sheehy J, Khush G S.1999. Yield potential trends of tropical rice since the release of IR8 and the challenge of increasing rice yield potential. Crop Sci, 39: 1552-1559. |
| [34] | Qadar A.2002. Selecting rice genotypes tolerant to zinc deficiency and sodicity stresses: I. Differences in zinc, iron, manganese, copper, phosphorus concentrations, and phosphorus/zinc ratio in their leaves. J Plant Nutr, 25(3): 457-473. |
| [35] | Quijano-Guerta C, Kirk G J D, Portugal A M, Bartolome V I, McLaren G C.2002. Tolerance of rice germplasm to zinc deficiency. Field Crop Res, 76(2): 123-130. |
| [36] | Rahman K M M, Chowdhury M A K, Sharmeen F, Sarkar A, Hye M A, Biswas G C.2011. Effect of zinc and phosphorus on yield of Oryza sativa (cv. br-11). Bang Res Pub J, 5(4): 351-358. |
| [37] | Rose T J, Impa S M, Rose M T, Pariasca-Tanaka J, Mori A, Heuer S, Johnson-Beebout S E, Wissuwa M.2013. Enhancing phosphorus and zinc acquisition efficiency in rice: A critical review of root traits and their potential utility in rice breeding. Ann Bot, 112(2): 331-345. |
| [38] | Salimpour S, Khavazi K, Nadian H, Besharati H, Miransari H.2010. Enhancing phosphorous availability to canola (Brassica napus L.) using P solubilizing and sulfur oxidizing bacteria. Aust J Crop Sci, 4(5): 330-334. |
| [39] | Sharma A P, Singh S P.1994. Genotypic variation in photosynthesis and yield components in rice. Ind J Plant Physiol, 37: 188-189. |
| [40] | Sinclair T R.1998. Historical changes in harvest index and crop nitrogen accumulation. Crop Sci, 38: 638-643. |
| [41] | Singh B, Natesan S K A, Singh B K, Usha K.2005. Improving zinc efficiency of cereals under zinc deficiency. Curr Sci, 88(1): 36-44. |
| [42] | Song X F, Agata W, Kawamitsu Y.1990. Studies on dry matter and grain production of F1 hybrid rice in China: I. Characteristic of dry matter production. Jpn J Crop Sci, 59: 19-28. |
| [43] | Steel R G D, Torrie J H, Dickey D.1996. Principles and Procedures of Statistics. McGraw-Hill, USA. |
| [44] | Surek H, Korkut K Z.1998. Diallel analysis of some quantitative characters in F1 and F2 generations in rice (Oryza sativa L.). Egypt J Agric Res, 76: 651-662. |
| [45] | Swaminathan M S.2007. Can science and technology feed the world in 2025? Field Crop Res, 104(1): 3-9. |
| [46] | Tahir M, Kausar M A, Ahmad R, Bhatti A S.1991. Micronutrient status of Faisalabad and Sheikhupura soils. Pak J Agric Res, 12: 134-140. |
| [47] | Taniyama T, Subbaiah S V, Rao M L N, Ikeda K.1988. Cultivation and ecophysiology of rice plants in the tropics: III. Photosynthesis of rice cultivars in India. Jpn J Crop Sci, 56: 226-231. |
| [48] | Weng J H, Chen C Y.1984. Photosynthetic characteristics, dry matter production and grain yield of the first and the second rice crops in Taiwan. Wufeng, Taichung, Taiwan: Taiwan Agricultural Research Institute: 153-164. |
| [49] | Wiangsamut B, Lafarge T A, Mendoza T C, Pasuquin E M.2013. Agronomic traits and yield components associated with broadcasted and transplanted high-yielding rice genotypes. eSci J Crop Prod, 2(1): 19-30. |
| [50] | Wu G, Wilson L T, McClung A M.1998. Contribution of rice tillers to dry matter accumulation and yield. Agron J, 90(3): 317-323. |
| [51] | Yadi R, Dastan S, Yasari E.2012. Role of zinc fertilizer on grain yield and some qualities parameters in Iranian rice genotypes. Ann Biol, 3: 4519-4527. |
| [52] | Yamauchi M.1994. Physiological bases of higher yield potential in F1 hybrids. In: Virmani S S. Hybrid Rice Technology: New Developments and Future Prospects. Los Baños, the Philippines: International Rice Research Institute: 71-80. |
| [53] | Ying J F, Peng S B, He Q R, Yang H, Yang C D, Visperas R M, Cassman K G.1998. Comparison of high-yield rice in tropical and subtropical environments: I. Determinants of grain and dry matter yields. Field Crop Res, 57(1): 71-84. |
| No related articles found! |
| 阅读次数 | ||||||
|
全文 |
|
|||||
|
摘要 |
|
|||||