Rice Science ›› 2019, Vol. 26 ›› Issue (4): 239-247.DOI: 10.1016/j.rsci.2019.01.004
收稿日期:2018-11-14
接受日期:2019-01-14
出版日期:2019-07-28
发布日期:2019-04-04
. [J]. Rice Science, 2019, 26(4): 239-247.
| No. | Genotypes | Eco Types | Tolerance to stresses | Other information |
| 1 | Swarna sub1 | Shallow low land | Tolerant to submergence and susceptible to drought | Popular variety |
| 2 | IR64 sub1 | Irrigated | Tolerant to Submergence and susceptible to drought | - |
| 3 | FR13A | Shallow low land | Tolerant to Submergence and susceptible to drought | International submergence tolerance donor |
| 4 | CR143-2-2 | Upland | Drought Tolerance | Drought tolerant check |
| 5 | N 22 | Upland | Drought Tolerance | Drought and heat stress check |
| 6 | Brahamanakhi | Upland/Medium land | Drought Tolerance | Landrace |
| 7 | Satyabhama | Upland | Drought Tolerance | Released variety |
| 8 | IR 20 | Irrigated | Drought susceptible | International Check |
| 9 | Nerica1 | Upland/ Aerobic | Drought Tolerance | Suitable for Africa |
| 10 | Azucena | Upland | Drought Tolerance | Tropical japonica |
| 11 | Curinga | Upland | Drought Tolerance | Tropical japonica |
| 12 | MER20 | Upland | Drought Tolerance | CSSLs/BC4F4 of O. meridionalis/ Curinga |
| 13 | RUF44 | Upland | Drought Tolerance | CSSLs /BC4F4 of O. rufipogon/ Curinga |
| 14 | RUF16 | Upland | Drought Tolerance | CSSLs /BC4F4 of O. rufipogon/ Curinga |
| 15 | RUF48 | Upland | Drought Tolerance | CSSLs /BC4F4 of O. rufipogon/ Curinga |
| 16 | RUF13 | Upland | Drought Tolerance | CSSLs /BC4F4 of O. rufipogon/ Curinga |
Supplemental Table 1 The list of drought tolerant and susceptible rice genotypes used for the assessment of genetic diversity.
| No. | Genotypes | Eco Types | Tolerance to stresses | Other information |
| 1 | Swarna sub1 | Shallow low land | Tolerant to submergence and susceptible to drought | Popular variety |
| 2 | IR64 sub1 | Irrigated | Tolerant to Submergence and susceptible to drought | - |
| 3 | FR13A | Shallow low land | Tolerant to Submergence and susceptible to drought | International submergence tolerance donor |
| 4 | CR143-2-2 | Upland | Drought Tolerance | Drought tolerant check |
| 5 | N 22 | Upland | Drought Tolerance | Drought and heat stress check |
| 6 | Brahamanakhi | Upland/Medium land | Drought Tolerance | Landrace |
| 7 | Satyabhama | Upland | Drought Tolerance | Released variety |
| 8 | IR 20 | Irrigated | Drought susceptible | International Check |
| 9 | Nerica1 | Upland/ Aerobic | Drought Tolerance | Suitable for Africa |
| 10 | Azucena | Upland | Drought Tolerance | Tropical japonica |
| 11 | Curinga | Upland | Drought Tolerance | Tropical japonica |
| 12 | MER20 | Upland | Drought Tolerance | CSSLs/BC4F4 of O. meridionalis/ Curinga |
| 13 | RUF44 | Upland | Drought Tolerance | CSSLs /BC4F4 of O. rufipogon/ Curinga |
| 14 | RUF16 | Upland | Drought Tolerance | CSSLs /BC4F4 of O. rufipogon/ Curinga |
| 15 | RUF48 | Upland | Drought Tolerance | CSSLs /BC4F4 of O. rufipogon/ Curinga |
| 16 | RUF13 | Upland | Drought Tolerance | CSSLs /BC4F4 of O. rufipogon/ Curinga |
| Marker | Na | Np | Nu | Fla | Fha | PIC | Marker | Na | Np | Nu | Fla | Fha | PIC |
| RM315 | 2 | 2 | 0 | 1 | 1 | 0.49 | RM596 | 1 | 0 | 0 | 0 | 1 | 0.00 |
| RM472 | 2 | 2 | 1 | 0 | 1 | 0.12 | RM512 | 1 | 0 | 0 | 0 | 1 | 0.00 |
| RM302 | 1 | 0 | 0 | 0 | 1 | 0.00 | RM179 | 1 | 0 | 0 | 0 | 1 | 0.00 |
| RM431 | 2 | 2 | 0 | 1 | 1 | 0.34 | RM277 | 1 | 0 | 0 | 0 | 2 | 0.75 |
| RM212 | 2 | 2 | 0 | 0 | 2 | 0.75 | RM313 | 1 | 0 | 0 | 0 | 1 | 0.00 |
| RM543 | 2 | 2 | 0 | 0 | 2 | 0.68 | RM83 | 1 | 0 | 0 | 0 | 1 | 0.00 |
| RM259 | 2 | 2 | 0 | 1 | 1 | 0.53 | RM101 | 2 | 2 | 0 | 1 | 1 | 0.53 |
| RM488 | 2 | 2 | 1 | 0 | 1 | 0.12 | RM309 | 2 | 2 | 0 | 0 | 2 | 0.75 |
| RM521 | 2 | 2 | 0 | 0 | 2 | 0.75 | RM28130 | 1 | 0 | 0 | 0 | 1 | 0.00 |
| RM526 | 2 | 2 | 0 | 0 | 2 | 0.75 | RM28050 | 1 | 0 | 0 | 0 | 1 | 0.00 |
| RM555 | 1 | 0 | 0 | 0 | 1 | 0.00 | RM28089 | 2 | 2 | 1 | 0 | 1 | 1.00 |
| RM530 | 2 | 2 | 0 | 1 | 1 | 0.96 | RM244 | 1 | 0 | 0 | 0 | 1 | 0.00 |
| RM279 | 3 | 3 | 0 | 2 | 1 | 0.98 | RM28067 | 1 | 0 | 0 | 0 | 1 | 0.00 |
| RM416 | 1 | 0 | 0 | 0 | 1 | 0.00 | RM28088 | 1 | 0 | 0 | 0 | 1 | 0.00 |
| RM22 | 2 | 2 | 0 | 1 | 1 | 0.96 | RM28099 | 1 | 0 | 0 | 0 | 1 | 0.00 |
| RM16030 | 2 | 2 | 0 | 1 | 1 | 0.90 | RM28078 | 1 | 0 | 0 | 0 | 1 | 0.00 |
| RM60 | 1 | 0 | 0 | 0 | 1 | 0.00 | RM3349 | 1 | 0 | 0 | 0 | 1 | 0.00 |
| RM15780 | 1 | 0 | 0 | 0 | 1 | 0.00 | RM28079 | 2 | 2 | 0 | 1 | 1 | 0.96 |
| RM537 | 2 | 2 | 1 | 0 | 1 | 0.12 | RM28082 | 1 | 0 | 0 | 0 | 1 | 0.00 |
| RM252 | 3 | 3 | 0 | 0 | 3 | 0.86 | RM28048 | 2 | 2 | 0 | 0 | 2 | 0.75 |
| RM136 | 1 | 0 | 0 | 0 | 1 | 0.00 | RM28069 | 1 | 0 | 0 | 0 | 1 | 0.00 |
| RM527 | 1 | 0 | 0 | 0 | 1 | 0.00 | RM28088 | 1 | 0 | 0 | 0 | 1 | 0.00 |
| RM528 | 1 | 0 | 0 | 0 | 1 | 0.00 | RM1261 | 2 | 2 | 0 | 1 | 1 | 0.96 |
| RM5371 | 1 | 0 | 0 | 0 | 1 | 0.00 | RM28075 | 1 | 0 | 0 | 0 | 1 | 0.00 |
| RM541 | 2 | 2 | 1 | 0 | 1 | 1.00 | RM28051 | 1 | 0 | 0 | 0 | 1 | 0.00 |
| RM276 | 3 | 3 | 1 | 0 | 2 | 1.00 | RM28050 | 1 | 0 | 0 | 0 | 1 | 0.00 |
| RM210 | 3 | 3 | 0 | 1 | 2 | 0.34 | RM12091 | 2 | 2 | 0 | 1 | 1 | 0.23 |
| RM339 | 1 | 0 | 0 | 0 | 1 | 0.00 | RM28090 | 1 | 0 | 0 | 0 | 1 | 0.00 |
| RM337 | 2 | 2 | 0 | 0 | 2 | 0.61 | RM28059 | 1 | 0 | 0 | 0 | 1 | 0.00 |
| RM25 | 1 | 0 | 0 | 0 | 1 | 0.00 | RM28095 | 1 | 0 | 0 | 0 | 1 | 0.00 |
| RM464 | 2 | 2 | 0 | 0 | 2 | 0.00 | Total | 95 | 60 | 6 | 13 | 77 | 41.76 |
| RM566 | 2 | 2 | 0 | 0 | 2 | 0.81 | Mean | 1.5 | 1.0 | 0.1 | 0.2 | 1.2 | 0.66 |
| RM24390 | 1 | 0 | 0 | 0 | 1 | 0.00 |
Table 1 Number of alleles (Na), number of polymorphic alleles (Np), unique allele (Nu), low-frequency allele (Fla), high-frequency allele (Fha) and polymorphism information content (PIC) for 63 simple sequence repeats (SSRs) in 16 rice genotypes.
| Marker | Na | Np | Nu | Fla | Fha | PIC | Marker | Na | Np | Nu | Fla | Fha | PIC |
| RM315 | 2 | 2 | 0 | 1 | 1 | 0.49 | RM596 | 1 | 0 | 0 | 0 | 1 | 0.00 |
| RM472 | 2 | 2 | 1 | 0 | 1 | 0.12 | RM512 | 1 | 0 | 0 | 0 | 1 | 0.00 |
| RM302 | 1 | 0 | 0 | 0 | 1 | 0.00 | RM179 | 1 | 0 | 0 | 0 | 1 | 0.00 |
| RM431 | 2 | 2 | 0 | 1 | 1 | 0.34 | RM277 | 1 | 0 | 0 | 0 | 2 | 0.75 |
| RM212 | 2 | 2 | 0 | 0 | 2 | 0.75 | RM313 | 1 | 0 | 0 | 0 | 1 | 0.00 |
| RM543 | 2 | 2 | 0 | 0 | 2 | 0.68 | RM83 | 1 | 0 | 0 | 0 | 1 | 0.00 |
| RM259 | 2 | 2 | 0 | 1 | 1 | 0.53 | RM101 | 2 | 2 | 0 | 1 | 1 | 0.53 |
| RM488 | 2 | 2 | 1 | 0 | 1 | 0.12 | RM309 | 2 | 2 | 0 | 0 | 2 | 0.75 |
| RM521 | 2 | 2 | 0 | 0 | 2 | 0.75 | RM28130 | 1 | 0 | 0 | 0 | 1 | 0.00 |
| RM526 | 2 | 2 | 0 | 0 | 2 | 0.75 | RM28050 | 1 | 0 | 0 | 0 | 1 | 0.00 |
| RM555 | 1 | 0 | 0 | 0 | 1 | 0.00 | RM28089 | 2 | 2 | 1 | 0 | 1 | 1.00 |
| RM530 | 2 | 2 | 0 | 1 | 1 | 0.96 | RM244 | 1 | 0 | 0 | 0 | 1 | 0.00 |
| RM279 | 3 | 3 | 0 | 2 | 1 | 0.98 | RM28067 | 1 | 0 | 0 | 0 | 1 | 0.00 |
| RM416 | 1 | 0 | 0 | 0 | 1 | 0.00 | RM28088 | 1 | 0 | 0 | 0 | 1 | 0.00 |
| RM22 | 2 | 2 | 0 | 1 | 1 | 0.96 | RM28099 | 1 | 0 | 0 | 0 | 1 | 0.00 |
| RM16030 | 2 | 2 | 0 | 1 | 1 | 0.90 | RM28078 | 1 | 0 | 0 | 0 | 1 | 0.00 |
| RM60 | 1 | 0 | 0 | 0 | 1 | 0.00 | RM3349 | 1 | 0 | 0 | 0 | 1 | 0.00 |
| RM15780 | 1 | 0 | 0 | 0 | 1 | 0.00 | RM28079 | 2 | 2 | 0 | 1 | 1 | 0.96 |
| RM537 | 2 | 2 | 1 | 0 | 1 | 0.12 | RM28082 | 1 | 0 | 0 | 0 | 1 | 0.00 |
| RM252 | 3 | 3 | 0 | 0 | 3 | 0.86 | RM28048 | 2 | 2 | 0 | 0 | 2 | 0.75 |
| RM136 | 1 | 0 | 0 | 0 | 1 | 0.00 | RM28069 | 1 | 0 | 0 | 0 | 1 | 0.00 |
| RM527 | 1 | 0 | 0 | 0 | 1 | 0.00 | RM28088 | 1 | 0 | 0 | 0 | 1 | 0.00 |
| RM528 | 1 | 0 | 0 | 0 | 1 | 0.00 | RM1261 | 2 | 2 | 0 | 1 | 1 | 0.96 |
| RM5371 | 1 | 0 | 0 | 0 | 1 | 0.00 | RM28075 | 1 | 0 | 0 | 0 | 1 | 0.00 |
| RM541 | 2 | 2 | 1 | 0 | 1 | 1.00 | RM28051 | 1 | 0 | 0 | 0 | 1 | 0.00 |
| RM276 | 3 | 3 | 1 | 0 | 2 | 1.00 | RM28050 | 1 | 0 | 0 | 0 | 1 | 0.00 |
| RM210 | 3 | 3 | 0 | 1 | 2 | 0.34 | RM12091 | 2 | 2 | 0 | 1 | 1 | 0.23 |
| RM339 | 1 | 0 | 0 | 0 | 1 | 0.00 | RM28090 | 1 | 0 | 0 | 0 | 1 | 0.00 |
| RM337 | 2 | 2 | 0 | 0 | 2 | 0.61 | RM28059 | 1 | 0 | 0 | 0 | 1 | 0.00 |
| RM25 | 1 | 0 | 0 | 0 | 1 | 0.00 | RM28095 | 1 | 0 | 0 | 0 | 1 | 0.00 |
| RM464 | 2 | 2 | 0 | 0 | 2 | 0.00 | Total | 95 | 60 | 6 | 13 | 77 | 41.76 |
| RM566 | 2 | 2 | 0 | 0 | 2 | 0.81 | Mean | 1.5 | 1.0 | 0.1 | 0.2 | 1.2 | 0.66 |
| RM24390 | 1 | 0 | 0 | 0 | 1 | 0.00 |
| Microsatellite marker | Amp. range (bp) | Markers positions (cM) | Chr. | QTLs | Reference |
| RM315 | 120-133 | 165.0 | 1 | qDTY1.1 | Dixit et al, 2012 |
| RM472 | 296-300 | 168.2-172.0 | 1 | qDTY1.1 | Venuprasad et al, 2012 |
| RM431 | 296-250 | 178.3 | 1 | qDTY1.1 | Gimhani et al, 2016; Vikram et al, 2011; Kumar et al, 2014 |
| RM212 | 136-150 | 163.1 | 1 | qDTY1.1 | Vikram et al, 2011 |
| RM488 | 177-200 | 101 | 1 | qDTY1.1 | Kumar et al, 2014 |
| RM555 | 223 | 20.3 | 2 | qDTY2.2 | Kumar et al, 2014 |
| RM279 | 140-174 | 134 | 2 | qDTY2.2 | Sandhu et al, 2018 |
| RM60 | 165 | - | 3 | qDTF3.2 | Vikram et al, 2011; Awasthi, 2014 |
| RM22 | 180-194 | 7.2 | 3 | qDTF3.2 | Vikram et al, 2011; Awasthi, 2014 |
| RM541 | 150-158 | 75.5 | 6 | qDTY 6.2 | Dixit et al, 2012 |
| RM28048 | 80-93 | - | 12 | qDTY12.1 | Awasthi, 2014;Bernier et al, 2009 |
| RM1261 | 160-167 | 61.6 | 12 | qDTY12.1 | Dixit et al, 2012 |
Supplemental Table 2 List of microsatellite markers associated with drought-tolerant QTLs used for assessment of genetic diversity study.
| Microsatellite marker | Amp. range (bp) | Markers positions (cM) | Chr. | QTLs | Reference |
| RM315 | 120-133 | 165.0 | 1 | qDTY1.1 | Dixit et al, 2012 |
| RM472 | 296-300 | 168.2-172.0 | 1 | qDTY1.1 | Venuprasad et al, 2012 |
| RM431 | 296-250 | 178.3 | 1 | qDTY1.1 | Gimhani et al, 2016; Vikram et al, 2011; Kumar et al, 2014 |
| RM212 | 136-150 | 163.1 | 1 | qDTY1.1 | Vikram et al, 2011 |
| RM488 | 177-200 | 101 | 1 | qDTY1.1 | Kumar et al, 2014 |
| RM555 | 223 | 20.3 | 2 | qDTY2.2 | Kumar et al, 2014 |
| RM279 | 140-174 | 134 | 2 | qDTY2.2 | Sandhu et al, 2018 |
| RM60 | 165 | - | 3 | qDTF3.2 | Vikram et al, 2011; Awasthi, 2014 |
| RM22 | 180-194 | 7.2 | 3 | qDTF3.2 | Vikram et al, 2011; Awasthi, 2014 |
| RM541 | 150-158 | 75.5 | 6 | qDTY 6.2 | Dixit et al, 2012 |
| RM28048 | 80-93 | - | 12 | qDTY12.1 | Awasthi, 2014;Bernier et al, 2009 |
| RM1261 | 160-167 | 61.6 | 12 | qDTY12.1 | Dixit et al, 2012 |
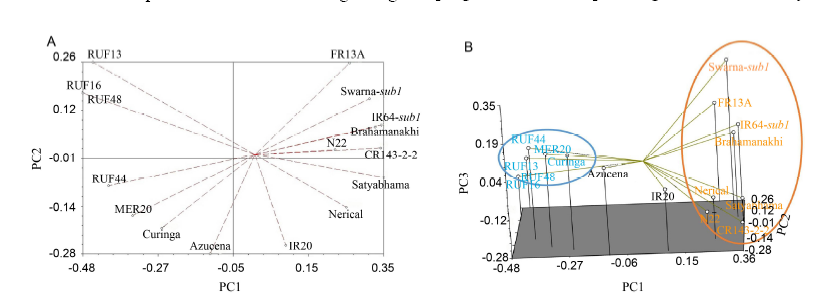
Fig. 1. Two-dimensional plot (A) and three-dimensional plot (B) from the principal component analysis (PCA) for 16 rice genotypes based on 63 simple sequence repeat markers.
| Genotype | Swarna-sub1 | IR64-sub1 | FR13A | CR143-2-2 | Bra | Sat | N22 | Nerical | IR20 | Azucena | Curinga | MER20 | RUF44 | RUF16 | RUF48 |
| IR64-sub1 | 0.85 | ||||||||||||||
| FR13A | 0.79 | 0.80 | |||||||||||||
| CR143-2-2 | 0.73 | 0.83 | 0.75 | ||||||||||||
| Bra | 0.77 | 0.78 | 0.75 | 0.78 | |||||||||||
| Sat | 0.79 | 0.90 | 0.78 | 0.93 | 0.82 | ||||||||||
| N22 | 0.72 | 0.77 | 0.81 | 0.85 | 0.75 | 0.86 | |||||||||
| Nerical | 0.78 | 0.84 | 0.77 | 0.86 | 0.81 | 0.93 | 0.87 | ||||||||
| IR20 | 0.73 | 0.74 | 0.68 | 0.76 | 0.73 | 0.82 | 0.77 | 0.83 | |||||||
| Azucena | 0.68 | 0.71 | 0.65 | 0.68 | 0.66 | 0.74 | 0.72 | 0.81 | 0.83 | ||||||
| Curinga | 0.65 | 0.68 | 0.66 | 0.65 | 0.63 | 0.71 | 0.73 | 0.76 | 0.76 | 0.86 | |||||
| MER20 | 0.61 | 0.64 | 0.63 | 0.62 | 0.62 | 0.67 | 0.69 | 0.73 | 0.75 | 0.84 | 0.96 | ||||
| RUF44 | 0.56 | 0.59 | 0.62 | 0.57 | 0.57 | 0.62 | 0.64 | 0.67 | 0.71 | 0.80 | 0.89 | 0.93 | |||
| RUF16 | 0.54 | 0.56 | 0.59 | 0.58 | 0.54 | 0.59 | 0.65 | 0.64 | 0.68 | 0.77 | 0.82 | 0.86 | 0.87 | ||
| RUF48 | 0.54 | 0.56 | 0.59 | 0.58 | 0.54 | 0.59 | 0.65 | 0.64 | 0.68 | 0.77 | 0.82 | 0.86 | 0.87 | 1.00 | |
| RUF13 | 0.56 | 0.57 | 0.58 | 0.57 | 0.55 | 0.58 | 0.62 | 0.61 | 0.65 | 0.73 | 0.78 | 0.82 | 0.83 | 0.96 | 0.96 |
| Bra, Brahamanakhi; Sat, Satyabhama. | |||||||||||||||
Table 2 Genetic similarity coefficient among 16 rice genotypes.
| Genotype | Swarna-sub1 | IR64-sub1 | FR13A | CR143-2-2 | Bra | Sat | N22 | Nerical | IR20 | Azucena | Curinga | MER20 | RUF44 | RUF16 | RUF48 |
| IR64-sub1 | 0.85 | ||||||||||||||
| FR13A | 0.79 | 0.80 | |||||||||||||
| CR143-2-2 | 0.73 | 0.83 | 0.75 | ||||||||||||
| Bra | 0.77 | 0.78 | 0.75 | 0.78 | |||||||||||
| Sat | 0.79 | 0.90 | 0.78 | 0.93 | 0.82 | ||||||||||
| N22 | 0.72 | 0.77 | 0.81 | 0.85 | 0.75 | 0.86 | |||||||||
| Nerical | 0.78 | 0.84 | 0.77 | 0.86 | 0.81 | 0.93 | 0.87 | ||||||||
| IR20 | 0.73 | 0.74 | 0.68 | 0.76 | 0.73 | 0.82 | 0.77 | 0.83 | |||||||
| Azucena | 0.68 | 0.71 | 0.65 | 0.68 | 0.66 | 0.74 | 0.72 | 0.81 | 0.83 | ||||||
| Curinga | 0.65 | 0.68 | 0.66 | 0.65 | 0.63 | 0.71 | 0.73 | 0.76 | 0.76 | 0.86 | |||||
| MER20 | 0.61 | 0.64 | 0.63 | 0.62 | 0.62 | 0.67 | 0.69 | 0.73 | 0.75 | 0.84 | 0.96 | ||||
| RUF44 | 0.56 | 0.59 | 0.62 | 0.57 | 0.57 | 0.62 | 0.64 | 0.67 | 0.71 | 0.80 | 0.89 | 0.93 | |||
| RUF16 | 0.54 | 0.56 | 0.59 | 0.58 | 0.54 | 0.59 | 0.65 | 0.64 | 0.68 | 0.77 | 0.82 | 0.86 | 0.87 | ||
| RUF48 | 0.54 | 0.56 | 0.59 | 0.58 | 0.54 | 0.59 | 0.65 | 0.64 | 0.68 | 0.77 | 0.82 | 0.86 | 0.87 | 1.00 | |
| RUF13 | 0.56 | 0.57 | 0.58 | 0.57 | 0.55 | 0.58 | 0.62 | 0.61 | 0.65 | 0.73 | 0.78 | 0.82 | 0.83 | 0.96 | 0.96 |
| Bra, Brahamanakhi; Sat, Satyabhama. | |||||||||||||||
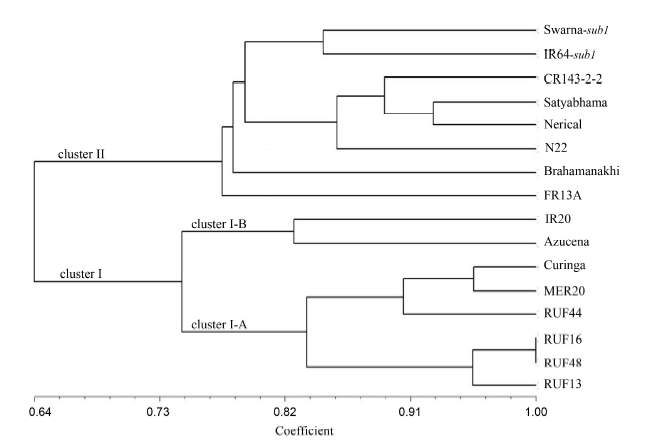
Fig. 2. Unweighted pair-group method with arithmetic means (UPGMA) dendrogram for 16 rice genotypes based on genetic similarity by 63 simple sequence repeat markers.
| [1] | Anandan A, Anumalla M, Pradhan S K, Ali J.2016. Population structure, diversity and trait association analysis in rice (Oryza sativa L.) germplasm for early seedling vigor (ESV) using trait linked SSR markers. PLoS One, 11(3): e0152406. |
| [2] | Anderson J A, Churchill G A, Autrique J E, Tanksley S D, Sorrells M E.1993. Optimizing parental selection for genetic linkage maps.Genome, 36(1): 181-186. |
| [3] | Arbelaez J D, Moreno L T, Singh N, Tung C W, Maron L G, Ospina Y, Martinez C P, Grenier C, Lorieux M, McCouch S.2015. Development and GBS-genotyping of introgression lines (ILs) using two wild species of rice,O. meridionalis and O. rufipogon, in a common recurrent parent, O. sativa cv. Curinga. Mol Breeding, 35: 81. |
| [4] | Barik M, Dash S K, Padhi S, Swain P.2017. Effect of drought on morpho-physiological, yield and yield traits of chromosome segment substitution lines (CSSLs) derived from wild species of rice.ORYZA-Int J Rice, 54(1): 65-72. |
| [5] | Behera L, Patra B C, Sahu R K, Nanda A, Sahu S C, Patnaik A, Rao G J N, Singh O N.2012. Assessment of genetic diversity in medicinal rices using microsatellite markers.Aust J Crop Sci, 6(9): 1369-1376. |
| [6] | Behera L, Mohanty S, Pradhan S, Singh S, Singh O, Sahu R, Sahu S, Dash S, Mohapatra T.2013. Assessment of genetic diversity of rainfed lowland rice genotypes using microsatellite markers.Indian J Genet, 73: 142-152. |
| [7] | Charcosset A, Moreau L.2004. Use of molecular markers for the development of new cultivars and the evaluation of genetic diversity.Euphytica, 137(1): 81-94. |
| [8] | Choudhary G, Ranjitkumar N, Surapaneni M, Deborah D A, Vipparla A, Anuradha G, Siddiq E A, Vemireddy L R.2013. Molecular genetic diversity of major Indian rice cultivars over decadal periods.PLoS One, 8(6): e66197. |
| [9] | Dellaporta S L, Wood J, Hicks J B.1983. A plant DNA minipreparation: Version II.Plant Mol Biol Rep, 1: 19-21. |
| [10] | Flint-Garcia S A, Thuillet A C, Yu J, Pressoir G, Romero S M, Mitchell S E, Doebley J, Kresovich S, Goodman M M, Buckler E S.2005. Maize association population: A high-resolution platform for quantitative trait locus dissection.Plant J, 44: 1054-1064. |
| [11] | Gaikwad K B, Singh N, Bhatia D, Kaur R, Bains N S, Bharaj T S, Singh K.2014. Yield-enhancing heterotic QTL transferred from wild species to cultivated riceOryza sativa L. PLoS One, 9(6): e96939. |
| [12] | Ganie S A, Borgohain M J, Kritika K, Talukdar A, Pani D R, Mondal T K.2016. Assessment of genetic diversity ofSaltol QTL among the rice(Oryza sativa L.) genotypes. Physiol Mol Biol Pla, 22(1): 107-114. |
| [13] | Gawenda I, Schrӧder-Lorenz A, Debener T.2012. Markers for ornamental traits inPhalaenopsis orchids: Population structure, linkage disequilibrium and association mapping. Mol Breeding, 30(1): 305-316. |
| [14] | Ismail A M, Singh U S, Singh S, Dar M H, Mackill D J.2013. The contribution of submergence-tolerant (sub1) rice varieties to food security in flood-prone rainfed lowland areas in Asia. Field Crops Res, 152: 83-93. |
| [15] | Jasim Aljumaili S, Rafii M Y, Latif M, Sakimin S Z, Arolu I W, Miah G.2018. Genetic diversity of aromatic rice germplasm revealed by SSR markers.BioMed Res Int, 2018: 1-11. |
| [16] | Khush G S.2005. What it will take to feed 5.0 billion rice consumers in 2030.Plant Mol Biol, 59: 1-6. |
| [17] | Kumbhar S D, Kulwal P L, Patil J V, Sarawate C D, Gaikwad A P, Jadhav A S.2015. Genetic diversity and population structure in landraces and improved rice varieties from India.Rice Sci, 22(3): 99-107. |
| [18] | Marathi B, Guleria S, Mohapatra T, Parsad R, Mariappan N, Kurungara V K, Atwal S S, Prabhu K V, Singh N K, Singh A K.2012. QTL analysis of novel genomic regions associated with yield and yield related traits in new plant type based recombinant inbred lines of rice (Oryza sativa L.). BMC Plant Boil, 12: 137. |
| [19] | Molden D, Oweis T, Steduto P, Bindraban P, Hanjra M A, Kijne J.2010. Improving agricultural water productivity: Between optimism and caution.Agr Water Manage, 97(4): 528-535. |
| [20] | Nachimuthu V V, Muthurajan R, Duraialaguraja S, Sivakami R, Pandian B A, Ponniah G, Gunasekaran K, Swaminathan M, Suji K K, Sabariappan R.2015. Analysis of population structure and genetic diversity in rice germplasm using SSR markers: An initiative towards association mapping of agronomic traits inOryza sativa. Rice, 8: 30. |
| [21] | Patel S, Ravikiran R, Chakraborty S, Macwana S, Sasidharan N, Trivadi R, Aher B.2014. Genetic diversity analysis of colored and white rice genotypes using microsatellite (SSR) and insertion-deletion (INDEL) markers.Emir J Food Agr, 26(6): 497-507. |
| [22] | Pradhan S K, Barik S R, Sahoo A, Mohapatra S, Nayak D K, Mahender A, Meher J, Anandan A, Pandit E.2016. Population structure, genetic diversity and molecular marker-trait association analysis for high temperature stress tolerance in rice.PLoS One, 11: e0160027. |
| [23] | Rohlf F J.1988. NTSYS-pc: Numerical Taxonomy and Multivariate Analysis System. Exeter Publishing. |
| [24] | Roy P S, Rao G J N, Jena S, Samal R, Patnaik A, Patnaik S S C, Jambhulkar N N, Sharma S, Mohapatra T.2016. Nuclear and chloroplast DNA variation provides insights into population structure and multiple origin of native aromatic rices of Odisha, India.PLoS One, 11(9): e0162268. |
| [25] | Roy S, Banerjee A, Mawkhlieng B, Misra1 A K, Pattanayak A, Harish G D, Singh S K, Ngachan S V, Bansal K C, 2015. Genetic diversity and population structure in aromatic and quality rice (Oryza sativa L.) landraces from North-Eastern India. PLoS One, 10: e0129607. |
| [26] | Saini N, Jain N, Jain S, Jain R K.2004. Assessment of genetic diversity within and among Basmati and non-Basmati rice varieties using AFLP, ISSR and SSR markers.Euphytica, 140(3): 133-146. |
| [27] | Sajib A M, Hossain M, Mosnaz A, Hossain H, Islam M, Ali M, Prodhan S H.2012. SSR marker-based molecular characterization and genetic diversity analysis of aromatic landreces of rice (Oryza sativa L.). J BioSci Biotechnol, 1: 107-116. |
| [28] | Septiningsih E M, Pamplona A M, Sanchez D L, Neeraja C N, Vergara G V, Heuer S, Ismail A M, Mackill D J.2009. Development of submergence-tolerant rice cultivars: Thesub1 locus and beyond. Ann Bot, 103(2): 151-160. |
| [29] | Shah S M, Arif M, Aslam K, Shabir G, Thomson M J.2016. Genetic diversity analysis of Pakistan rice (Oryza sativa) germplasm using multiplexed single nucleotide polymorphism markers. Genet Res Crop Ev, 63(7): 1113-1126. |
| [30] | Singh N, Dang T T M, Vergara G V, Pandey D M, Sanchez D, Neeraja C N, Septiningsih E M, Mendioro M, Tecson-Mendoza E M, Ismail A M, Mackill D J.2010. Molecular marker survey and expression analyses of the rice submergence-tolerance geneSUB1A. Theor Appl Genet, 121(8): 1441-1453. |
| [31] | Singh N, Choudhury D R, Tiwari G, Singh A K, Kumar S, Srinivasan K, Tyagi R K, Sharma A D, Singh N K, Singh R.2016. Genetic diversity trend in Indian rice varieties: An analysis using SSR markers.BMC Genet, 17: 127. |
| [32] | Sun J, Qian Q, Ma D R, Xu Z J, Liu D, Du H B, Chen W F.2013. Introgression and selection shaping the genome and adaptive loci of weedy rice in northern China.New Phytol, 197(1): 290-299. |
| [33] | Sweeney M, McCouch S.2007. The complex history of the domestication of rice.Ann Bot, 100(5): 951-957. |
| [34] | Tian F, Li D J, Fu Q, Zhu Z F, Fu Y C, Wang X K, Sun C Q.2006. Construction of introgression lines carrying wild rice (Oryza rufipogon Griff.) segments in cultivated rice(Oryza sativa L.) background and characterization of introgressed segments associated with yield-related traits. Theor Appl Genet, 112(3): 570-580. |
| [35] | Upadhyay P, Singh V K, Neeraja C.2011. Identification of genotype specific alleles and molecular diversity assessment of popular rice (Oryza sativa L.) varieties of India. Int J Plant Breeding Genet, 5(2): 130-140. |
| [36] | Varshney R K, Bansal K C, Aggarwal P K, Datta S K, Craufurd P Q.2011. Agricultural biotechnology for crop improvement in a variable climate: Hope or hype?Trends Plant Sci, 16(7): 363-371. |
| [37] | Venuprasad R, Bool M, Dalid C O, Bernier J, Kumar A, Atlin G N.2009a. Genetic loci responding to two cycles of divergent selection for grain yield under drought stress in a rice breeding population.Euphytica, 167(2): 261-269. |
| [38] | Venuprasad R, Dalid C O, Del Valle M, Zhao D, Espiritu M, Sta Cruz M T, Amante M, Kumar A, Atlin G N.2009b. Identification and characterization of large-effect quantitative trait loci for grain yield under lowland drought stress in rice using bulk-segregant analysis.Theor Appl Genet, 120(1): 177-190. |
| [39] | Venuprasad R, Bool M E, Quiatchon L, Sta Cruz M T, Amante M, Atlin G.2012. A large-effect QTL for rice grain yield under upland drought stress on chromosome 1.Mol Breeding, 30(1): 535-547. |
| [40] | Xu Q, Yuan X P, Wang S, Feng Y, Yu H Y, Wang Y P, Yang Y L, Wei X H, Li X M.2016. The genetic diversity and structure ofindica rice in China as detected by single nucleotide polymorphism analysis. BMC Genet, 17: 53. |
| [41] | Yang F, Chen Y L, Tong C, Huang Y, Xu F F, Li K H, Corke H, Sun M, Bao J S.2014. Association mapping of starch physicochemical properties with starch synthesis-related gene markers in nonwaxy rice (Oryza sativa L.). Mol Breeding, 34(4): 1747-1763. |
| [42] | Zhao Y L, Wang H M, Chen W, Li Y H.2014. Genetic structure, linkage disequilibrium and association mapping of Verticillium wilt resistance in elite cotton (Gossypium hirsutum L.) germplasm population. PLoS One, 9(1): e86308. |
| No related articles found! |
| 阅读次数 | ||||||
|
全文 |
|
|||||
|
摘要 |
|
|||||