Rice Science ›› 2025, Vol. 32 ›› Issue (5): 704-716.DOI: 10.1016/j.rsci.2025.06.009
收稿日期:2025-01-27
接受日期:2025-06-19
出版日期:2025-09-28
发布日期:2025-10-11
. [J]. Rice Science, 2025, 32(5): 704-716.
| Stress response | Score | Survival percentage in GUSa (%) | Plant height in GUSRa (cm) | Plant height in WDa (cm) | Recovery rate in SWDRa (%) | CSESa |
|---|---|---|---|---|---|---|
| Strongly tolerant | 1 | 100 (1) | 26-30 (2) | 26-30 (1) | 90-100 (19) | 0.2-2.0 (0) |
| Tolerant | 3 | 95-99 (0) | 21-25 (2) | 21-25 (4) | 70-89 (7) | 2.1-4.0 (0) |
| Moderately tolerant | 5 | 75-94 (15) | 16-20 (7) | 16-20 (14) | 40-69 (6) | 4.1-6.0 (17) |
| Sensitive | 7 | 50-74 (21) | 10-15 (22) | 10-15 (28) | 20-39 (9) | 6.1-8.0 (57) |
| Highly sensitive | 9 | 0-49 (93) | 0-9 (97) | 0-9 (83) | 0-19 (89) | 8.1-9.0 (56) |
Table 1. Consecutive stress evaluation method.
| Stress response | Score | Survival percentage in GUSa (%) | Plant height in GUSRa (cm) | Plant height in WDa (cm) | Recovery rate in SWDRa (%) | CSESa |
|---|---|---|---|---|---|---|
| Strongly tolerant | 1 | 100 (1) | 26-30 (2) | 26-30 (1) | 90-100 (19) | 0.2-2.0 (0) |
| Tolerant | 3 | 95-99 (0) | 21-25 (2) | 21-25 (4) | 70-89 (7) | 2.1-4.0 (0) |
| Moderately tolerant | 5 | 75-94 (15) | 16-20 (7) | 16-20 (14) | 40-69 (6) | 4.1-6.0 (17) |
| Sensitive | 7 | 50-74 (21) | 10-15 (22) | 10-15 (28) | 20-39 (9) | 6.1-8.0 (57) |
| Highly sensitive | 9 | 0-49 (93) | 0-9 (97) | 0-9 (83) | 0-19 (89) | 8.1-9.0 (56) |
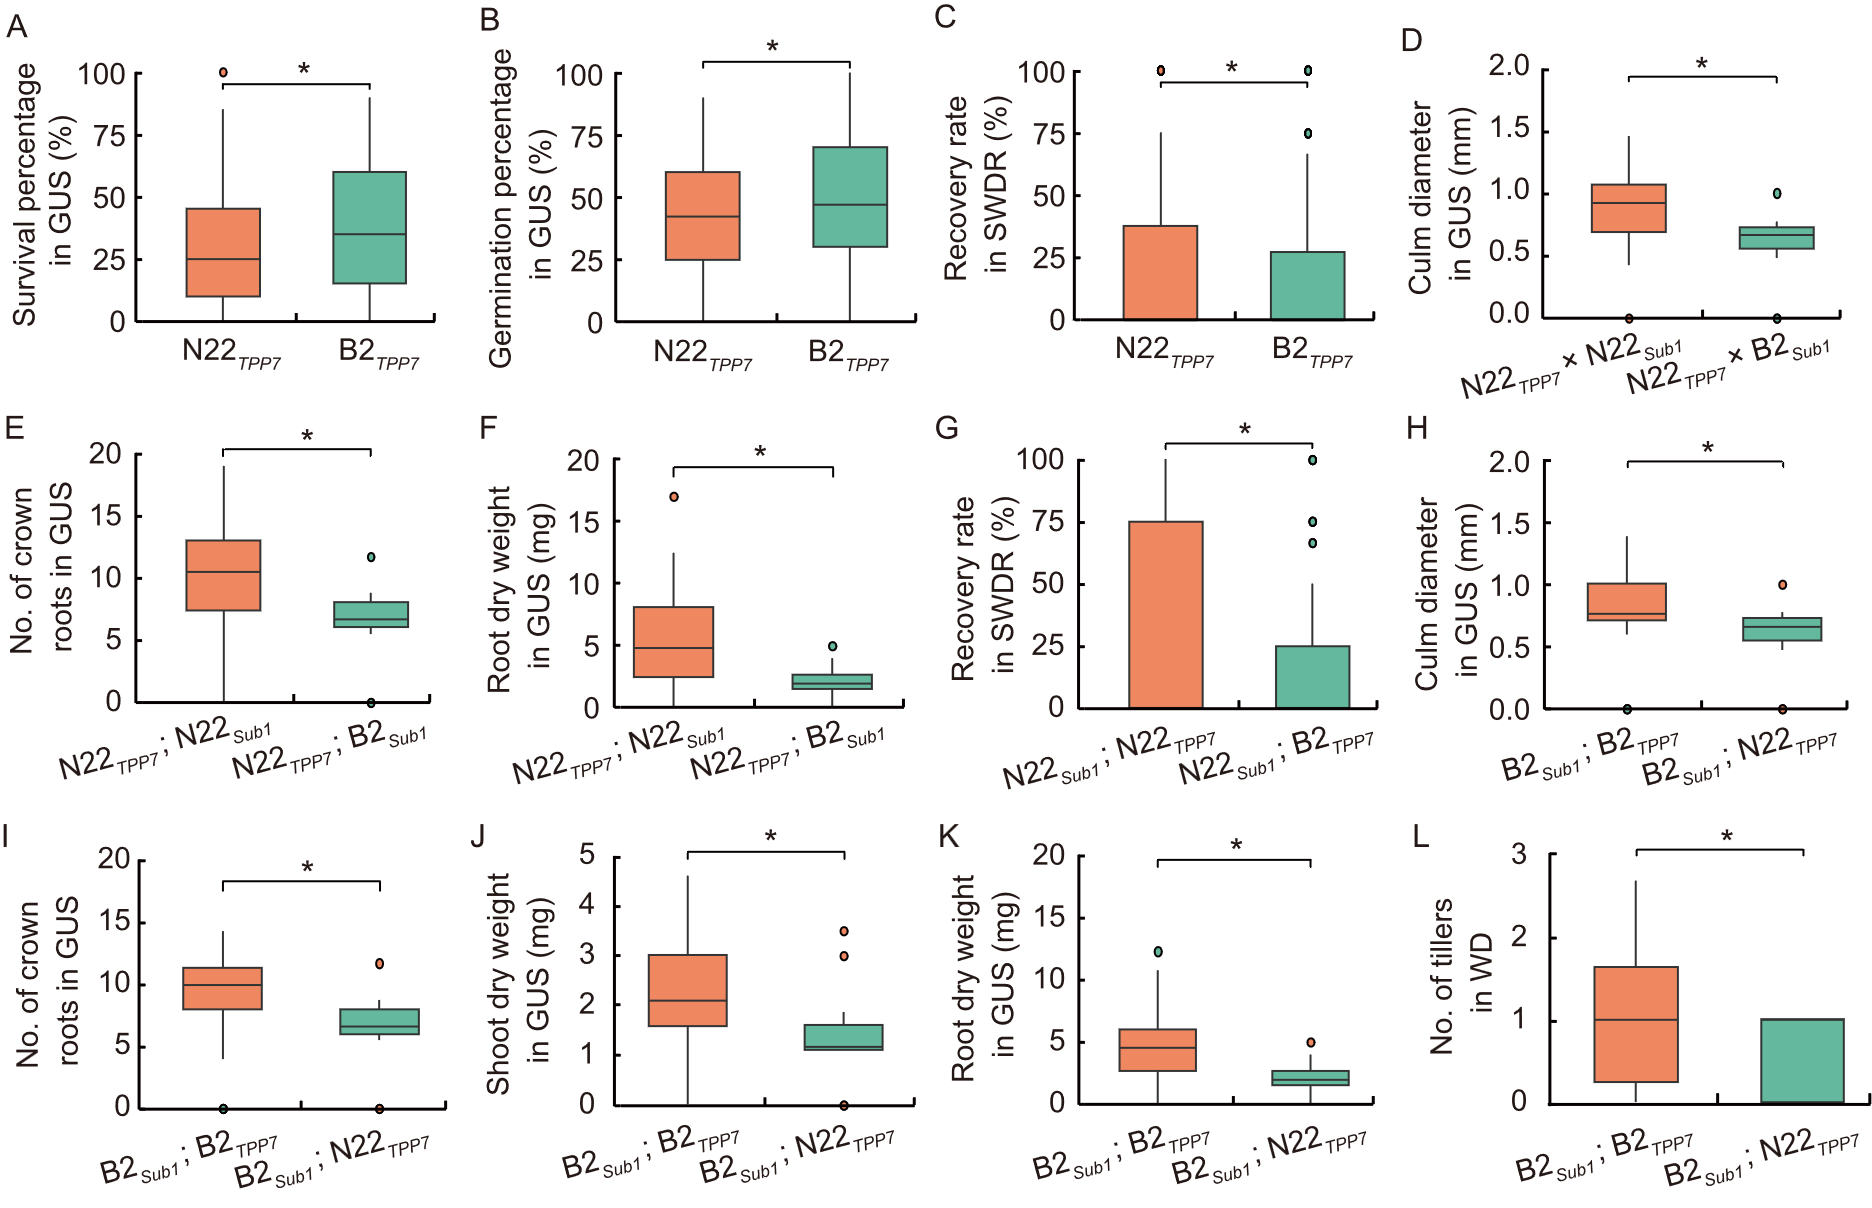
Fig. 1. Box plot analysis of parental and recombinant alleles under consecutive stress conditions. A-C are parental allele comparison, and D-L are parental vs recombinant allele comparison. GUS, Germination under submergence; SWDR, Severe water deficit recovery; WD, Water deficit stress. B2, Bhalum 2; N22, Nagina 22. * indicates significance level at 5% in Mendelian randomization analysis.
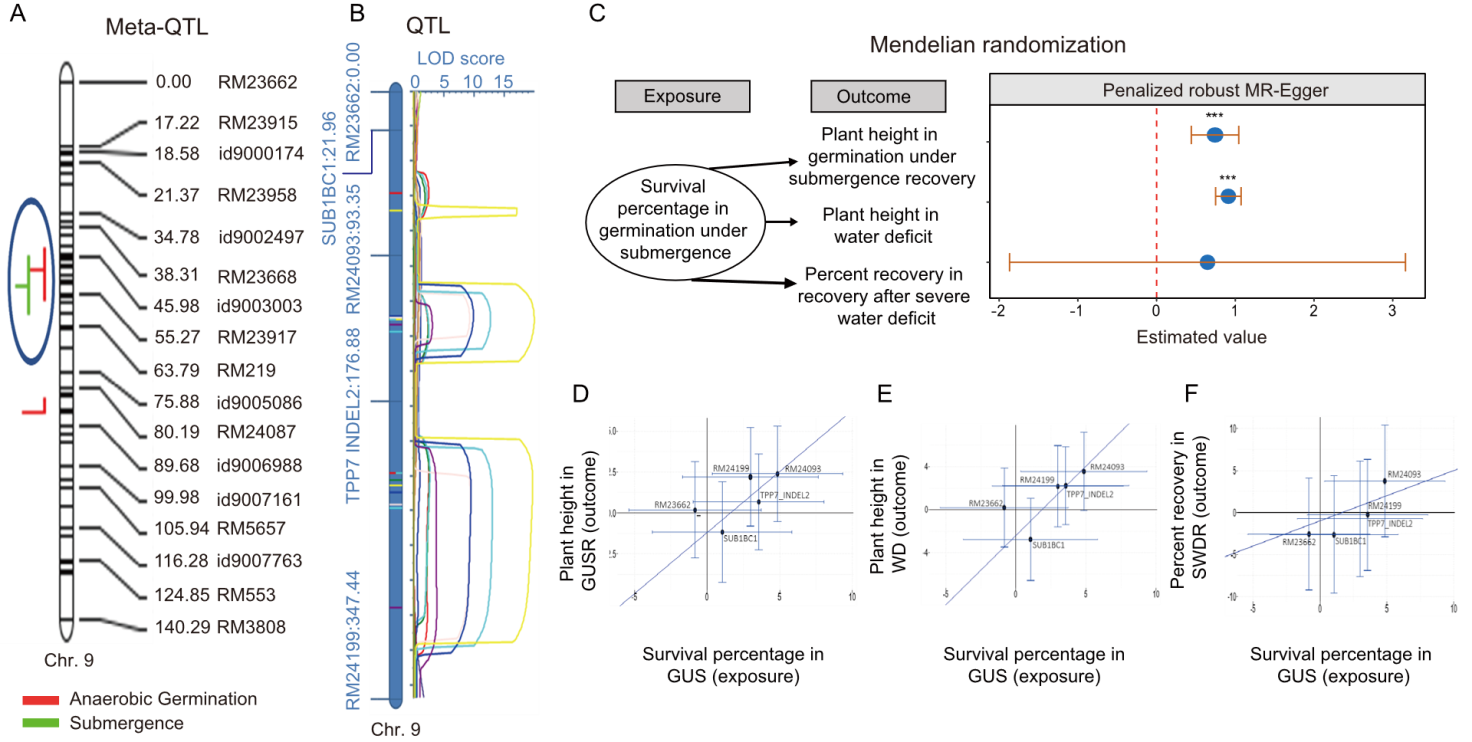
Fig. 2. LRLD region analysis under consecutive stresses. A, Meta-QTL analysis for anaerobic germination and submergence tolerance in rice. Co-segregation regions are marked with blue circles. B, QTLs identified for consecutive stress conditions using mapping populations. LOD, Logarithm of the odds score; C, Mendelian randomization analysis for key traits associated with consecutive stress tolerance with exposure and outcome framework. *** indicates high significance. D-F, Genetic association of markers in long-range linkage disequilibrium regions using mendelian randomization analysis. Diagonal line in D-F represents intercept line. GUS, Germination under submergence; GUSR, Germination under submergence recovery; WD, Water deficit; SWDR, Severe water deficit recovery.
| QTL | Trait | Stress condition | Chromosome | LOD | PVE (%) | Additive effect | Left marker | Right marker |
|---|---|---|---|---|---|---|---|---|
| qGSS-1-1 | Survival percentage | GUS | 9 | 2.56 | 2.34 | 2.073 | SUB1BC1 | RM24093 |
| qGSS-1-2 | Survival percentage | GUS | 9 | 2.58 | 2.35 | 2.071 | TPP7_INDEL2 | RM24199 |
| qGSG-1-1 | Germination percentage | GUS | 9 | 2.63 | 1.55 | 2.106 | TPP7_INDEL2 | RM24199 |
| qGSGR-1-1 | Germination rate | GUS | 9 | 2.54 | 1.57 | 1.640 | RM24093 | TPP7_INDEL2 |
| qGSGR-1-2 | Germination rate | GUS | 9 | 2.72 | 1.63 | 1.675 | TPP7_INDEL2 | RM24199 |
| qPHR-1-1 | Plant height | GUSR | 9 | 9.27 | 1.96 | 16.862 | RM24093 | TPP7_INDEL2 |
| qPHR-1-2 | Plant height | GUSR | 9 | 9.41 | 1.97 | 16.993 | TPP7_INDEL2 | RM24199 |
| qPHWD-1-1 | Plant height | WD | 9 | 12.75 | 1.85 | 21.813 | RM24093 | TPP7_INDEL2 |
| qPHWD-1-2 | Plant height | WD | 9 | 13.06 | 1.86 | 21.892 | TPP7_INDEL2 | RM24199 |
| qLLWD-1-1 | Leaf length | WD | 9 | 9.91 | 2.33 | 11.749 | RM24093 | TPP7_INDEL2 |
| qLLWD-1-2 | Leaf length | WD | 9 | 9.50 | 2.33 | 11.795 | TPP7_INDEL2 | RM24199 |
| qLWWD-1-1 | Leaf width | WD | 9 | 3.12 | 2.57 | 0.196 | RM24093 | TPP7_INDEL2 |
| qLWWD-1-2 | Leaf width | WD | 9 | 3.87 | 2.54 | 0.194 | TPP7_INDEL2 | RM24199 |
| qSWD-1-1 | SPAD | WD | 9 | 17.11 | 1.54 | 17.949 | SUB1BC1 | RM24093 |
| qSWD-1-2 | SPAD | WD | 9 | 19.95 | 1.54 | 17.938 | RM24093 | TPP7_INDEL2 |
| qSWD-1-3 | SPAD | WD | 9 | 19.71 | 1.55 | 17.960 | TPP7_INDEL2 | RM24199 |
Table 2. QTLs identified under consecutive stress conditions between Bhalum 2 and Nagina 22 recombinant inbred line populations.
| QTL | Trait | Stress condition | Chromosome | LOD | PVE (%) | Additive effect | Left marker | Right marker |
|---|---|---|---|---|---|---|---|---|
| qGSS-1-1 | Survival percentage | GUS | 9 | 2.56 | 2.34 | 2.073 | SUB1BC1 | RM24093 |
| qGSS-1-2 | Survival percentage | GUS | 9 | 2.58 | 2.35 | 2.071 | TPP7_INDEL2 | RM24199 |
| qGSG-1-1 | Germination percentage | GUS | 9 | 2.63 | 1.55 | 2.106 | TPP7_INDEL2 | RM24199 |
| qGSGR-1-1 | Germination rate | GUS | 9 | 2.54 | 1.57 | 1.640 | RM24093 | TPP7_INDEL2 |
| qGSGR-1-2 | Germination rate | GUS | 9 | 2.72 | 1.63 | 1.675 | TPP7_INDEL2 | RM24199 |
| qPHR-1-1 | Plant height | GUSR | 9 | 9.27 | 1.96 | 16.862 | RM24093 | TPP7_INDEL2 |
| qPHR-1-2 | Plant height | GUSR | 9 | 9.41 | 1.97 | 16.993 | TPP7_INDEL2 | RM24199 |
| qPHWD-1-1 | Plant height | WD | 9 | 12.75 | 1.85 | 21.813 | RM24093 | TPP7_INDEL2 |
| qPHWD-1-2 | Plant height | WD | 9 | 13.06 | 1.86 | 21.892 | TPP7_INDEL2 | RM24199 |
| qLLWD-1-1 | Leaf length | WD | 9 | 9.91 | 2.33 | 11.749 | RM24093 | TPP7_INDEL2 |
| qLLWD-1-2 | Leaf length | WD | 9 | 9.50 | 2.33 | 11.795 | TPP7_INDEL2 | RM24199 |
| qLWWD-1-1 | Leaf width | WD | 9 | 3.12 | 2.57 | 0.196 | RM24093 | TPP7_INDEL2 |
| qLWWD-1-2 | Leaf width | WD | 9 | 3.87 | 2.54 | 0.194 | TPP7_INDEL2 | RM24199 |
| qSWD-1-1 | SPAD | WD | 9 | 17.11 | 1.54 | 17.949 | SUB1BC1 | RM24093 |
| qSWD-1-2 | SPAD | WD | 9 | 19.95 | 1.54 | 17.938 | RM24093 | TPP7_INDEL2 |
| qSWD-1-3 | SPAD | WD | 9 | 19.71 | 1.55 | 17.960 | TPP7_INDEL2 | RM24199 |
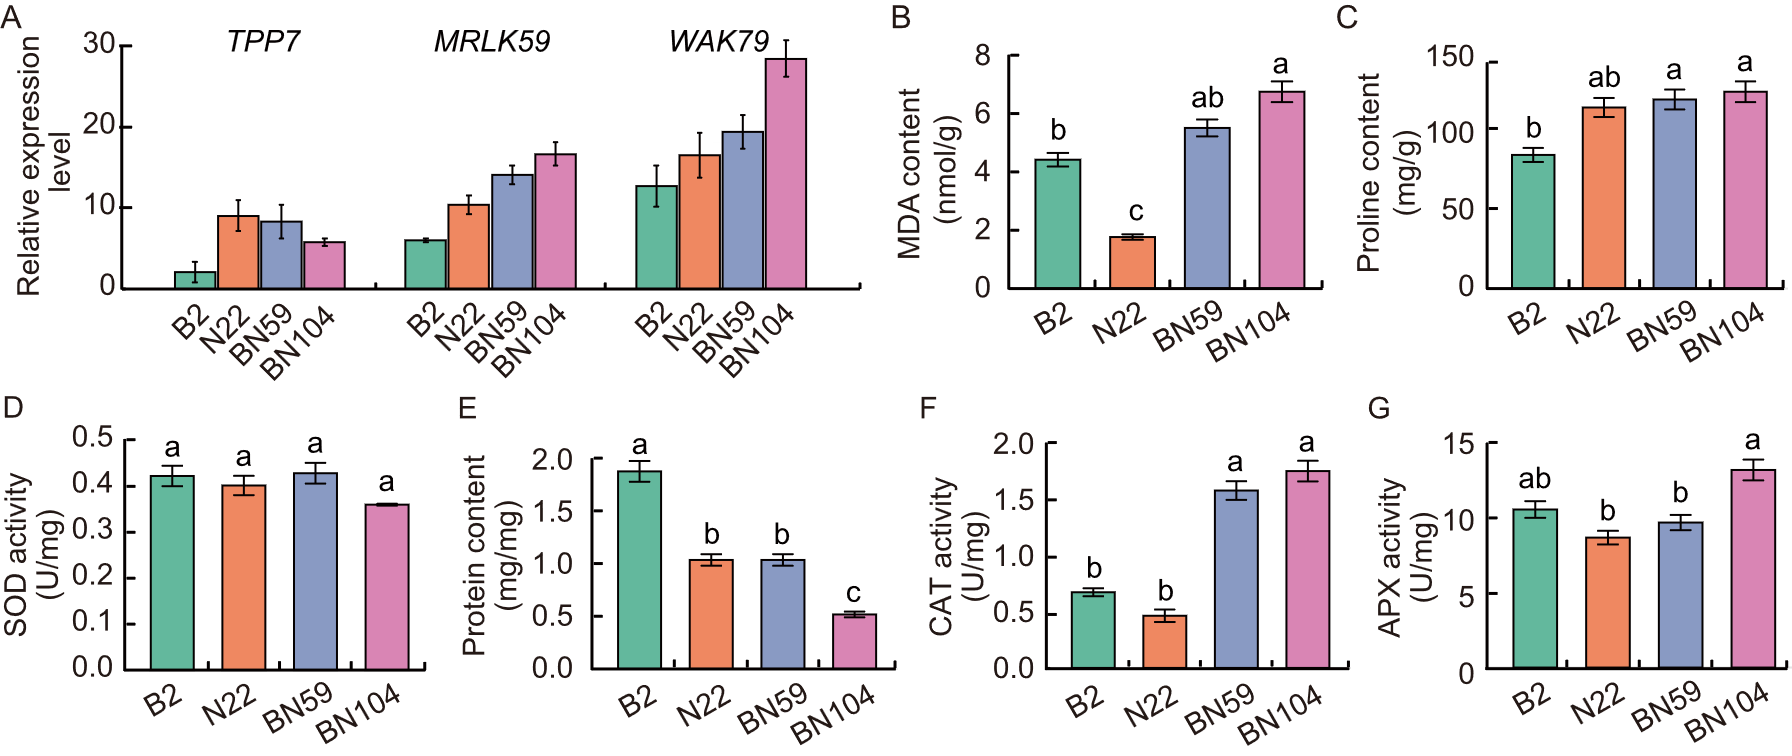
Fig. 3. Response of parental lines (Bhalum 2, B2 and Nagina 22, N22) and transgressive segregation lines (BN59 and N104) under submergence conditions. A, Relative expression levels of TPP7, MRLK59, and WAK79 genes of coleoptile at 7 d after sowing. B-G, Biochemical analysis of malondialdehyde (MDA) content (B), proline content (C), superoxide dismutase (SOD) activity (D), protein content (E), catalase (CAT) activity (F), and ascorbate peroxidase (APX) activity (G). Data are mean ± SD (n = 3). Different lowercase letters represent significant difference at the 0.05 level using the honestly significant difference (HSD) test.
| Consecutive stress condition | Trait | Parental line | Transgressive segregation line | ||
|---|---|---|---|---|---|
| Bhalum 2 | Nagina 22 | BN59 | BN104 | ||
| Germination under submergence | Survival percentage (%) | 37.66 ± 2.51 c | 46.66 ± 2.88 b | 95.00 ± 5.00 a | 93.33 ± 2.88 a |
| Germination under submergence recovery | Plant height (cm) | 33.63 ± 2.10 d | 41.40 ± 1.25 b | 37.72 ± 0.98 c | 45.33 ± 0.94 a |
| Water deficit | Plant height (cm) | 38.88 ± 1.20 c | 57.84 ± 1.96 a | 40.76 ± 1.78 c | 51.86 ± 1.47 b |
| Recovery from severe water deficit | Recovery rate (%) | 96.66 ± 5.77 a | 100.00 ± 0.00 a | 78.33 ± 2.88 b | 71.66 ± 2.88 c |
| Recovery after consecutive stress | Plant height (cm) | 117.40 ± 2.53 a | 110.80 ± 2.34 ab | 103.63 ± 5.03 b | 113.63 ± 5.87 a |
| Panicle length (cm) | 21.26 ± 2.59 a | 18.26 ± 0.80 b | 21.73 ± 0.61 a | 18.43 ± 1.13 b | |
| Number of tillers | 22.66 ± 5.13 a | 14.00 ± 1.00 b | 22.66 ± 2.51 a | 30.33 ± 7.09 a | |
| Filled grains | 100.66 ± 8.62 b | 65.66 ± 10.06 c | 154.33 ± 11.15 a | 66.33 ± 5.13 c | |
| Chaffy grains | 20.66 ± 3.78 a | 5.00 ± 1.00 b | 20.66 ± 11.37 a | 11.00 ± 1.00 ab | |
| 1000-grain weight (g) | 20.70 ± 1.70 ab | 19.90 ± 0.20 b | 20.90 ± 0.10 ab | 22.00 ± 0.50 a | |
| Single plant yield (g) | 31.83 ± 0.62 a | 23.93 ± 4.03 b | 36.53 ± 1.25 a | 20.96 ± 4.40 b | |
Table 3. Major consecutive stress tolerance traits and yield-related traits after recovery.
| Consecutive stress condition | Trait | Parental line | Transgressive segregation line | ||
|---|---|---|---|---|---|
| Bhalum 2 | Nagina 22 | BN59 | BN104 | ||
| Germination under submergence | Survival percentage (%) | 37.66 ± 2.51 c | 46.66 ± 2.88 b | 95.00 ± 5.00 a | 93.33 ± 2.88 a |
| Germination under submergence recovery | Plant height (cm) | 33.63 ± 2.10 d | 41.40 ± 1.25 b | 37.72 ± 0.98 c | 45.33 ± 0.94 a |
| Water deficit | Plant height (cm) | 38.88 ± 1.20 c | 57.84 ± 1.96 a | 40.76 ± 1.78 c | 51.86 ± 1.47 b |
| Recovery from severe water deficit | Recovery rate (%) | 96.66 ± 5.77 a | 100.00 ± 0.00 a | 78.33 ± 2.88 b | 71.66 ± 2.88 c |
| Recovery after consecutive stress | Plant height (cm) | 117.40 ± 2.53 a | 110.80 ± 2.34 ab | 103.63 ± 5.03 b | 113.63 ± 5.87 a |
| Panicle length (cm) | 21.26 ± 2.59 a | 18.26 ± 0.80 b | 21.73 ± 0.61 a | 18.43 ± 1.13 b | |
| Number of tillers | 22.66 ± 5.13 a | 14.00 ± 1.00 b | 22.66 ± 2.51 a | 30.33 ± 7.09 a | |
| Filled grains | 100.66 ± 8.62 b | 65.66 ± 10.06 c | 154.33 ± 11.15 a | 66.33 ± 5.13 c | |
| Chaffy grains | 20.66 ± 3.78 a | 5.00 ± 1.00 b | 20.66 ± 11.37 a | 11.00 ± 1.00 ab | |
| 1000-grain weight (g) | 20.70 ± 1.70 ab | 19.90 ± 0.20 b | 20.90 ± 0.10 ab | 22.00 ± 0.50 a | |
| Single plant yield (g) | 31.83 ± 0.62 a | 23.93 ± 4.03 b | 36.53 ± 1.25 a | 20.96 ± 4.40 b | |
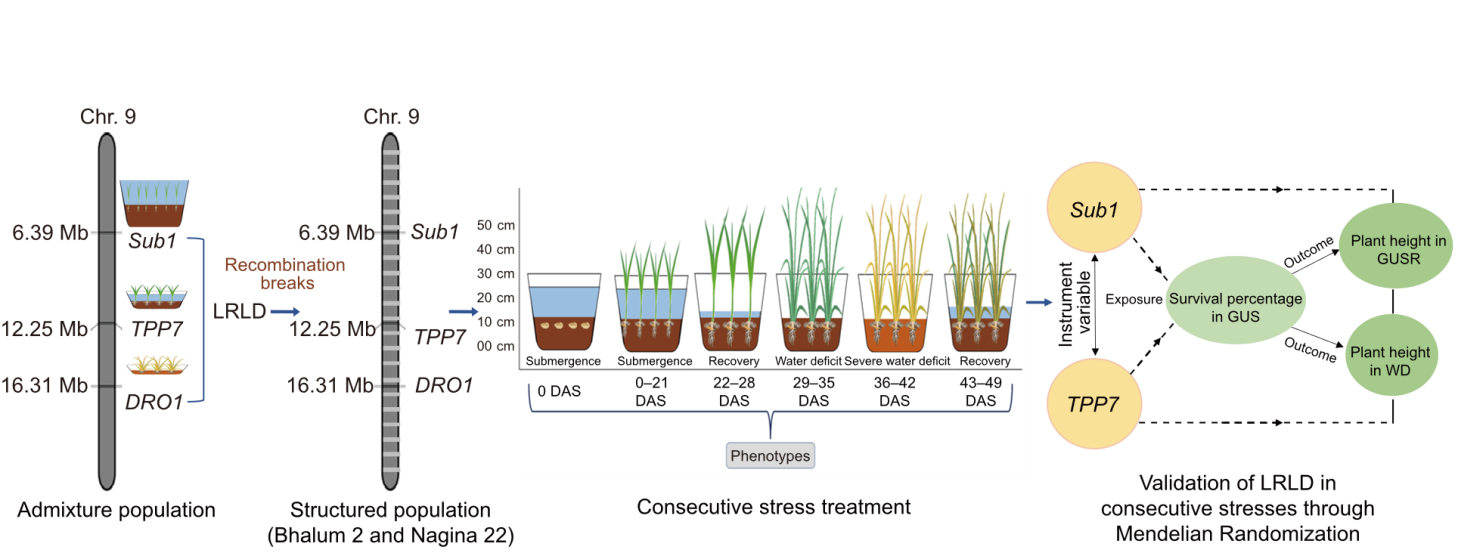
Fig. 4. Model for the evaluation of long-range linkage disequilibrium (LRLD) responses under consecutive stress conditions. LRLD is identified in the admixture population and evaluated in a structured population in linkage equilibrium. Consecutive stresses and exposure-outcome framework of mendelian randomization were utilized for the validation. DAS, Days after sowing; GUS, Germination under submergence; GUSR, Germination under submergence recovery; WD, Water deficit.
| [1] | Ahmadi N, Cao T V, Frouin J, et al. 2021. Genomic prediction of arsenic tolerance and grain yield in rice: Contribution of trait-specific markers and multi-environment models. Rice Sci, 28(3): 268-278. |
| [2] | Ahmadikhah A, Marufinia A. 2016. Effect of reduced plant height on drought tolerance in rice. 3 Biotech, 6(2): 221. |
| [3] | Alam R, Hummel M, Yeung E, et al. 2020. Flood resilience loci SUBMERGENCE 1 and ANAEROBIC GERMINATION 1 interact in seedlings established underwater. Plant Direct, 4(7): e00240. |
| [4] | Anandan A, Mahender A, Sah R P, et al. 2020. Non-destructive phenotyping for early seedling vigor in direct-seeded rice. Plant Methods, 16: 127. |
| [5] | Andrade A C B, Viana J M S, Pereira H D, et al. 2019. Linkage disequilibrium and haplotype block patterns in popcorn populations. PLoS One, 14(9): e0219417. |
| [6] | Anwar K, Joshi R, Bahuguna R N, et al. 2024. Impact of individual, combined and sequential stress on photosynthesis machinery in rice (Oryza sativa L). Physiol Plant, 176(1): e14209. |
| [7] | Bradbury P J, Zhang Z W, Kroon D E, et al. 2007. TASSEL: Software for association mapping of complex traits in diverse samples. Bioinformatics, 23(19): 2633-2635. |
| [8] | Bui L T, Ella E S, Dionisio-Sese M L, et al. 2019. Morpho-physiological changes in roots of rice seedling upon submergence. Rice Sci, 26(3): 167-177. |
| [9] | Chamara B S, Marambe B, Kumar V, et al. 2018. Optimizing sowing and flooding depth for anaerobic germination-tolerant genotypes to enhance crop establishment, early growth, and weed management in dry-seeded rice (Oryza sativa L.). Front Plant Sci, 9: 1654. |
| [10] | Chidambaranathan P, Balasubramaniasai C, Behura N, et al. 2021. Effects of high temperature on spikelet sterility in rice (Oryza sativa L.): Association between molecular markers and allelic phenotypic effect in field condition. Genet Resour Crop Evol, 68(5): 1923-1935. |
| [11] | Collard B C Y, Jahufer M Z Z, Brouwer J B, et al. 2005. An introduction to markers, quantitative trait loci (QTL) mapping and marker-assisted selection for crop improvement: The basic concepts. Euphytica, 142(1): 169-196. |
| [12] | Dash G K, Geda C K, Pati S, et al. 2024. Exogenously applied ABA modulated enzymatic changes conferring drought tolerance in rice varieties. Cereal Res Commun, https://doi.org/10.1007/s42976-024-00620-5. |
| [13] | Dien D C, Mochizuki T, Yamakawa T. 2019. Effect of various drought stresses and subsequent recovery on proline, total soluble sugar and starch metabolisms in rice (Oryza sativa L.) varieties. Plant Prod Sci, 22(4): 530-545. |
| [14] | Eisinga R, te Grotenhuis M, Pelzer B. 2013. The reliability of a two-item scale: Pearson, cronbach, or spearman-brown? Int J Public Health, 58(4): 637-642. |
| [15] | El Hou A, Rocha D, Venot E, et al. 2021. Long-range linkage disequilibrium in French beef cattle breeds. Genet Sel Evol, 53(1): 63. |
| [16] | Fernández M C, Belinque H, Gutierrez Boem F H, et al. 2009. Compared phosphorus efficiency in soybean, sunflower and maize. J Plant Nutr, 32(12): 2027-2043. |
| [17] | Gamache I, Legault M A, Grenier J C, et al. 2021. A sex-specific evolutionary interaction between ADCY9 and CETP. eLife, 10: e69198. |
| [18] | Hothorn T, Hornik K, van de Wiel M A, et al. 2008. Implementing a class of permutation tests: The coin Package. J Stat Soft, 28(8): 1-23. |
| [19] | Islam M R, Gregorio G B, Salam M A, et al. 2012. Validation of SalTol linked markers and haplotype diversity on chromosome 1 of rice. MPB, 3(1): 103-114. |
| [20] | Ismail A M, Johnson D E, Ella E S, et al. 2012. Adaptation to flooding during emergence and seedling growth in rice and weeds, and implications for crop establishment. AoB Plants, 2012: pls019. |
| [21] | Kishore Sahoo R, Jeughale K P, Sarkar S, et al. 2024. Growing conditions and varietal ecologies differently regulates the growth-regulating-factor (GRFs) gene family in rice. Iran J Biotechnol, 22(1): e3697. |
| [22] | Kitomi Y, Hanzawa E, Kuya N, et al. 2020. Root angle modifications by the DRO1 homolog improve rice yields in saline paddy fields. Proc Natl Acad Sci USA, 117(35): 21242-21250. |
| [23] | Koch E, Ristroph M, Kirkpatrick M. 2013. Long range linkage disequilibrium across the human genome. PLoS One, 8(12): e80754. |
| [24] | Kosambi D D. 1944. The estimation of map distance from recombination values. Ann. Eugen, 12: 505-525. |
| [25] | Kretzschmar T, Pelayo M A F, Trijatmiko K R, et al. 2015. A trehalose-6-phosphate phosphatase enhances anaerobic germination tolerance in rice. Nat Plants, 1: 15124. |
| [26] | Kumar S, Basu S, Choudhary A K, et al. 2024. Sequential submergence and drought induce yield loss in rice by affecting redox homeostasis and source-to-sink sugar transport. Field Crops Res, 310: 109362. |
| [27] | Lautenberger J A, Stephens J C, O’Brien S J, et al. 2000. Significant admixture linkage disequilibrium across 30 cM around the FY locus in African Americans. Am J Hum Genet, 66(3): 969-978. |
| [28] | Mansueto L, Fuentes R R, Borja F N, et al. 2017. Rice SNP-seek database update: New SNPs, indels, and queries. Nucleic Acids Res, 45(D1): D1075-D1081. |
| [29] | Mather K A, Caicedo A L, Polato N R, et al. 2007. The extent of linkage disequilibrium in rice (Oryza sativa L.). Genetics, 177(4): 2223-2232. |
| [30] | Meng L, Li H H, Zhang L Y, et al. 2015. QTL IciMapping: Integrated software for genetic linkage map construction and quantitative trait locus mapping in biparental populations. Crop J, 3(3): 269-283. |
| [31] | Mondal S, Khan M I R, Dixit S, et al. 2020. Growth, productivity and grain quality of AG1 and AG2 QTLs introgression lines under flooding in direct-seeded rice system. Field Crops Res, 248: 107713. |
| [32] | Murray M G, Thompson W F. 1980. Rapid isolation of high molecular weight plant DNA. Nucleic Acids Res, 8(19): 4321-4325. |
| [33] | Mwakyusa L, Heredia M C, Kilasi N L, et al. 2023. Screening of potential donors for anaerobic stress tolerance during germination in rice. Front Plant Sci, 14: 1261101. |
| [34] | Norton G J, Travis A J, Douglas A, et al. 2018. Genome wide association mapping of grain and straw biomass traits in the rice Bengal and Assam aus panel (BAAP) grown under alternate wetting and drying and permanently flooded irrigation. Front Plant Sci, 9: 1223. |
| [35] | Olagunju S O, Atayese M O, Sakariyawo O S, et al. 2022. Effects of multi-growth stage water deficit and orthosilicic acid fertiliser on lodging resistance of rice cultivars. Crop Pasture Sci, 73(4): 370-389. |
| [36] | Pan Y W, Zhang C, Lu Y, et al. 2022. Genomic diversity and post-admixture adaptation in the Uyghurs. Natl Sci Rev, 9(3): nwab124. |
| [37] | Pandey S, Velasco L. 2002. Economics of direct seeding in Asia: patterns of adoption and research priorities. Rice Notes, 1999, 24(2): 6-11 |
| [38] | Park L. 2019. Population-specific long-range linkage disequilibrium in the human genome and its influence on identifying common disease variants. Sci Rep, 9(1): 11380. |
| [39] | Patel A, Ye T, Xue H R, et al. 2023. MendelianRandomization v0.9.0: Updates to an R package for performing Mendelian randomization analyses using summarized data. Wellcome Open Res, 8: 449. |
| [40] | Patterson N, Hattangadi N, Lane B, et al. 2004. Methods for high-density admixture mapping of disease genes. Am J Hum Genet, 74(5): 979-1000. |
| [41] | Ramegowda V, Senthil A, Senthil-Kumar M. 2024. Stress combinations and their interactions in crop plants. Plant Physiol Rep, 29(1): 1-5. |
| [42] | Rao X Y, Huang X L, Zhou Z C, et al. 2013. An improvement of the 2(-∆∆CT) method for quantitative real-time polymerase chain reaction data analysis. Biostat Bioinforma Biomath, 3(3): 71-85. |
| [43] | Renziehausen T, Frings S, Schmidt-Schippers R. 2024. ‘Against all floods’: Plant adaptation to flooding stress and combined abiotic stresses. Plant J, 117(6): 1836-1855. |
| [44] | Sanchez J, Kaur P P, Pabuayon I C M, et al. 2022. DECUSSATE network with flowering genes explains the variable effects of qDTY12.1 to rice yield under drought across genetic backgrounds. Plant Genome, 15(1): e20168. |
| [45] | Sanderson E, Glymour M M, Holmes M V, et al. 2022. Mendelian randomization. Nat Rev Meth Primers, 2: 6. |
| [46] | Santos J D, Chebotarov D, McNally K L, et al. 2019. Fine scale genomic signals of admixture and alien introgression among Asian rice landraces. Genome Biol Evol, 11(5): 1358-1373. |
| [47] | Septiningsih E M, Ignacio J C I, Sendon P M D, et al. 2013. QTL mapping and confirmation for tolerance of anaerobic conditions during germination derived from the rice Landrace Ma-Zhan Red. Theor Appl Genet, 126(5): 1357-1366. |
| [48] | Smith M W, Lautenberger J A, Shin H D, et al. 2001. Markers for mapping by admixture linkage disequilibrium in African American and Hispanic populations. Am J Hum Genet, 69(5): 1080-1094. |
| [49] | Sudhir-Yadav, Gill G, Humphreys E, et al. 2011. Effect of water management on dry seeded and puddled transplanted rice. Part 1: Crop performance. Field Crops Res, 120(1): 112-122. |
| [50] | Uga Y, Okuno K, Yano M. 2011. Dro1, a major QTL involved in deep rooting of rice under upland field conditions. J Exp Bot, 62(8): 2485-2494. |
| [51] | Untergasser A, Nijveen H, Rao X Y, et al. 2007. Primer3Plus, an enhanced web interface to Primer3. Nucleic Acids Res, 35: W71-W74. |
| [52] | Veyrieras J B, Goffinet B, Charcosset A. 2007. MetaQTL: A package of new computational methods for the meta-analysis of QTL mapping experiments. BMC Bioinformatics, 8: 49. |
| [53] | Vos P G, Paulo M J, Voorrips R E, et al. 2017. Evaluation of LD decay and various LD-decay estimators in simulated and SNP-array data of tetraploid potato. Theor Appl Genet, 130(1): 123-135. |
| [54] | Wei T, Simko V, Levy M, et al. 2017. Package ‘corrplot.’ Statistician. 56: e24. |
| [55] | Winkler C A, Nelson G W, Smith M W. 2010. Admixture mapping comes of age. Annu Rev Genomics Hum Genet, 11: 65-89. |
| [56] | Xu K, Xu X, Ronald P C, et al. 2000. A high-resolution linkage map of the vicinity of the rice submergence tolerance locus SUB1. Mol Gen Genet, 263(4): 681-689. |
| [57] | Xu K N, Xu X, Fukao T, et al. 2006. Sub1A is an ethylene-response-factor-like gene that confers submergence tolerance to rice. Nature, 442: 705-708. |
| [58] | Yang X Y, Lu M Q, Wang Y F, et al. 2021. Response mechanism of plants to drought stress. Horticulturae, 7(3): 50. |
| [59] | Zhang H N, Sonnewald U. 2017. Differences and commonalities of plant responses to single and combined stresses. Plant J, 90(5): 839-855. |
| No related articles found! |
| 阅读次数 | ||||||
|
全文 |
|
|||||
|
摘要 |
|
|||||