Rice Science ›› 2026, Vol. 33 ›› Issue (2): 232-244.DOI: 10.1016/j.rsci.2025.12.002
收稿日期:2025-09-12
接受日期:2025-12-11
出版日期:2026-03-28
发布日期:2026-04-01
. [J]. Rice Science, 2026, 33(2): 232-244.
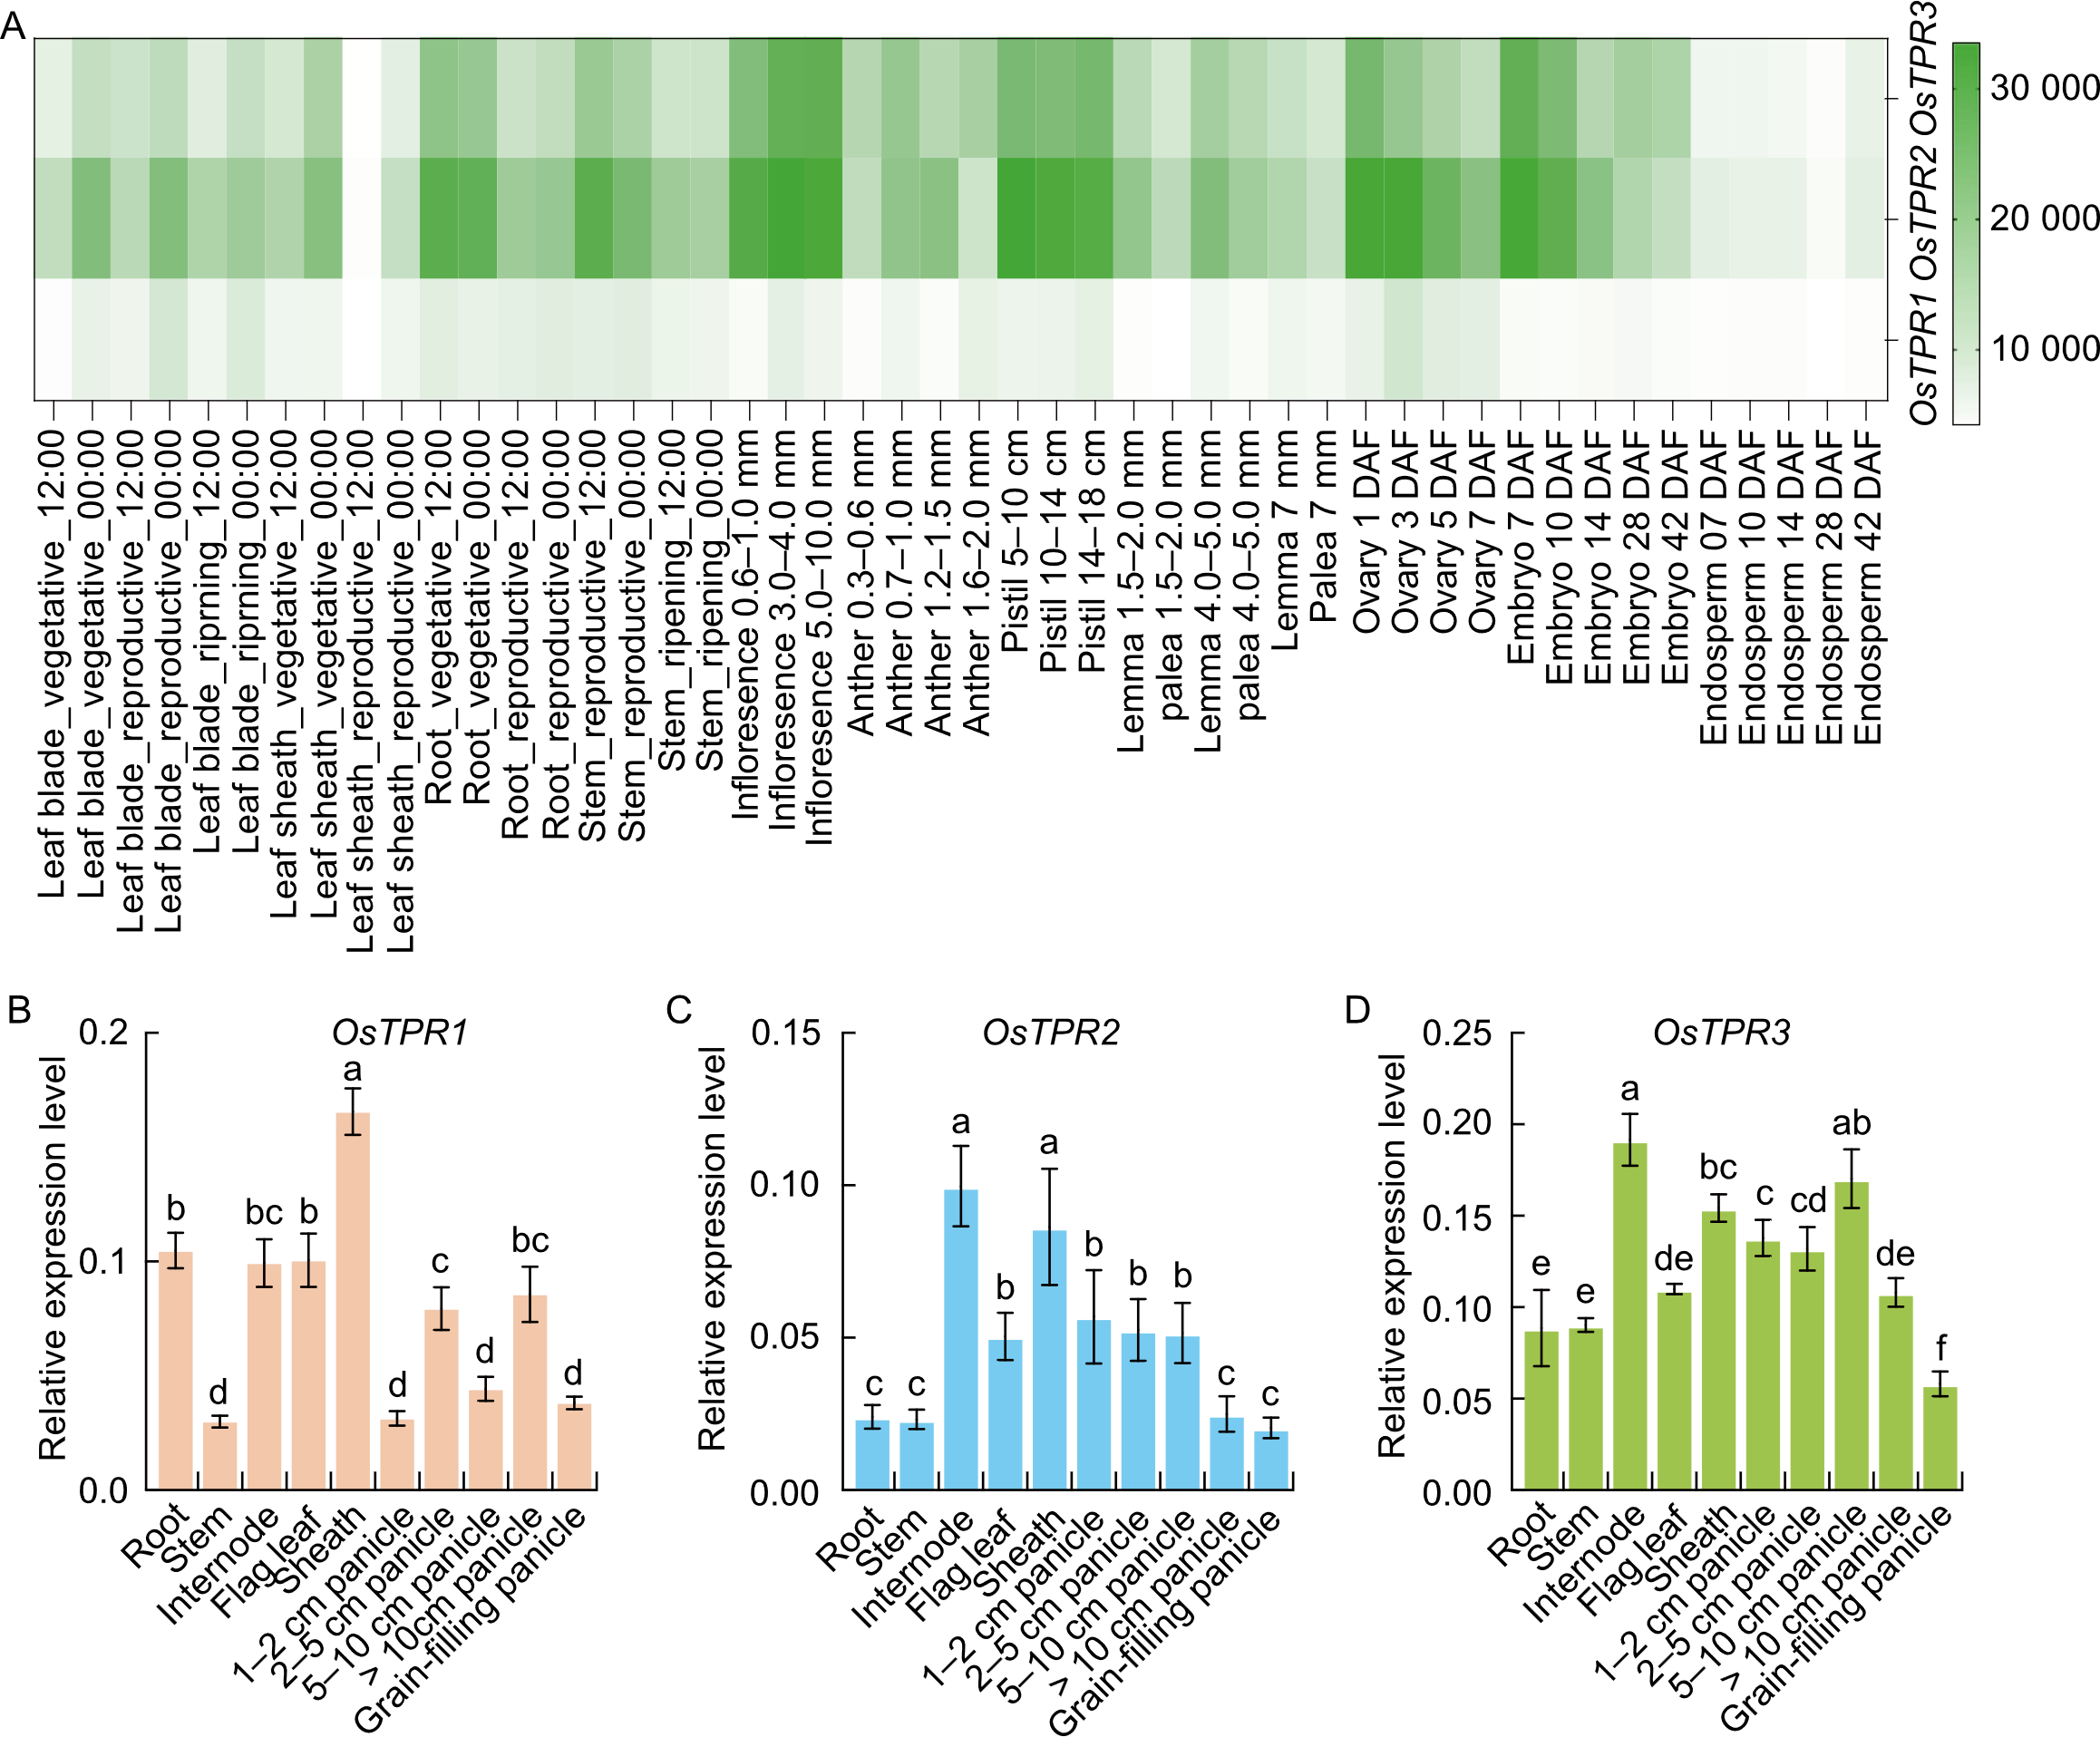
Fig. 1. Expression pattern analysis of the OsTPR genes. A, Expression analysis of OsTPR genes (OsTPR1, OsTPR2, and OsTPR3) in different tissues under developmental stages based on RNA-seq data from the RiceXPro database (https://ricexpro.dna.affrc.go.jp/). The heatmap displays low and high expression in white and green, respectively. DAF, Days after flowering. B-D, Tissue-specific expression profiles of OsTPR1 (B), OsTPR2 (C), and OsTPR3 (D) in root, stem, internode, flag leaf, sheath, panicles at different developmental stages (1-2 cm, 2-5 cm, 5-10 cm, and > 10 cm), and grain-filling panicle. OsUBQ was used as an internal control. Data are mean ± SD (n = 4). Different lowercase letters above bars indicate significant differences at P < 0.05 by one-way analysis of variance with Tukey’s honestly significant difference test.

Fig. 2. Pathogen-induced expression of OsTPR genes and subcellular localization of OsTPR proteins. A-C, Relative expression levels of OsTPR1 (A), OsTPR2 (B), and OsTPR3 (C) in Nipponbare leaves after inoculation with Xanthomonas oryzae pv. oryzae (Xoo). OsUBQ was used as an internal control. Data are mean ± SD (n = 4). Different lowercase letters above bars indicate significant differences at P < 0.05 by one-way analysis of variance with Tukey’s honestly significant difference test. D-E, Subcellular localization of OsTPR1, OsTPR2, and OsTPR3 in rice protoplasts at 12 h post-inoculation (D) and Nicotiana benthamiana leaf cells at 2 d post-agroinfiltration (E). GFP alone served as a control. GFP, Green fluorescent protein. NLS, Nuclear localization signal. Scale bars in D and E, are 10 and 20 μm, respectively.

Fig. 3. Functional characterization of OsTPR2 and OsTPR3 in bacterial blight resistance. A and B, CRISPR/Cas9 editing of OsTPR2 (A) and OsTPR3 (B). Blue and green boxes represent coding regions, and red letters or red dotted line indicate successfully edited sites. C and D, Bacterial blight symptoms (C) and lesion lengths (D) in WT and ostpr2 and ostpr3 knockout lines (ostpr2-1, ostpr2-2, ostpr3-1, and ostpr3-2) at 14 d post-inoculation (dpi) with Xanthomonas oryzae pv. oryzae (Xoo) inoculation. Scale bar, 5 cm. E, Expression levels of jasmonate (JA)-responsive genes (JAZs, COI1a, COI1b, and MYC2) and JA-biosynthesis genes (AOS2, LOX1, and JMT1) in 10-day-old seedlings of WT and ostpr2 and ostpr3 knockout lines (ostpr2-1 and ostpr3-1). OsUBQ was used as an internal control. WT, Wild type. In D and E, data are mean ± SD (n > 10). Asterisks above bars represent significant differences compared with WT (* and **, P < 0.05 and P < 0.01 by Student’s t-test).

Fig. 4. OsTPR2 interacts with OsJAZ12. A, Yeast two-hybrid (Y2H) assay demonstrating the interaction between OsTPR2 and OsJAZ12. Cotransformation with pGADT7-T and pGBKT7-p53 served as the positive control, whereas cotransformation with pGADT7-T and pGBKT7-Lam was used as the negative control. B, Bimolecular fluorescence complementation (BiFC) assay confirming interaction between OsTPR2 and OsJAZ12 in Nicotiana benthamiana leaf cells at 48 h post-inoculation. Confocal microscopy was used to visualize fluorescence signals. Scale bars, 20 μm. C, Predicted structural interaction between OsTPR2 and OsJAZ12 based on AlphaFold3 modeling. D, Relative transcript levels of OsJAZ12 in Nipponbare leaves after inoculation with Xanthomonas oryzae pv. oryzae (Xoo). OsUBQ was used as an internal control. Data are mean ± SD (n = 4). Different lowercase letters above bars indicate significant differences at P < 0.05 by one-way analysis of variance with Tukey’s honestly significant difference test.
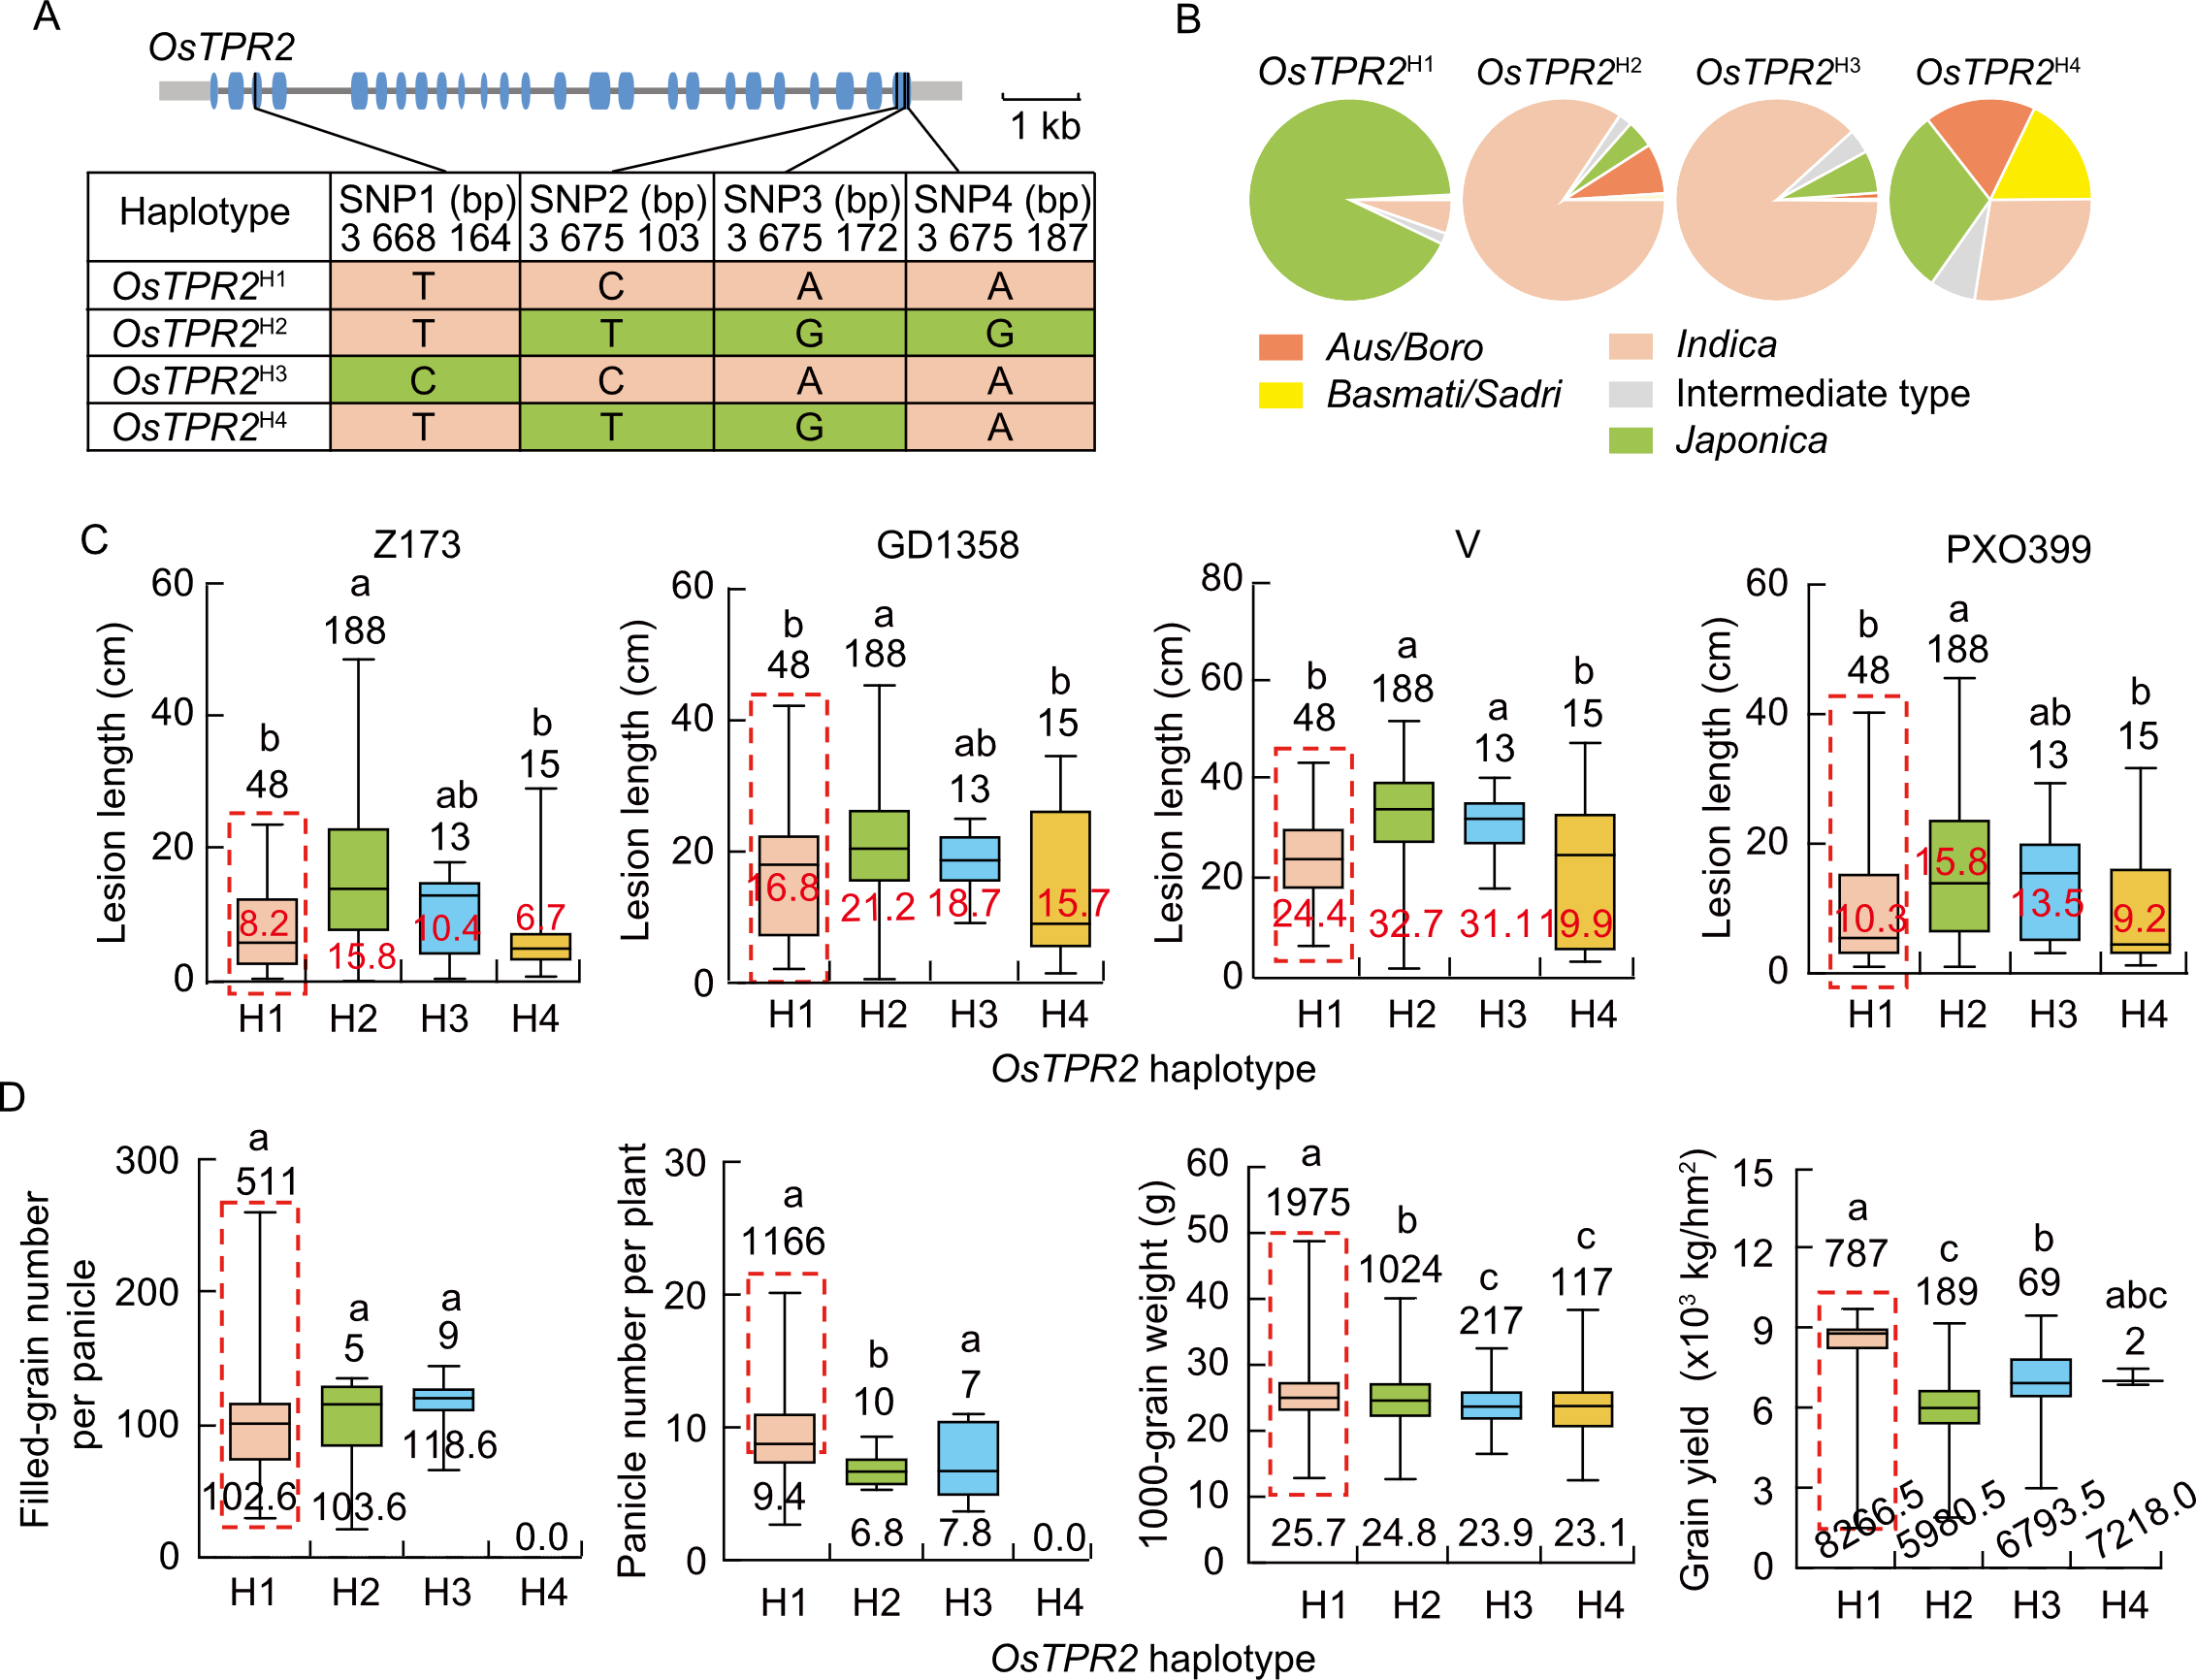
Fig. 5. Haplotype variations and phenotypic association of OsTPR2. A, Schematic representation of four major haplotypes in the coding sequence region of OsTPR2. Blue boxes indicate coding sequences. SNP2 is frameshift variant with ‘C’ representing the reference allele; SNP3 is frameshift variant with ‘A’ representing the reference allele. B, Subpopulation distribution frequencies of the four OsTPR2 haplotypes (OsTPR2H1-H4) across different rice subgroups in the 3K Rice Genome SNP dataset. C, Box plots comparing bacterial blight lesion lengths among OsTPR2 haplotypes after inoculation with four Xanthomonas oryzae pv. oryzae (Xoo) strains (Z173, GD1358, V, and PXO339). D, Box plots comparing yield-related traits including filled-grain number per panicle, panicle number per plant, 1000-grain weight, and grain yield among the four OsTPR2 haplotypes under normal field conditions. In C and D, values above boxes represent the number of accessions per haplotype. In C, values in red represent the mean lesion length. In D, values below boxes represent the mean value of each yield-related trait. The red dashed box highlights superior haplotype. Different lowercase letters above bars indicate significant differences at P < 0.05 by one-way analysis of variance with Tukey’s honestly significant difference test.
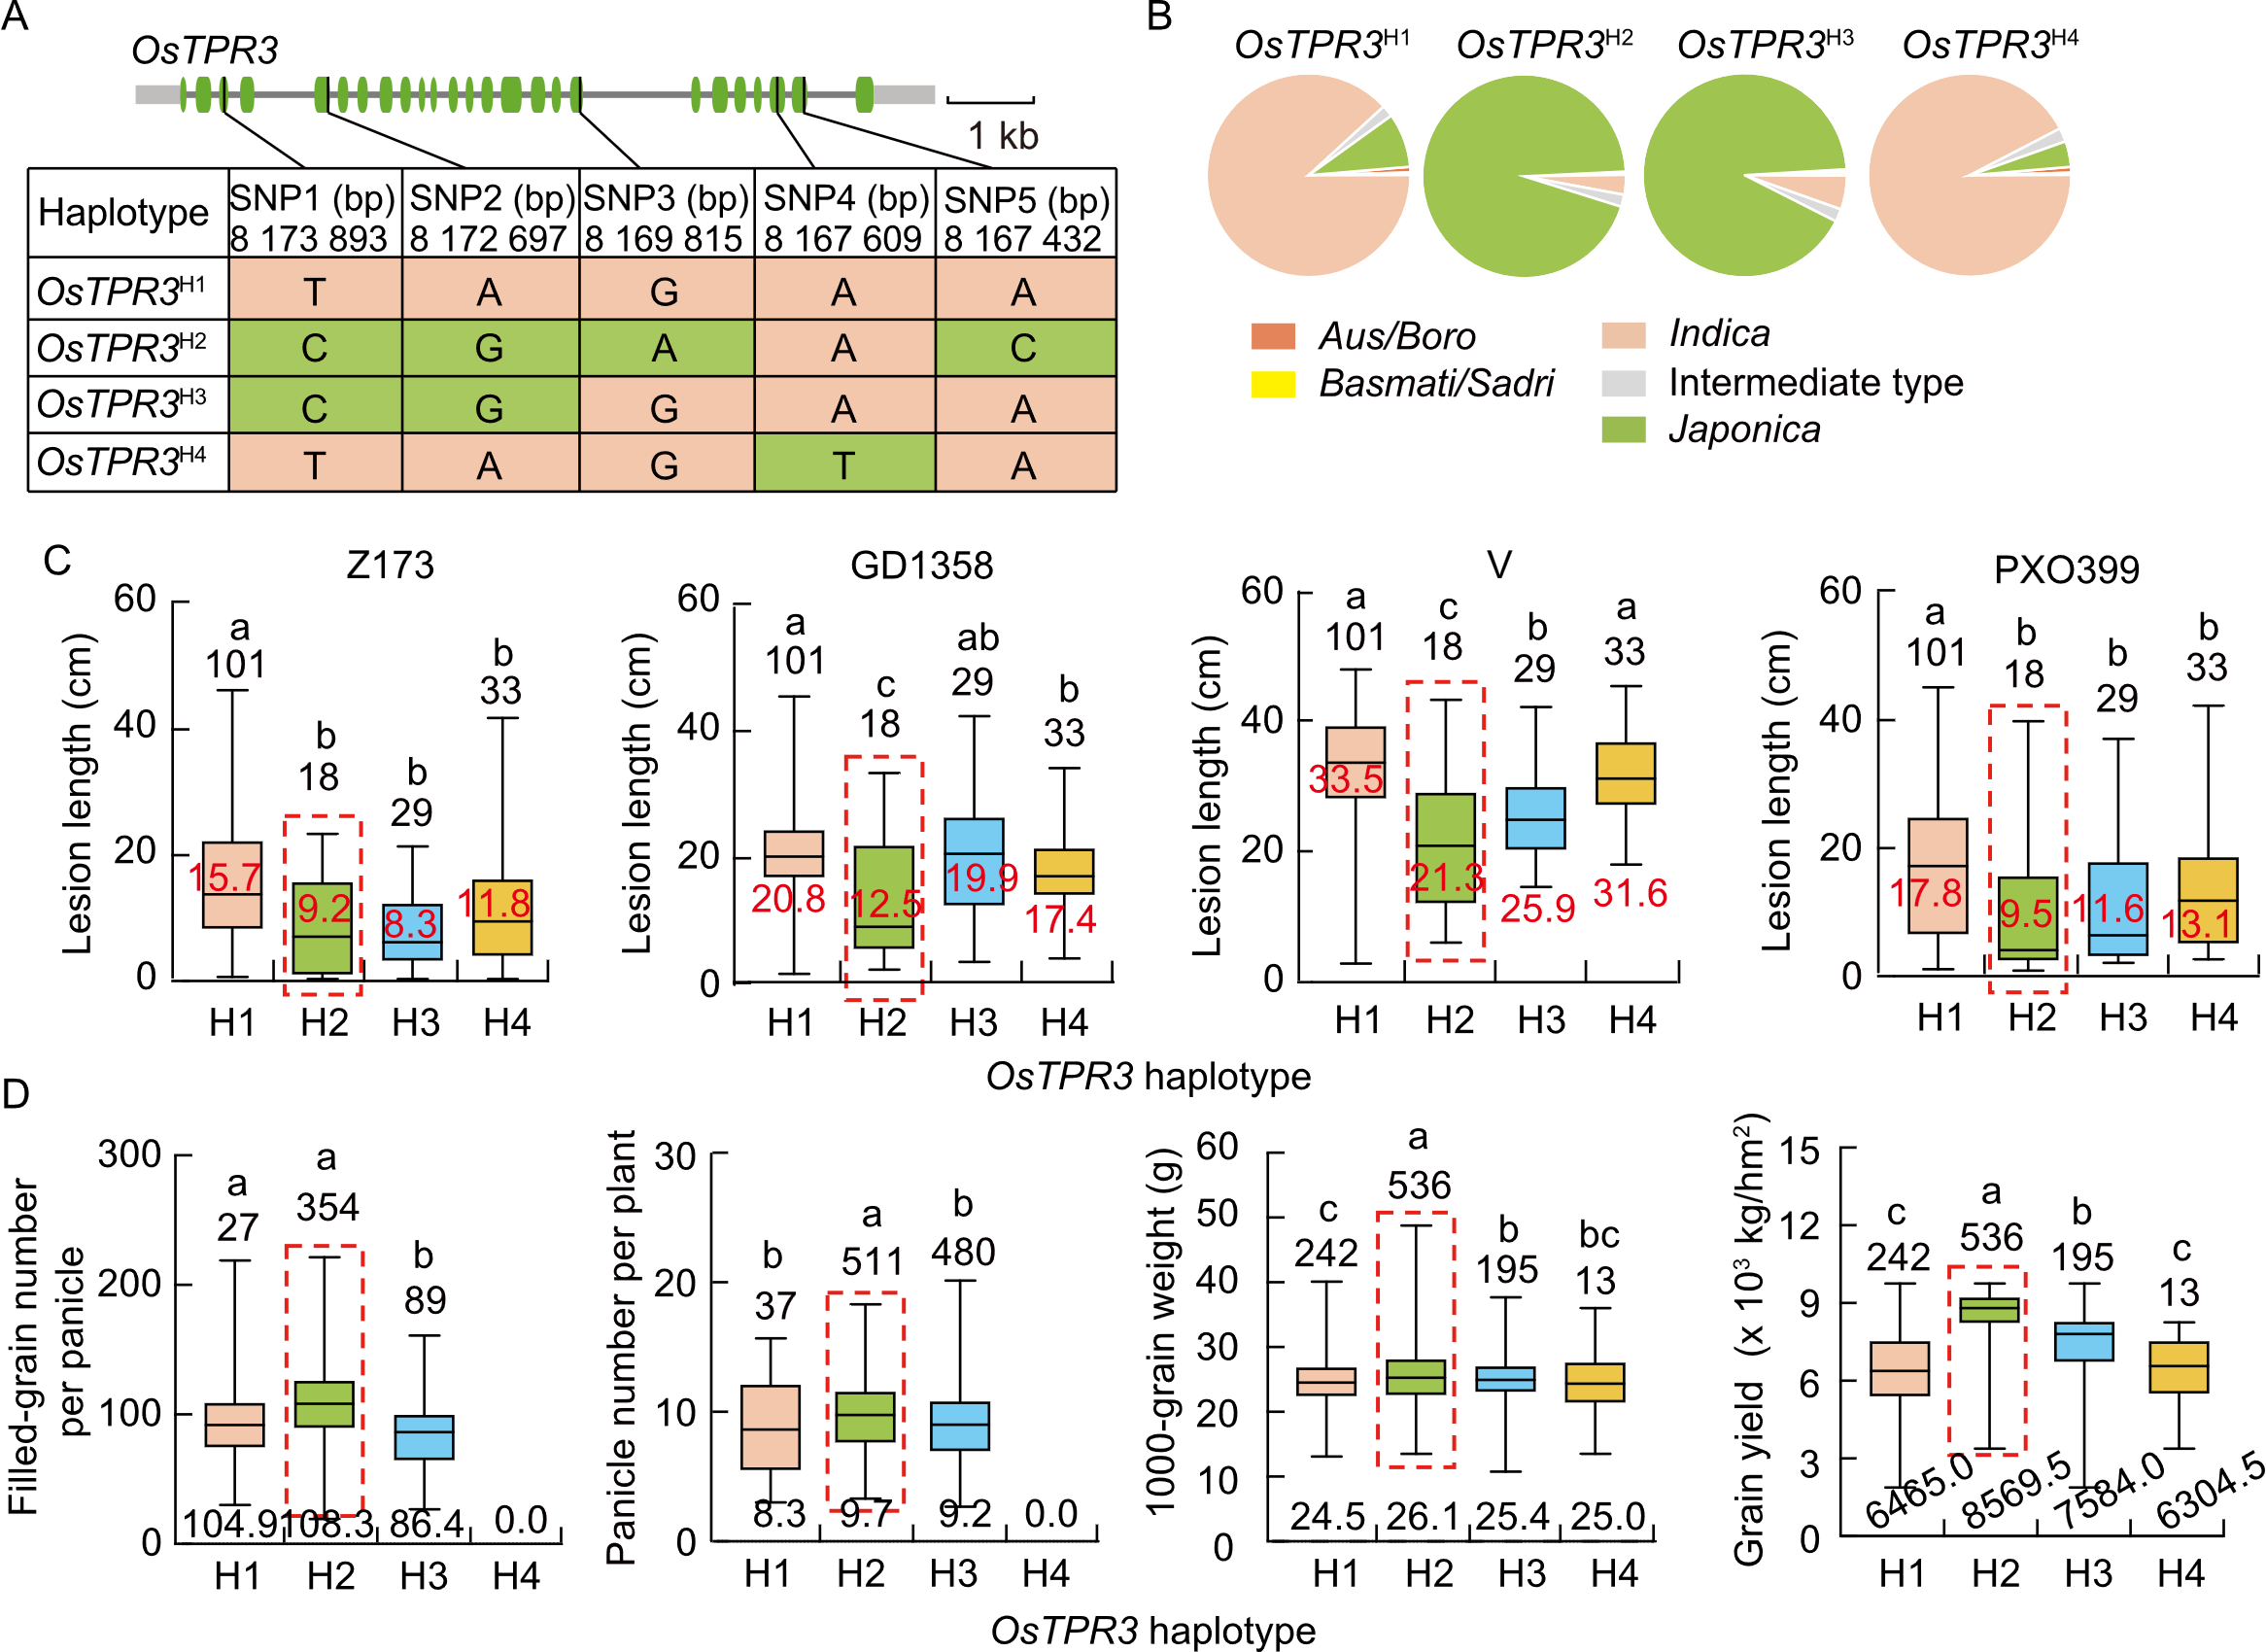
Fig. 6. Haplotype variation and phenotypic association of OsTPR3. A, Schematic representation of four major haplotypes in the coding sequence region of OsTPR3. Green boxes indicate coding sequences. SNP3, Splice region variant, while ‘A’ represents the reference allele. B, Subpopulation distribution frequencies of the four OsTPR3 haplotypes (OsTPR3H1-H4) across different rice subgroups in the 3K RG SNP dataset. C, Box plots comparing bacterial blight lesion lengths among OsTPR3 haplotypes after inoculation with four Xanthomonas oryzae pv. oryzae (Xoo) strains (Z173, GD1358, V, and PXO339). D, Box plots comparing yield-related traits including filled-grain number per panicle, panicle number per plant, 1000-grain weight, and grain yield among the four OsTPR3 haplotypes under normal field conditions. In C and D, values above boxes represent the number of accessions per haplotype. In C, values in red represent the mean lesion length. In D, values below boxes represent the mean value of each yield-related trait. The red dashed box highlights superior haplotype. Different lowercase letters above bars indicate significant differences at P < 0.05 by one-way analysis of variance with Tukey’s honestly significant difference test.
| [1] | Aalders T R, de Sain M, Gawehns F, et al. 2024. Specific members of the TOPLESS family are susceptibility genes for Fusarium wilt in tomato and Arabidopsis. Plant Biotechnol J, 22(1): 248-261. |
| [2] | Abramson J, Adler J, Dunger J, et al. 2024. Accurate structure prediction of biomolecular interactions with AlphaFold 3. Nature, 630: 493-500. |
| [3] | Causier B, Ashworth M, Guo W J, et al. 2012. The TOPLESS interactome: A framework for gene repression in Arabidopsis. Plant Physiol, 158(1): 423-438. |
| [4] | Chen C J, Chen H, Zhang Y, et al. 2020. TBtools: An integrative toolkit developed for interactive analyses of big biological data. Mol Plant, 13(8): 1194-1202. |
| [5] | Darino M, Chia K S, Marques J, et al. 2021. Ustilago maydis effector Jsi1 interacts with Topless corepressor, hijacking plant jasmonate ethylene signaling. New Phytol, 229(6): 3393-3407. |
| [6] | Garner C M, Spears B J, Su J B, et al. 2021. Opposing functions of the plant TOPLESS gene family during SNC1-mediated autoimmunity. PLoS Genet, 17(2): e1009026. |
| [7] | Hao Y W, Wang X Y, Li X, et al. 2014. Genome-wide identification, phylogenetic analysis, expression profiling, and protein-protein interaction properties of TOPLESS gene family members in tomato. J Exp Bot, 65(4): 1013-1023. |
| [8] | Huang Y, Yang J L, Sun X, et al. 2025. Perception of viral infections and initiation of antiviral defence in rice. Nature, 641: 173-181. |
| [9] | Jiang N, Yan J, Liang Y, et al. 2020. Resistance genes and their interactions with bacterial blight/leaf streak pathogens (Xanthomonas oryzae) in rice (Oryza sativa L.): An updated review. Rice, 13(1): 3. |
| [10] | Ke J Y, Ma H L, Gu X, et al. 2015. Structural basis for recognition of diverse transcriptional repressors by the TOPLESS family of corepressors. Sci Adv, 1(6): e1500107. |
| [11] | Li W J, Yan J J, Zhang Y, et al. 2023. Serine protease NAL1 exerts pleiotropic functions through degradation of TOPLESS-related corepressor in rice. Nat Plants, 9(7): 1130-1142. |
| [12] | Liu M M, Shi Z Y, Zhang X H, et al. 2019. Inducible overexpression of Ideal Plant Architecture1 improves both yield and disease resistance in rice. Nat Plants, 5(4): 389-400. |
| [13] | Liu X, Galli M, Camehl I, et al. 2019. RAMOSA1 ENHANCER LOCUS2-mediated transcriptional repression regulates vegetative and reproductive architecture. Plant Physiol, 179(1): 348-363. |
| [14] | Liu X, Zhang F, Xun Z Q, et al. 2025. The OsNL1-OsTOPLESS2-OsMOC1/3 pathway regulates high-order tiller outgrowth in rice. Plant Biotechnol J, 23(3): 900-910. |
| [15] | Liu Z C, Karmarkar V. 2008. Groucho/Tup1 family co-repressors in plant development. Trends Plant Sci, 13(3): 137-144. |
| [16] | Long J A, Ohno C, Smith Z R, et al. 2006. TOPLESS regulates apical embryonic fate in Arabidopsis. Science, 312: 1520-1523. |
| [17] | Lu J L, Wang C C, Zeng D, et al. 2021. Genome-wide association study dissects resistance loci against bacterial blight in a diverse rice panel from the 3000 Rice Genomes Project. Rice, 14(1): 22. |
| [18] | Ma H, Duan J, Ke J Y, et al. 2017. A D53 repression motif induces oligomerization of TOPLESS corepressors and promotes assembly of a corepressor-nucleosome complex. Sci Adv, 3(6): e1601217. |
| [19] | Ma N N, Song P Z, Liu Z Y, et al. 2025. Regulation of m6A RNA reader protein OsECT 3 activity by lysine acetylation in the cold stress response in rice. Nat Plants, 11(6): 1165-1180. |
| [20] | Pauwels L, Barbero G F, Geerinck J, et al. 2010. NINJA connects the co-repressor TOPLESS to jasmonate signalling. Nature, 464: 788-791. |
| [21] | Peng H, Wang K, Chen Z, et al. 2020. MBKbase for rice: An integrated omics knowledgebase for molecular breeding in rice. Nucleic Acids Res, 48(D1): D1085-D1092. |
| [22] | Plant A R, Larrieu A, Causier B. 2021. Repressor for hire! The vital roles of TOPLESS-mediated transcriptional repression in plants. New Phytol, 231(3): 963-973. |
| [23] | Sato Y, Takehisa H, Kamatsuki K, et al. 2013. RiceXPro version 3.0: Expanding the informatics resource for rice transcriptome. Nucleic Acids Res, 41: D1206-D1213. |
| [24] | Shen X K, Song S L, Li C, et al. 2022. Synonymous mutations in representative yeast genes are mostly strongly non-neutral. Nature, 606: 725-731. |
| [25] | Sun B, Shen Y J, Chen S, et al. 2023. A novel transcriptional repressor complex MYB22-TOPLESS-HDAC1 promotes rice resistance to brown planthopper by repressing F3′H expression. New Phytol, 239(2): 720-738. |
| [26] | Szemenyei H, Hannon M, Long J A. 2008. TOPLESS mediates auxin-dependent transcriptional repression during Arabidopsis embryogenesis. Science, 319: 1384-1386. |
| [27] | Tamura K, Stecher G, Kumar S. 2021. MEGA11: Molecular evolutionary genetics analysis version 11. Mol Biol Evol, 38(7): 3022-3027. |
| [28] | Wang L, Kim J, Somers D E. 2013. Transcriptional corepressor TOPLESS complexes with pseudoresponse regulator proteins and histone deacetylases to regulate circadian transcription. Proc Natl Acad Sci USA, 110(2): 761-766. |
| [29] | Wang W J, Ye J, Xu H, et al. 2022. OsbHLH061 links TOPLESS/ OPLESS-RELATED repressor proteins with POSITIVE REGULATOR OF IRON HOMEOSTASIS 1 to maintain iron homeostasis in rice. New Phytol, 234(5):1753-1769. |
| [30] | Wei H H, Geng X Y, Zhang X, et al. 2024. Grain yield, biomass accumulation, and leaf photosynthetic characteristics of rice under combined salinity-drought stress. Rice Sci, 31(1): 118-128. |
| [31] | Xing H L, Dong L, Wang Z P, et al. 2014. A CRISPR/Cas9 toolkit for multiplex genome editing in plants. BMC Plant Biol, 14: 327. |
| [32] | Yamada S, Kano A, Tamaoki D, et al. 2012. Involvement of OsJAZ8 in jasmonate-induced resistance to bacterial blight in rice. Plant Cell Physiol, 53(12): 2060-2072. |
| [33] | Yang D L, Li Q, Deng Y W, et al. 2008. Altered disease development in the eui mutants and Eui overexpressors indicates that gibberellins negatively regulate rice basal disease resistance. Mol Plant, 1(3): 528-537. |
| [34] | Yu S, Ren W W, Song C Y, et al. 2025. Global identification and characterization of soybean TPR genes with expression analysis under photoperiod variations. Sci Rep, 15(1): 24644. |
| [35] | Zhan C F, Hu J X, Pang Q, et al. 2019. Genome-wide association analysis of panicle exsertion and uppermost internode in rice (Oryza sativa L.). Rice, 12(1): 72. |
| [36] | Zhan C F, Wu M C, Fang H D, et al. 2023. Characterization of the chemical fungicides-responsive and bacterial pathogen-preventing Bacillus licheniformis in rice spikelet. Food Qual Saf, 7(2): 256-266. |
| [37] | Zhu Z H, Xu F, Zhang Y X, et al. 2010. Arabidopsis resistance protein SNC1 activates immune responses through association with a transcriptional corepressor. Proc Natl Acad Sci USA, 107: 13960-13965. |
| No related articles found! |
| 阅读次数 | ||||||
|
全文 |
|
|||||
|
摘要 |
|
|||||