Rice Science ›› 2016, Vol. 23 ›› Issue (3): 132-143.DOI: 10.1016/j.rsci.2015.11.003
收稿日期:2015-09-11
接受日期:2015-11-13
出版日期:2016-06-08
发布日期:2016-02-04
. [J]. Rice Science, 2016, 23(3): 132-143.
| Treatment | 2010 | 2011 | 2012 | |||||||||
|---|---|---|---|---|---|---|---|---|---|---|---|---|
| N | P2O5 | K2O | N | P2O5 | K2O | N | P2O5 | K2O | ||||
| MRR | 122.7 | 72 | 180 | 86.7 | 72 | 180 | 119.6 | 72 | 180 | |||
| FRR | 180 | 72 | 180 | 180 | 72 | 180 | 180 | 72 | 180 | |||
Table 1 Chemical fertilizer application of different treatments on early rice. kg/hm2
| Treatment | 2010 | 2011 | 2012 | |||||||||
|---|---|---|---|---|---|---|---|---|---|---|---|---|
| N | P2O5 | K2O | N | P2O5 | K2O | N | P2O5 | K2O | ||||
| MRR | 122.7 | 72 | 180 | 86.7 | 72 | 180 | 119.6 | 72 | 180 | |||
| FRR | 180 | 72 | 180 | 180 | 72 | 180 | 180 | 72 | 180 | |||
| Year | Season | Sowing date | Transplanting date |
|---|---|---|---|
| (Month-Day) | (Month-Day) | ||
| 2010 | Early rice | 3月27日 | 4月27日 |
| Late rice | 6月26日 | 7月25日 | |
| 2011 | Early rice | 3月28日 | 4月28日 |
| Late rice | 6月29日 | 7月30日 | |
| 2012 | Early rice | 3月25日 | 4月26日 |
| Late rice | 6月25日 | 7月26日 |
Table 2 Sowing and transplanting time of early and late rice.
| Year | Season | Sowing date | Transplanting date |
|---|---|---|---|
| (Month-Day) | (Month-Day) | ||
| 2010 | Early rice | 3月27日 | 4月27日 |
| Late rice | 6月26日 | 7月25日 | |
| 2011 | Early rice | 3月28日 | 4月28日 |
| Late rice | 6月29日 | 7月30日 | |
| 2012 | Early rice | 3月25日 | 4月26日 |
| Late rice | 6月25日 | 7月26日 |
| Year | Season | Treatment | Yield (kg/hm2) | PN (× 104/hm2) | SPP | SSR (%) | TGW (g) |
|---|---|---|---|---|---|---|---|
| 2010 | Early rice | MRR | 7 653 ± 104 a | 397 ± 8.7 a | 130 ± 3.2 a | 77.0 ± 2.1 b | 27.9 ± 0.4 a |
| FRR | 7 416 ± 119 a | 342 ± 12.9 b | 128 ± 4.9 a | 87.0 ± 4.6 a | 27.4 ± 2.8 a | ||
| Late rice | MRR | 7 970 ± 134 a | 283 ± 9.1 a | 151 ± 2.9 a | 82.2 ± 1.3 a | 22.2 ± 0.1 a | |
| FRR | 7 654 ± 69 b | 287 ± 5.3 a | 147 ± 4.8 a | 85.4 ± 2.8 a | 20.4 ± 0.3 a | ||
| 2011 | Early rice | MRR | 8 588 ± 159 a | 464 ± 18.4 a | 94 ± 1.7 a | 93.0 ± 1.7 b | 28.5 ± 0.9 a |
| FRR | 8 459 ± 102 a | 430 ± 7.2 b | 93 ± 1.8 a | 96.1 ± 2.7 a | 29.0 ± 3.6 a | ||
| Late rice | MRR | 9 783 ± 120 a | 421 ± 3.3 a | 165 ± 8.1 a | 73.8 ± 0.2 b | 23.5 ± 0.3 a | |
| FRR | 9 353 ± 66 b | 401 ± 5.3 b | 153 ± 1.4 b | 75.7 ± 1.5 a | 23.6 ± 0.2 a | ||
| 2012 | Early rice | MRR | 9 437 ± 102 a | 391 ± 5.3 a | 110 ± 2.1 a | 84.5 ± 1.1 b | 29.1 ± 0.1 a |
| FRR | 8 162 ± 78 b | 337 ± 7.3 b | 101 ± 2.1 b | 88.2 ± 1.3 a | 29.1 ± 0.1 a | ||
| Late rice | MRR | 10 079 ± 110 a | 393 ± 4.2 a | 114 ± 3.3 a | 82.8 ± 2.4 b | 22.9 ± 1.0 a | |
| FRR | 8 281 ± 87 b | 373 ± 8.2 b | 102 ± 1.9 b | 86.7 ± 1.7 a | 22.4 ± 2.4 a |
Table 3 Rice yield and yield components of different treatments (Mean ± SD, n = 3).
| Year | Season | Treatment | Yield (kg/hm2) | PN (× 104/hm2) | SPP | SSR (%) | TGW (g) |
|---|---|---|---|---|---|---|---|
| 2010 | Early rice | MRR | 7 653 ± 104 a | 397 ± 8.7 a | 130 ± 3.2 a | 77.0 ± 2.1 b | 27.9 ± 0.4 a |
| FRR | 7 416 ± 119 a | 342 ± 12.9 b | 128 ± 4.9 a | 87.0 ± 4.6 a | 27.4 ± 2.8 a | ||
| Late rice | MRR | 7 970 ± 134 a | 283 ± 9.1 a | 151 ± 2.9 a | 82.2 ± 1.3 a | 22.2 ± 0.1 a | |
| FRR | 7 654 ± 69 b | 287 ± 5.3 a | 147 ± 4.8 a | 85.4 ± 2.8 a | 20.4 ± 0.3 a | ||
| 2011 | Early rice | MRR | 8 588 ± 159 a | 464 ± 18.4 a | 94 ± 1.7 a | 93.0 ± 1.7 b | 28.5 ± 0.9 a |
| FRR | 8 459 ± 102 a | 430 ± 7.2 b | 93 ± 1.8 a | 96.1 ± 2.7 a | 29.0 ± 3.6 a | ||
| Late rice | MRR | 9 783 ± 120 a | 421 ± 3.3 a | 165 ± 8.1 a | 73.8 ± 0.2 b | 23.5 ± 0.3 a | |
| FRR | 9 353 ± 66 b | 401 ± 5.3 b | 153 ± 1.4 b | 75.7 ± 1.5 a | 23.6 ± 0.2 a | ||
| 2012 | Early rice | MRR | 9 437 ± 102 a | 391 ± 5.3 a | 110 ± 2.1 a | 84.5 ± 1.1 b | 29.1 ± 0.1 a |
| FRR | 8 162 ± 78 b | 337 ± 7.3 b | 101 ± 2.1 b | 88.2 ± 1.3 a | 29.1 ± 0.1 a | ||
| Late rice | MRR | 10 079 ± 110 a | 393 ± 4.2 a | 114 ± 3.3 a | 82.8 ± 2.4 b | 22.9 ± 1.0 a | |
| FRR | 8 281 ± 87 b | 373 ± 8.2 b | 102 ± 1.9 b | 86.7 ± 1.7 a | 22.4 ± 2.4 a |
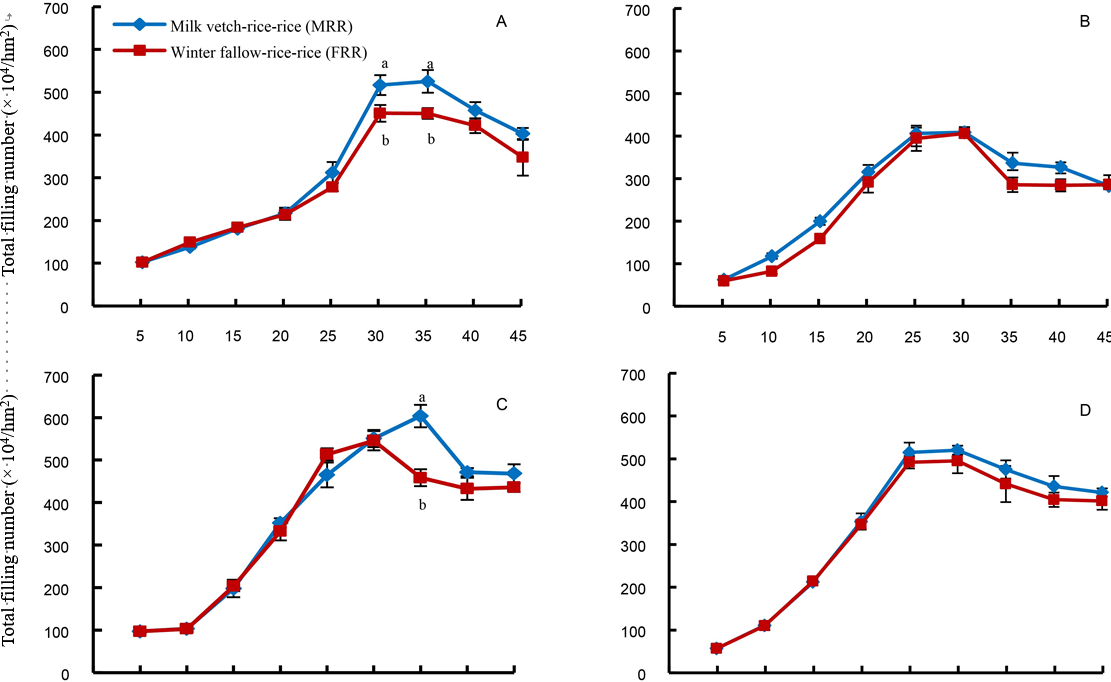
Fig. 1. Total tillering number of rice.A, Early rice in 2010; B, Late rice in 2010; C, Early rice in 2011; D, Late rice in 2011. ANOVA was conducted among different treatments at the same growth stage. Vertical error bars are the standard error of means (n = 4). Different lowercase letters indicate significance at the 0.05 level.
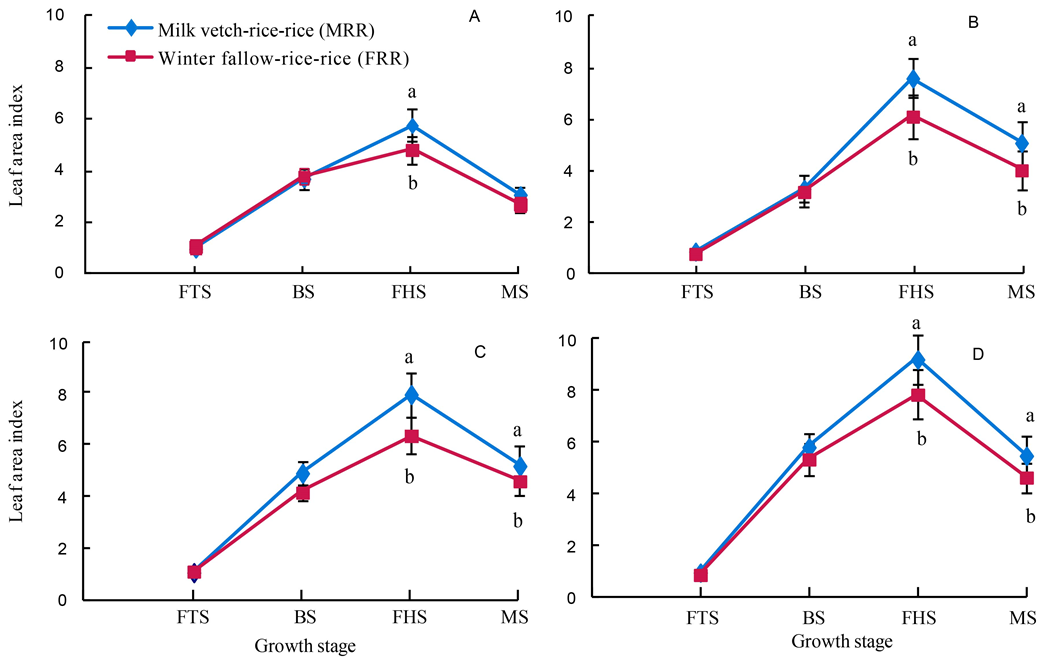
Fig. 2. Dynamics of rice leaf area index.A, Early rice in 2010; B, Late rice in 2010; C, Early rice in 2011; D, Late rice in 2011. FTS, Full tillering stage; BS, Booting stage; FHS, Full heading stage; MS, Maturity stage.ANOVA was conducted among different treatments at the same growth stage. Vertical error bars are the standard error of means (n = 4). Different lowercase letters indicate significance at the 0.05 level.
| Season | Treatment | FTS | BS | FHS | ||||||||||||
|---|---|---|---|---|---|---|---|---|---|---|---|---|---|---|---|---|
| R/S | RDW (g/hill) | R/S | RDW (g/hill) | R/S | RDW (g/hill) | |||||||||||
| Early rice | MRR | 0.26 ± 0.02 a | 0.58 ± 0.06 b | 0.19 ± 0.03 a | 2.36 ± 0.25 a | 0.27 ± 0.01 a | 5.58 ± 0.82 a | |||||||||
| FRR | 0.30 ± 0.03 a | 0.72 ± 0.04 a | 0.20 ± 0.01 a | 2.22 ± 0.29 a | 0.15 ± 0.01 b | 4.49 ± 0.28 b | ||||||||||
| Late rice | MRR | 0.19 ± 0.02 a | 1.34 ± 0.13 a | 0.15 ± 0.02 a | 2.56 ± 0.23 a | 0.23 ± 0.01 a | 5.63 ± 0.35 a | |||||||||
| FRR | 0.19 ± 0.01 a | 1.25 ± 0.08 a | 0.14 ± 0.01 a | 2.25 ± 0.18 a | 0.12 ± 0.02 b | 4.89 ± 0.34 b | ||||||||||
Table 4 Root/shoot ratio and dry weight of single hill rice root in different treatments in 2010 (Mean ± SD, n = 3).
| Season | Treatment | FTS | BS | FHS | ||||||||||||
|---|---|---|---|---|---|---|---|---|---|---|---|---|---|---|---|---|
| R/S | RDW (g/hill) | R/S | RDW (g/hill) | R/S | RDW (g/hill) | |||||||||||
| Early rice | MRR | 0.26 ± 0.02 a | 0.58 ± 0.06 b | 0.19 ± 0.03 a | 2.36 ± 0.25 a | 0.27 ± 0.01 a | 5.58 ± 0.82 a | |||||||||
| FRR | 0.30 ± 0.03 a | 0.72 ± 0.04 a | 0.20 ± 0.01 a | 2.22 ± 0.29 a | 0.15 ± 0.01 b | 4.49 ± 0.28 b | ||||||||||
| Late rice | MRR | 0.19 ± 0.02 a | 1.34 ± 0.13 a | 0.15 ± 0.02 a | 2.56 ± 0.23 a | 0.23 ± 0.01 a | 5.63 ± 0.35 a | |||||||||
| FRR | 0.19 ± 0.01 a | 1.25 ± 0.08 a | 0.14 ± 0.01 a | 2.25 ± 0.18 a | 0.12 ± 0.02 b | 4.89 ± 0.34 b | ||||||||||
| Year | Season | Treatment | Root dry weight in different soil layer depth (g/hill) | Total root dry weight | |||
|---|---|---|---|---|---|---|---|
| 0-5 cm | 5-10 cm | 10-20 cm | (g/hill) | ||||
| 2010 | Early rice | MRR | 3.72 ± 0.04 a | 3.35 ± 0.04 a | 0.59 ± 0.03 a | 7.66 ± 0.05 a | |
| FRR | 2.82 ± 0.05 b | 2.58 ± 0.03 b | 0.19 ± 0.08 b | 5.59 ± 0.03 b | |||
| Late rice | MRR | 3.63 ± 0.04 a | 3.64 ± 0.07 a | 0.54 ± 0.05 a | 7.81 ± 0.10 a | ||
| FRR | 2.83 ± 0.21 b | 2.84 ± 0.08 b | 0.24 ± 0.08 b | 5.91 ± 0.26 b | |||
| 2011 | Early rice | MRR | 3.88 ± 0.09 a | 3.93 ± 0.06 a | 0.52 ± 0.01 a | 8.33 ± 0.03 a | |
| FRR | 3.05 ± 0.06 b | 2.96 ± 0.18 b | 0.33 ± 0.04 b | 6.34 ± 0.14 b | |||
| Late rice | MRR | 3.91 ± 0.07 a | 4.02 ± 0.04 a | 0.61 ± 0.03 a | 8.54 ± 0.25 a | ||
| FRR | 3.08 ± 0.04 b | 3.11 ± 0.04 b | 0.37 ± 0.04 b | 6.56 ± 0.07 b | |||
Table 5 Root dry weight of rice at the maturity stage in various soil layers of different treatments in 2010 and 2011 (Mean ± SD, n = 3).
| Year | Season | Treatment | Root dry weight in different soil layer depth (g/hill) | Total root dry weight | |||
|---|---|---|---|---|---|---|---|
| 0-5 cm | 5-10 cm | 10-20 cm | (g/hill) | ||||
| 2010 | Early rice | MRR | 3.72 ± 0.04 a | 3.35 ± 0.04 a | 0.59 ± 0.03 a | 7.66 ± 0.05 a | |
| FRR | 2.82 ± 0.05 b | 2.58 ± 0.03 b | 0.19 ± 0.08 b | 5.59 ± 0.03 b | |||
| Late rice | MRR | 3.63 ± 0.04 a | 3.64 ± 0.07 a | 0.54 ± 0.05 a | 7.81 ± 0.10 a | ||
| FRR | 2.83 ± 0.21 b | 2.84 ± 0.08 b | 0.24 ± 0.08 b | 5.91 ± 0.26 b | |||
| 2011 | Early rice | MRR | 3.88 ± 0.09 a | 3.93 ± 0.06 a | 0.52 ± 0.01 a | 8.33 ± 0.03 a | |
| FRR | 3.05 ± 0.06 b | 2.96 ± 0.18 b | 0.33 ± 0.04 b | 6.34 ± 0.14 b | |||
| Late rice | MRR | 3.91 ± 0.07 a | 4.02 ± 0.04 a | 0.61 ± 0.03 a | 8.54 ± 0.25 a | ||
| FRR | 3.08 ± 0.04 b | 3.11 ± 0.04 b | 0.37 ± 0.04 b | 6.56 ± 0.07 b | |||
| Year | Season | Treatment | Transportation ratio of dry matter (%) | Transformation ratio of dry matter (%) | Photosynthetic potential | Photosynthetic potential/grain | Grain/leaf area | Total sink capacity | ||||||
|---|---|---|---|---|---|---|---|---|---|---|---|---|---|---|
| (× 104∙m2∙d) | ratio (m2∙d/grain) | ratio (grain/cm2) | (t/hm2) | |||||||||||
| 2010 | Early rice | MRR | 33.5 ± 2.9 a | 36.6 ± 0.3 a | 7.19 ± 1.92 a | 20.98 ± 2.33 a | 0.77 ± 0.04 b | 14.36 ± 0.99 a | ||||||
| FRR | 33.0 ± 1.8 a | 35.5 ± 0.6 b | 6.06 ± 1.06 b | 20.72 ± 1.77 a | 0.91 ± 0.01 a | 12.03 ± 0.65 b | ||||||||
| Late rice | MRR | 32.7 ± 2.3 a | 37.7 ± 1.0 a | 10.12 ± 1.25 a | 35.50 ± 1.01 a | 0.57 ± 0.01 b | 9.51 ± 0.76 a | |||||||
| FRR | 30.3 ± 1.2 b | 36.3 ± 0.8 b | 8.42 ± 0.90 b | 29.94 ± 0.78 b | 0.68 ± 0.02 a | 8.59 ± 0.65 b | ||||||||
| 2011 | Early rice | MRR | 39.0 ± 1.4 a | 41.0 ± 2.7 a | 9.44 ± 0.56 a | 32.46 ± 0.25 a | 0.61 ± 0.00 a | 12.44 ± 0.19 a | ||||||
| FRR | 36.8 ± 2.1 b | 35.0 ± 2.4 b | 8.26 ± 1.03 b | 31.10 ± 0.29 b | 0.64 ± 0.01 a | 11.56 ± 0.20 a | ||||||||
| Late rice | MRR | 34.2 ± 2.6 a | 39.4 ± 4.2 a | 11.98 ± 1.16 a | 25.80 ± 2.34 a | 0.71 ± 0.03 a | 16.33 ± 1.44 a | |||||||
| FRR | 29.1 ± 3.1 b | 32.7 ± 4.9 b | 10.48 ± 1.26 b | 25.63 ± 1.18 a | 0.75 ± 0.05 a | 14.46 ± 0.98 b | ||||||||
Table 6 Transformation ratio of dry matter in clum and leaves and sink-source characteristics under different treatments from full heading to maturity stage of rice in 2010 and 2011 (Mean ± SD, n = 3).
| Year | Season | Treatment | Transportation ratio of dry matter (%) | Transformation ratio of dry matter (%) | Photosynthetic potential | Photosynthetic potential/grain | Grain/leaf area | Total sink capacity | ||||||
|---|---|---|---|---|---|---|---|---|---|---|---|---|---|---|
| (× 104∙m2∙d) | ratio (m2∙d/grain) | ratio (grain/cm2) | (t/hm2) | |||||||||||
| 2010 | Early rice | MRR | 33.5 ± 2.9 a | 36.6 ± 0.3 a | 7.19 ± 1.92 a | 20.98 ± 2.33 a | 0.77 ± 0.04 b | 14.36 ± 0.99 a | ||||||
| FRR | 33.0 ± 1.8 a | 35.5 ± 0.6 b | 6.06 ± 1.06 b | 20.72 ± 1.77 a | 0.91 ± 0.01 a | 12.03 ± 0.65 b | ||||||||
| Late rice | MRR | 32.7 ± 2.3 a | 37.7 ± 1.0 a | 10.12 ± 1.25 a | 35.50 ± 1.01 a | 0.57 ± 0.01 b | 9.51 ± 0.76 a | |||||||
| FRR | 30.3 ± 1.2 b | 36.3 ± 0.8 b | 8.42 ± 0.90 b | 29.94 ± 0.78 b | 0.68 ± 0.02 a | 8.59 ± 0.65 b | ||||||||
| 2011 | Early rice | MRR | 39.0 ± 1.4 a | 41.0 ± 2.7 a | 9.44 ± 0.56 a | 32.46 ± 0.25 a | 0.61 ± 0.00 a | 12.44 ± 0.19 a | ||||||
| FRR | 36.8 ± 2.1 b | 35.0 ± 2.4 b | 8.26 ± 1.03 b | 31.10 ± 0.29 b | 0.64 ± 0.01 a | 11.56 ± 0.20 a | ||||||||
| Late rice | MRR | 34.2 ± 2.6 a | 39.4 ± 4.2 a | 11.98 ± 1.16 a | 25.80 ± 2.34 a | 0.71 ± 0.03 a | 16.33 ± 1.44 a | |||||||
| FRR | 29.1 ± 3.1 b | 32.7 ± 4.9 b | 10.48 ± 1.26 b | 25.63 ± 1.18 a | 0.75 ± 0.05 a | 14.46 ± 0.98 b | ||||||||
| Year | Season | Treatment | SRBHS | SRBDAH | Nutrient uptake | ||
|---|---|---|---|---|---|---|---|
| (mg/h) | (mg/h) | N | P2O5 | K2O | |||
| 2010 | Early rice | MRR | 1.28 ± 0.04 a | 0.67 ± 0.05 a | 167 ± 5.5 a | 50 ± 1.7 a | 196 ± 5.8 a |
| FRR | 1.22 ± 0.01 a | 0.58 ± 0.03 b | 138 ± 3.1 b | 44 ± 1.9 b | 172 ± 4.8 b | ||
| Late rice | MRR | 1.02 ± 0.05 a | 0.57 ± 0.03 a | 177 ± 3.9 a | 51 ± 1.3 a | 227 ± 7.2 a | |
| FRR | 0.96 ± 0.06 a | 0.47 ± 0.04 b | 158 ± 2.1 b | 46 ± 2.1 b | 207 ± 4.9 b | ||
| 2011 | Early rice | MRR | 1.88 ± 0.10 a | 1.29 ± 0.12 a | 237 ± 6.5 a | 57 ± 2.6 a | 288 ± 8.1 a |
| FRR | 1.73 ± 0.20 a | 1.02 ± 0.13 b | 211 ± 4.9 b | 51 ± 1.5 b | 258 ± 4.9 b | ||
| Late rice | MRR | 1.18 ± 0.03 a | 0.80 ± 0.01 a | 218 ± 4.3 a | 57 ± 1.8 a | 278 ± 5.1 a | |
| FRR | 1.14 ± 0.03 a | 0.73 ± 0.02 b | 184 ± 3.4 b | 52 ± 1.2 b | 233 ± 6.8 b | ||
Table 7 Spikelet-root bleeding intensity under different treatments in 2010 and 2011 (Mean ± SD, n = 3).
| Year | Season | Treatment | SRBHS | SRBDAH | Nutrient uptake | ||
|---|---|---|---|---|---|---|---|
| (mg/h) | (mg/h) | N | P2O5 | K2O | |||
| 2010 | Early rice | MRR | 1.28 ± 0.04 a | 0.67 ± 0.05 a | 167 ± 5.5 a | 50 ± 1.7 a | 196 ± 5.8 a |
| FRR | 1.22 ± 0.01 a | 0.58 ± 0.03 b | 138 ± 3.1 b | 44 ± 1.9 b | 172 ± 4.8 b | ||
| Late rice | MRR | 1.02 ± 0.05 a | 0.57 ± 0.03 a | 177 ± 3.9 a | 51 ± 1.3 a | 227 ± 7.2 a | |
| FRR | 0.96 ± 0.06 a | 0.47 ± 0.04 b | 158 ± 2.1 b | 46 ± 2.1 b | 207 ± 4.9 b | ||
| 2011 | Early rice | MRR | 1.88 ± 0.10 a | 1.29 ± 0.12 a | 237 ± 6.5 a | 57 ± 2.6 a | 288 ± 8.1 a |
| FRR | 1.73 ± 0.20 a | 1.02 ± 0.13 b | 211 ± 4.9 b | 51 ± 1.5 b | 258 ± 4.9 b | ||
| Late rice | MRR | 1.18 ± 0.03 a | 0.80 ± 0.01 a | 218 ± 4.3 a | 57 ± 1.8 a | 278 ± 5.1 a | |
| FRR | 1.14 ± 0.03 a | 0.73 ± 0.02 b | 184 ± 3.4 b | 52 ± 1.2 b | 233 ± 6.8 b | ||
| [1] | Asagi N, Ueno H.2009. Nitrogen dynamics in paddy soil applied with various 15N-labelled green manures.Plant Soil, 322: 251-262. |
| [2] | Ashraf M, Mahmood T, Azam F, Qureshi R M.2004. Comparative effects of applying leguminous and nonleguminous green manures and inorganic N on biomass yield and nitrogen uptake in flooded rice (Oryza sativa L.).Biol Fert Soils, 40(2): 147-152. |
| [3] | Belefant-Miller H.2007. Poultry litter induces tillering in rice.J Sustain Agric, 31(1): 151-160. |
| [4] | Bremner J M, Mulvaney C S.1982. Nitrogen-total. In: Page A L. Methods of Soil Analysis: II. Madison, Wisconsin, USA: American Society of Agronomy: 595-624. |
| [5] | Budhar M N, Palaniappan S P.1996. Effect of integration of fertilizer and green manure nitrogen on yield attributes, nitrogen uptake and yield of lowland rice (Oryza sativa L.).J Agron Crop Sci, 176: 183-187. |
| [6] | Cao S Q, Zhang R X, Tang Y L, Yang T N.2002. A new index for identifying the relationship between leaf photosynthesis and grain filling in grain filling stage of rice.Acta Agron Sin, 28: 516-520. (in Chinese with English abstract) |
| [7] | Cassman K G, Pingali P L.1995. Extrapolating trends from long-term experiments to farmers’ fields: The case of irrigated rice system in Asia. In: Barnett V, Payne R, Steiner R. Agricultural Sustainability: Economic, Environmental and Statistical Considerations. New York, USA: John Wiley & Sons: 63-84. |
| [8] | Chang H L, Park K D, Jung K Y, Muhammad A A, Dokyoung L, Gutierrez J, Kim P J.2010. Effect of Chinese milk vetch (Astragalus sinicus L.) as a green manure on rice productivity and methane emission in paddy soil.Agr Ecosyst Environ, 138: 343-347. |
| [9] | Cherr C M, Avila L, Scholberg J M S, McSorley R.2006. Effects of green manure use on sweet corn root length density under reduced tillage conditions.Renew Agric Food Syst, 21(3): 165-173. |
| [10] | Clement A, Ladha J K, Chalifour F P.1998. Nitrogen dynamics of various green manure species and the relationship to lowland rice production. Agron J, 90(2): 149-155. |
| [11] | Deng M H, Shi X J, Tian Y H, Yin B, Zhang S L, Zhu Z L, Kimura S D.2012. Optimizing nitrogen fertilizer application for rice production in the Taihu Lake region, China.Pedosphere, 22(1): 48-57. |
| [12] | Dobermann A, Witt C, Dawe D, Abdulrachman S, Gines H C, Nagarajan R, Satawathananont S, Son T T, Tan P S, Wang G H, Chien N V, Thoa V T K, Phung C V, Stalin P, Muthukrishnan P, Ravi V, Babu M, Chatuporn S, Sookthongsa J, Sun Q, Fu R, Simbahan G C, Adviento M A A.2002. Site-specific nutrient management for intensive rice cropping systems in Asia.Field Crops Res, 74(1): 37-66. |
| [13] | Fageria N K, Baligar V C.2001. Lowland rice response to nitrogen fertilization.Commun Soil Sci Plan, 32: 1405-1429. |
| [14] | Fageria N K, Baligar V C, Bailey B A.2005. Role of cover crops in improving soil and row crop productivity.Commun Soil Sci Plant, 36: 2733-2757. |
| [15] | Fageria N K.2007. Green manuring in crop production.J Plant Nutr, 30(5): 691-719. |
| [16] | Gabriel J L, Quemada M.2011. Replacing bare fallow with cover crops in a maize cropping system: Yield, N uptake and fertilizer fate.Eur J Agric, 34(3): 133-143. |
| [17] | Gao J S, Cao W D, Dong C H, Xu M G, Zeng X B, Wen S L.2010. Effects of long-term rice-rice-green manure rotation on rice yield.Chin J Rice Sci, 24(6): 672-676. (in Chinese with English abstract) |
| [18] | Godfray H C J, Beddington J R, Crute I R, Haddad L, Lawrence D, Muir J F, Pretty J, Robinson S, Thomas S M, Toulmin C.2010. Food security: The challenge of feeding 9 billion people.Science, 327: 812-818. |
| [19] | Guo J H, Liu X J, Zhang Y, Shen J L, Han W X, Zhang W F, Christie P, Goulding K W T, Vitousek P M, Zhang F S.2010. Significant acidification in major Chinese croplands.Science, 327: 1008-1010. |
| [20] | Hartwig N L, Ammon H U.2002. Cover crop and living mulches.Weed Sci, 50: 688-699. |
| [21] | Hasanuzzaman M, Ahamed K U, Rahmatullah N M, Akhter N, Nahar K, Rahman M L.2010. Plant growth characters and productivity of wetland rice (Oryza sativa L.) as affected by application of different manures.Emir J Food Agric, 22(1): 46-58. |
| [22] | Huang J, Gao J S, Liu S J, Cao W D, Zhang Y Z.2013. Effect of Chinese milk vetch in winter on rice yield and its nutrient uptake.Soil Fert Sci China, 1: 88-92. (in Chinese with English abstract) |
| [23] | Latt Y K, Myint A K, Yamakawa T, Ogata K.2009. The effects of green manure (Sesbania rostrata) on the growth and yield of rice.J Fac Agric Kyushu Univ, 54(2): 313-319. |
| [24] | Lemaire G, Gastal F.1997. Nitrogen uptake and distribution in plant canopies. In: Lemaire G. Diagnosis of the Nitrogen Status in Crops. Berlin: Springer-Verlag: 3-43. |
| [25] | Li D Q, Tang Q Y, Zhang Y B, Qin J Q, Li H, Chen L Q, Yang S H, Zou Y B, Peng S B.2012. Effect of nitrogen regimes on grain yield, nitrogen utilization, radiation use efficiency, and sheath blight disease intensity in super hybrid rice.J Integr Agric, 11(1): 134-143. |
| [26] | Li S L, Li D R, Hu C, Qiao Y, Li S B, Chen Y F.2012. Impact of reducing chemical fertilizer combined with Chinese milk vetch on growth and yield of double cropping rice.Soil Fert Sci Chin, 1: 69-73. (in Chinese with English abstract) |
| [27] | Miao Y X, Stewart B A, Zhang F S.2011. Long-term experiments for sustainable nutrient management in China.Agron Sustain Dev, 31: 397-414. |
| [28] | Nziguheba G, Merckx R, Palm C A, Mutuo P.2002. Combining Tithonia diversifolia and fertilizers for maize production in a phosphorus deficient soil in Kenya.Agroforestry Syst, 55(3): 165-174. |
| [29] | Peng S B, Buresh R J, Huang J L, Yang J C, Zou Y B, Zhong X H, Wang G H, Zhang F S.2006. Strategies for overcoming low agronomic nitrogen use efficiency in irrigated rice systems in China.Field Crops Res, 96(1): 37-47. |
| [30] | Peng S B, Huang J L, Zhong X H, Yang J C, Wang G H, Zou Y B, Zhang F S, Zhu Q S, Buresh R, Witt C.2002. Research strategy in improving nitrogen use efficiency of irrigated rice in China.Sci Agric Sin, 35(9): 1095-1103. (in Chinese with English abstract) |
| [31] | Peng S B, Huang J L, Zhong X H, Yang J C, Wang G H, Zou Y B, Zhang F S, Zhu Q S, Buresh R, Witt C.2002. Research strategy in improving nitrogen use efficiency of irrigated rice in China.Sci Agric Sin, 35(9): 1095-1103. (in Chinese with English abstract) |
| [32] | Peng X L, Liu Y Y, Luo S G, Fan L C, Song T X, Guo Y W.2007. Effects of site-specific nitrogen management on yield and dry matter accumulation of rice from cold areas of northeastern China.Agric Sci China, 6(6): 715-723. |
| [33] | Phiri S, Rao I M, Barrios E, Singh B R.2003. Plant growth, mycorrhizal association, nutrient uptake and phosphorus dynamics in a volcanic ash soil in Colombia as affected by the establishment of Tithonia diversifolia.J Sustain Agric, 21(3): 41-59. |
| [34] | Sangakkara U R, Liedgens M, Soldati A, Stamp P.2004. Root and shoot growth of maize (Zea mays) as affected by incorporation of Crotalaria juncea and Tithonia diversifolia as green manures.J Agron Crop Sci, 190: 339-346. |
| [35] | Shahidullah S M, Musa M H, Ashrafuzzaman M, Ismail M R, Salam M A.2009. Tillering dynamics in aromatic rice genotypes.Int J Agric Biol, 11(5): 509-514. |
| [36] | Sharma R K, Chauhan D S, Nagarajan S.1999. Current status of crop response to fertilisers in different agro-climatic regions- experience of the all India coordinated rice improvement project.Fert News, 44: 39-43. |
| [37] | Sheehy J E, Dionora M J A, Mitchell P L.2001. Spikelet numbers, sink size and potential yield in rice.Field Crops Res, 71(2): 77-85. |
| [38] | Siavoshi M, Laware S L, Laware S L.2011. Effect of organic fertilizer on growth and yield components in rice (Oryza sativa L.).J Agric Sci, 3(3): 217. |
| [39] | Singh Y, Khind C S, Singh B.1991. Efficient management of leguminous green manures in wetland rice.Adv Agron, 45: 135-189. |
| [40] | Tilman D, Fargione J, Wolff B, D’Antonio C, Dobson A, Howarth R, Schindler D, Schlesinger W H, Simberloff D, Swackhamer D.2001. Forecasting agriculturally driven global environmental change.Science, 292: 281-284. |
| [41] | Walinga I, Houba V J G, Novozamsky I.1995. Plant Analysis Manual. Netherlands: Kluwer Academic Publisher: 255-256. |
| [42] | Wang F, Zhang G P, Bai P.2005. Achievement and prospects of research on evaluation of the relationship between source and sink in rice.Chin J Rice Sci, 19(6): 556-560. (in Chinese with English abstract) |
| [43] | Xu G W, Yang L N, Zhang H, Wang Z Q, Liu L J, Yang J C.2008. Absorption and utilization of nitrogen, phosphorus, and potassium in rice plants under site-specific nitrogen management and wheat-residue incorporation.Acta Agron Sin, 34(8): 1424-1434. |
| [44] | Yan J, Yu J, Tao G C, Vos J, Bouman B A M, Xie G H, Meinke H.2010. Yield formation and tillering dynamics of direct-seeded rice in flooded and nonflooded soils in the Huai River Basin of China.Field Crops Res, 116(3): 252-259. |
| [45] | Yang J C, Zhu Q S, Wang Z Q, Lang Y Z.1997. Photosynthetic characteristics, dry matter accumulation and its translocation in intersubspecific hybrid rice.Acta Agron Sin, 23(1): 82-88. (in Chinese with English abstract) |
| [46] | Yang Z P, Xu M G, Zheng S X, Nie J, Gao J S, Liao Y L, Xie J .2012. Effects of long-term winter planted green manure on physical properties of reddish paddy soil under a double-rice cropping system.J Integr Agric, 11(4): 655-664. |
| [47] | Yuan M M, Liu Q, Zhang S L, Chen W R, Yu H S.2011. Effects of biological nitrogen fixation and plow-down of green manure crop on rice yield and soil nitrogen in paddy field.Acta Pedol Sin, 48: 797-803. (in Chinese with English abstract) |
| [48] | Zeng X M, Han B J, Xu F S, Huang J L, Cai H M, Shi L.2012. Effects of modified fertilization technology on the grain yield and nitrogen use efficiency of midseason rice.Field Crops Res, 137(20): 203-212. |
| [49] | Zhang Q F.2007. Strategies for developing Green Super Rice.Proc Natl Acad Sci USA, 104: 16402-16409. |
| No related articles found! |
| 阅读次数 | ||||||
|
全文 |
|
|||||
|
摘要 |
|
|||||