Rice Science ›› 2023, Vol. 30 ›› Issue (5): 486-498.DOI: 10.1016/j.rsci.2023.04.004
• • 上一篇
收稿日期:2022-11-01
接受日期:2023-04-23
出版日期:2023-09-28
发布日期:2023-08-14
. [J]. Rice Science, 2023, 30(5): 486-498.
| Element | Certified value (mg/kg) | Measured value b (mg/kg) | Recovery (%) | RSD c (%) | LOD d (mg/kg) | |
|---|---|---|---|---|---|---|
| NRC PACS-2 marine sediment | ||||||
| Al | 66 200 ± 3 200 | 66 700 ± 2 200 | 101 | 3.3 | 150 | |
| As | 26.2 ± 1.5 | 25.5 ± 1.8 | 97 | 6.9 | 0.5 | |
| Cl | 30 000 a | 30 000 ± 900 | 99 | 3.1 | 40 | |
| K | 12 400 ± 11 | 12 700 ± 600 | 102 | 4.8 | 1 000 | |
| Mg | 14 700 ± 1 300 | 14 600 ± 900 | 100 | 6.5 | 800 | |
| Mn | 440 ± 19 | 440 ± 15 | 100 | 3.4 | 10 | |
| Sb | 11.3 ± 2.6 | 11.8 ± 0.7 | 104 | 6.1 | 0.5 | |
| NIST 1646a estuarine sediment | ||||||
| Ba | 210 a | 210 ± 20 | 102 | 11.0 | 10 | |
| Ca | 5 190 ± 200 | 5 300 ± 200 | 102 | 4.4 | 300 | |
| Co | 5 a | 5.0 ± 0.2 | 99 | 3.8 | 0.1 | |
| Fe | 20 080 ± 390 | 20 270 ± 870 | 101 | 4.3 | 10 | |
| La | 17 a | 18 ± 1 | 105 | 3.8 | 0.5 | |
| Na | 7 410 ± 170 | 7 730 ± 160 | 104 | 2.0 | 10 | |
| Rb | 38 a | 36 ± 2 | 95 | 4.7 | 10 | |
| Ti | 4 560 ± 210 | 4 620 ± 300 | 101 | 6.5 | 50 | |
| Zn | 48.9 ± 1.6 | 49.0 ± 3.0 | 100 | 6.2 | 10 | |
| IAEA-SL-2 lake sediment | ||||||
| Cr | 104 ± 9 | 100 ± 6 | 96 | 6.5 | 3 | |
| Cs | 7.0 ± 0.9 | 7.0 ± 0.2 | 96 | 2.8 | 0.05 | |
| Eu | 1.6 ± 0.5 | 1.6 ± 0.2 | 102 | 8.4 | 0.05 | |
| Ga | 23.7 ± 5.1 | 24.0 ± 2.0 | 101 | 8.4 | 1.0 | |
| Hf | 4.2 ± 0.6 | 4.5 ± 0.2 | 108 | 5.0 | 0.2 | |
| Lu | 0.54 ± 0.13 | 0.48 ± 0.10 | 90 | 8.7 | 0.05 | |
| Sc | 17.3 ± 1.1 | 16.7 ± 0.7 | 97 | 4.0 | 0.05 | |
| Sm | 9.25 ± 0.51 | 9.31 ± 0.26 | 101 | 2.8 | 0.03 | |
| Th | 14.0 ± 1.0 | 14.0 ± 0.4 | 101 | 2.2 | 0.2 | |
| U | 4.02 ± 0.33 | 4.01 ± 0.37 | 100 | 9.2 | 0.1 | |
| V | 170 ± 15 | 170 ± 9 | 98 | 5.2 | 0.1 | |
| Yb | 3.42 ± 0.73 | 3.50 ± 0.31 | 102 | 8.9 | 0.15 | |
| IAEA soil-7 | ||||||
| Br | 7.0 a | 7.0 ± 0.4 | 101 | 5.3 | 0.5 | |
Table 1. Comparison between certified and measured values of reference materials.
| Element | Certified value (mg/kg) | Measured value b (mg/kg) | Recovery (%) | RSD c (%) | LOD d (mg/kg) | |
|---|---|---|---|---|---|---|
| NRC PACS-2 marine sediment | ||||||
| Al | 66 200 ± 3 200 | 66 700 ± 2 200 | 101 | 3.3 | 150 | |
| As | 26.2 ± 1.5 | 25.5 ± 1.8 | 97 | 6.9 | 0.5 | |
| Cl | 30 000 a | 30 000 ± 900 | 99 | 3.1 | 40 | |
| K | 12 400 ± 11 | 12 700 ± 600 | 102 | 4.8 | 1 000 | |
| Mg | 14 700 ± 1 300 | 14 600 ± 900 | 100 | 6.5 | 800 | |
| Mn | 440 ± 19 | 440 ± 15 | 100 | 3.4 | 10 | |
| Sb | 11.3 ± 2.6 | 11.8 ± 0.7 | 104 | 6.1 | 0.5 | |
| NIST 1646a estuarine sediment | ||||||
| Ba | 210 a | 210 ± 20 | 102 | 11.0 | 10 | |
| Ca | 5 190 ± 200 | 5 300 ± 200 | 102 | 4.4 | 300 | |
| Co | 5 a | 5.0 ± 0.2 | 99 | 3.8 | 0.1 | |
| Fe | 20 080 ± 390 | 20 270 ± 870 | 101 | 4.3 | 10 | |
| La | 17 a | 18 ± 1 | 105 | 3.8 | 0.5 | |
| Na | 7 410 ± 170 | 7 730 ± 160 | 104 | 2.0 | 10 | |
| Rb | 38 a | 36 ± 2 | 95 | 4.7 | 10 | |
| Ti | 4 560 ± 210 | 4 620 ± 300 | 101 | 6.5 | 50 | |
| Zn | 48.9 ± 1.6 | 49.0 ± 3.0 | 100 | 6.2 | 10 | |
| IAEA-SL-2 lake sediment | ||||||
| Cr | 104 ± 9 | 100 ± 6 | 96 | 6.5 | 3 | |
| Cs | 7.0 ± 0.9 | 7.0 ± 0.2 | 96 | 2.8 | 0.05 | |
| Eu | 1.6 ± 0.5 | 1.6 ± 0.2 | 102 | 8.4 | 0.05 | |
| Ga | 23.7 ± 5.1 | 24.0 ± 2.0 | 101 | 8.4 | 1.0 | |
| Hf | 4.2 ± 0.6 | 4.5 ± 0.2 | 108 | 5.0 | 0.2 | |
| Lu | 0.54 ± 0.13 | 0.48 ± 0.10 | 90 | 8.7 | 0.05 | |
| Sc | 17.3 ± 1.1 | 16.7 ± 0.7 | 97 | 4.0 | 0.05 | |
| Sm | 9.25 ± 0.51 | 9.31 ± 0.26 | 101 | 2.8 | 0.03 | |
| Th | 14.0 ± 1.0 | 14.0 ± 0.4 | 101 | 2.2 | 0.2 | |
| U | 4.02 ± 0.33 | 4.01 ± 0.37 | 100 | 9.2 | 0.1 | |
| V | 170 ± 15 | 170 ± 9 | 98 | 5.2 | 0.1 | |
| Yb | 3.42 ± 0.73 | 3.50 ± 0.31 | 102 | 8.9 | 0.15 | |
| IAEA soil-7 | ||||||
| Br | 7.0 a | 7.0 ± 0.4 | 101 | 5.3 | 0.5 | |
| Element | Concentration (mg/kg) | P value | |||
|---|---|---|---|---|---|
| Kedah (n = 27) | Selangor (n = 20) | Langkawi (n = 6) | Others a | ||
| Al | 77 200 a | 83 400 a | 79 300 a | 42 567, 990 000 | 0.1914 |
| As | 19.8 a | 16.3 a | 11.3 a | 15.6, 16, 6.83 | 0.4404 |
| Ba | 280 a | 220 b | 330 a | 11.5, 190 000, 460 | 0.0064 |
| Br | 3 b | 9 a | 2c | 41, 10 | < 0.0001 |
| Ca | 4 660 a | 4 250 a | 0.4844 | ||
| Cl | 89 b | 170 a | 61 b | 91 000, 300 | < 0.0001 |
| Co | 5 a | 4 ab | 3 b | 3-66, 7.9, 300, 11.3 | 0.0244 |
| Cr | 70 a | 64 b | 23 c | 46-143, 6, 14 000, 59.5 | 0.0002 |
| Cs | 13 a | 13 a | 27 a | 5.06 | 0.0623 |
| Eu | 1.2 a | 0.8 b | 0.7 b | 1.4 | < 0.0001 |
| Fe | 22 670 a | 22 950 a | 14 090 b | 12 140, 725 000 | 0.0382 |
| Ga | 18.2 a | 19.1 a | 16.4 a | 15.2 | 0.1646 |
| Hf | 7.2 a | 6.3 b | 10.5 a | 6.4 | 0.0014 |
| K | 12 400 | 13 100 | 33 800 | 0.1251 | |
| La | 45 a | 37 b | 32 b | 27 | < 0.0001 |
| Lu | 0.43 a | 0.37 b | 0.56 a | 0.37 | < 0.0001 |
| Mg | 12 500 a | 12 800 a | 10 500 a | 0.1791 | |
| Mn | 120 b | 150 b | 223 a | 488 | 0.0060 |
| Na | 850 b | 1 980 a | 3 050 a | < 0.0001 | |
| Rb | 112 a | 124 a | 274 a | 0-290, 68 | 0.1924 |
| Sb | 2.1 a | 1.6 a | 1.3 a | 410 | 0.0632 |
| Sc | 12.3 a | 11.4 a | 6.7 b | 11.7 | 0.0006 |
| Sm | 7.98 a | 6.39 b | 7.22 ab | 4.6 | 0.0004 |
| Th | 26 a | 24 a | 23 a | 9.2 | 0.3016 |
| Ti | 4510 a | 3 470 b | 3 670 b | 7 038 | < 0.0001 |
| U | 6.69 a | 5.63 a | 9.58 a | 3 100, 3 | 0.0876 |
| V | 82 a | 74 ab | 42 b | 55-205, 31.6, 5 200, 129 | 0.0059 |
| Yb | 3.45 a | 3.07 b | 4.33 a | 2.6 | 0.0022 |
| Zn | 62.3 b | 78.8 a | 75.8 ab | 0-92, 21.9, 310 000, 70 | 0.0049 |
Table 2. Mean of soil concentrations and comparison to other established soil multi-elemental values.
| Element | Concentration (mg/kg) | P value | |||
|---|---|---|---|---|---|
| Kedah (n = 27) | Selangor (n = 20) | Langkawi (n = 6) | Others a | ||
| Al | 77 200 a | 83 400 a | 79 300 a | 42 567, 990 000 | 0.1914 |
| As | 19.8 a | 16.3 a | 11.3 a | 15.6, 16, 6.83 | 0.4404 |
| Ba | 280 a | 220 b | 330 a | 11.5, 190 000, 460 | 0.0064 |
| Br | 3 b | 9 a | 2c | 41, 10 | < 0.0001 |
| Ca | 4 660 a | 4 250 a | 0.4844 | ||
| Cl | 89 b | 170 a | 61 b | 91 000, 300 | < 0.0001 |
| Co | 5 a | 4 ab | 3 b | 3-66, 7.9, 300, 11.3 | 0.0244 |
| Cr | 70 a | 64 b | 23 c | 46-143, 6, 14 000, 59.5 | 0.0002 |
| Cs | 13 a | 13 a | 27 a | 5.06 | 0.0623 |
| Eu | 1.2 a | 0.8 b | 0.7 b | 1.4 | < 0.0001 |
| Fe | 22 670 a | 22 950 a | 14 090 b | 12 140, 725 000 | 0.0382 |
| Ga | 18.2 a | 19.1 a | 16.4 a | 15.2 | 0.1646 |
| Hf | 7.2 a | 6.3 b | 10.5 a | 6.4 | 0.0014 |
| K | 12 400 | 13 100 | 33 800 | 0.1251 | |
| La | 45 a | 37 b | 32 b | 27 | < 0.0001 |
| Lu | 0.43 a | 0.37 b | 0.56 a | 0.37 | < 0.0001 |
| Mg | 12 500 a | 12 800 a | 10 500 a | 0.1791 | |
| Mn | 120 b | 150 b | 223 a | 488 | 0.0060 |
| Na | 850 b | 1 980 a | 3 050 a | < 0.0001 | |
| Rb | 112 a | 124 a | 274 a | 0-290, 68 | 0.1924 |
| Sb | 2.1 a | 1.6 a | 1.3 a | 410 | 0.0632 |
| Sc | 12.3 a | 11.4 a | 6.7 b | 11.7 | 0.0006 |
| Sm | 7.98 a | 6.39 b | 7.22 ab | 4.6 | 0.0004 |
| Th | 26 a | 24 a | 23 a | 9.2 | 0.3016 |
| Ti | 4510 a | 3 470 b | 3 670 b | 7 038 | < 0.0001 |
| U | 6.69 a | 5.63 a | 9.58 a | 3 100, 3 | 0.0876 |
| V | 82 a | 74 ab | 42 b | 55-205, 31.6, 5 200, 129 | 0.0059 |
| Yb | 3.45 a | 3.07 b | 4.33 a | 2.6 | 0.0022 |
| Zn | 62.3 b | 78.8 a | 75.8 ab | 0-92, 21.9, 310 000, 70 | 0.0049 |
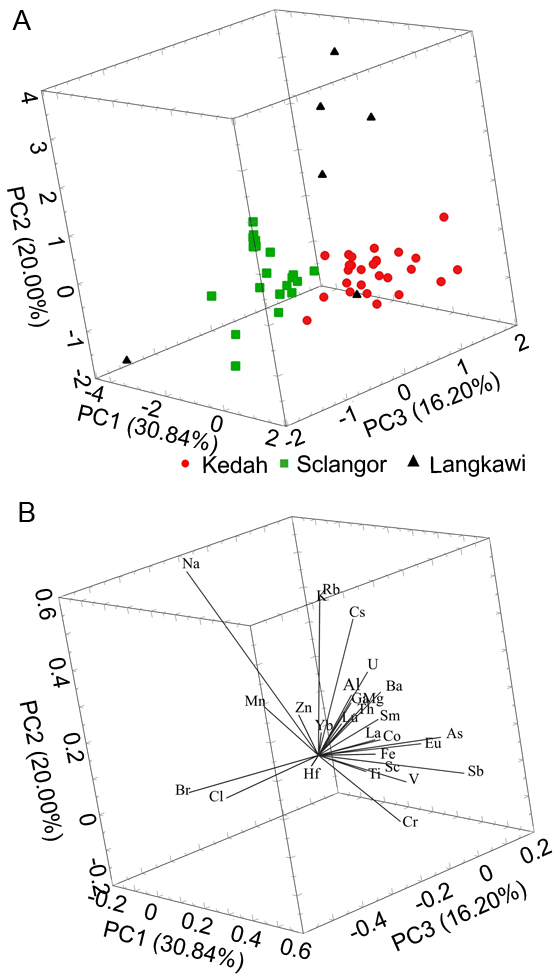
Fig. 1. Principal component analysis (PCA) of soil based on multi- elements. A, 3D PCA score plot soil sample from Kedah, Selangor and Langkawi Island. B, Loading plot based on 28 multi-elements.
| Element | Original/ Jackknife | Group | Predicted group membership | |||
|---|---|---|---|---|---|---|
| Kedah | Selangor | Langkawi | Overall | |||
| Total 27 elements | Original | Kedah Selangor Langkawi | 100 0 0 | 0 100 0 | 0 0 100 | 100 |
| Jackknife | Kedah Selangor Langkawi | 96.3 5.0 16.7 | 3.7 95.0 0 | 0 0 83.3 | 94.3 | |
| Ten elements related to rice analysis | Original | Kedah Selangor Langkawi | 96.3 0 0 | 3.7 100 0 | 0 0 100 | 98.1 |
| Jackknife | Kedah Selangor Langkawi | 95.6 10.0 16.7 | 7.4 90 0 | 0 0 83.3 | 90.6 | |
Table 3. Classification of soil samples according to regions. %
| Element | Original/ Jackknife | Group | Predicted group membership | |||
|---|---|---|---|---|---|---|
| Kedah | Selangor | Langkawi | Overall | |||
| Total 27 elements | Original | Kedah Selangor Langkawi | 100 0 0 | 0 100 0 | 0 0 100 | 100 |
| Jackknife | Kedah Selangor Langkawi | 96.3 5.0 16.7 | 3.7 95.0 0 | 0 0 83.3 | 94.3 | |
| Ten elements related to rice analysis | Original | Kedah Selangor Langkawi | 96.3 0 0 | 3.7 100 0 | 0 0 100 | 98.1 |
| Jackknife | Kedah Selangor Langkawi | 95.6 10.0 16.7 | 7.4 90 0 | 0 0 83.3 | 90.6 | |
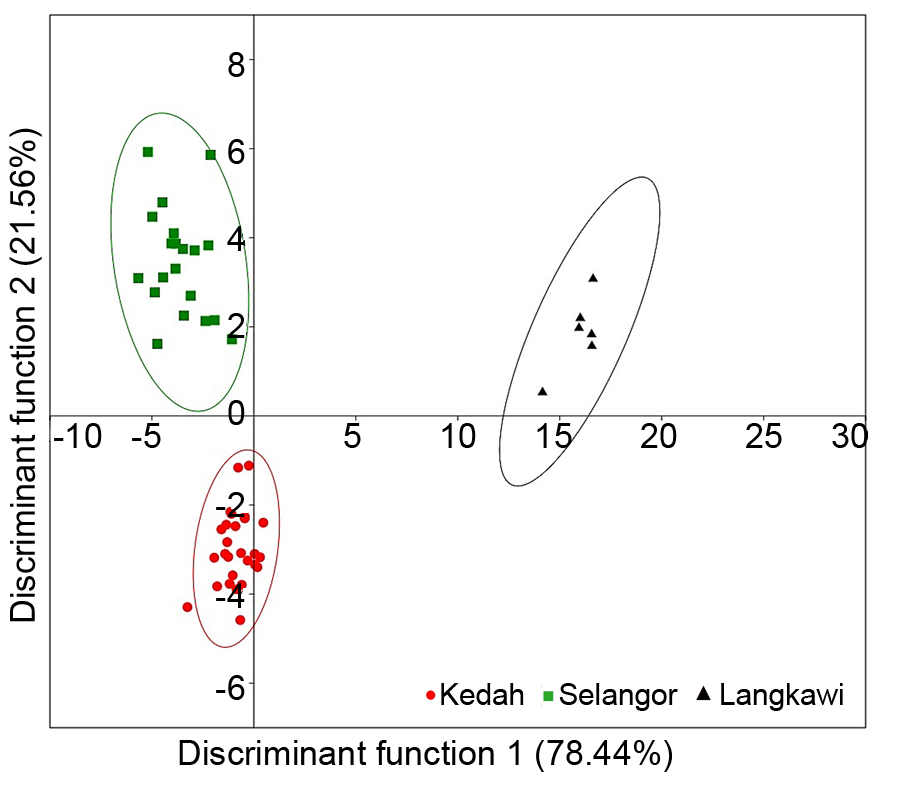
Fig. 2. Linear discriminant analysis scatter plot of the first two discriminant functions of soil samples (n = 53) based on 27 multi- elements.
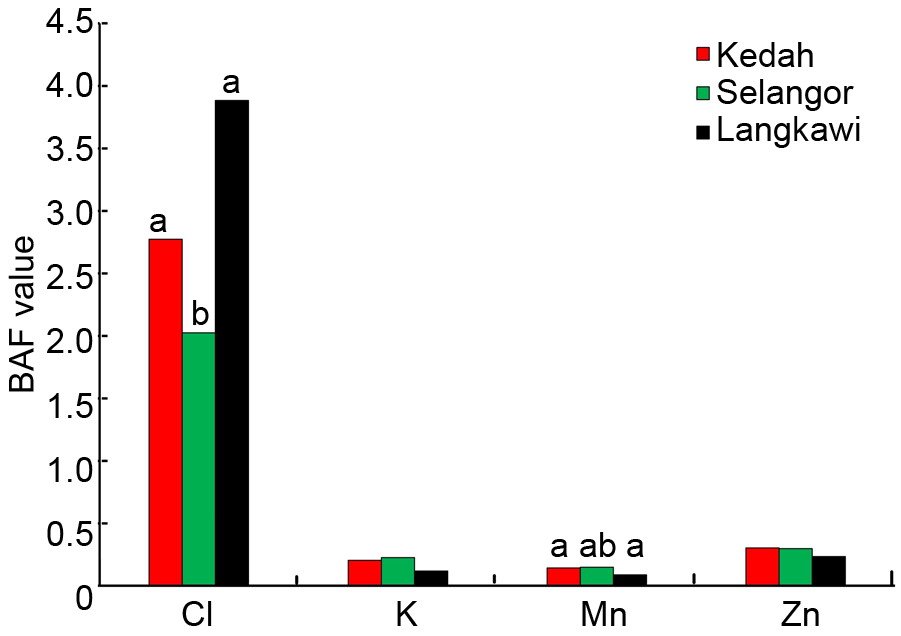
Fig. 3. Bioaccumulation factor (BAF) value of selected elements. Cl, Chlorine; K, Potassium; Mn, Manganese; Zn, Zinc. Different lowercase letters above the bars represent significant differences at the 0.05 level.
| Region | Element in soil | Element in rice | |||||||||
|---|---|---|---|---|---|---|---|---|---|---|---|
| Al | As | Br | Cl | K | Mg | Mn | Na | Rb | Zn | ||
| Kedah | Al | 0.24 | -0.03 | 0.11 | -0.38* | 0.38* | -0.19 | -0.35 | -0.28 | 0.08 | -0.04 |
| As | -0.37 | 0.49** | 0.37* | -0.16 | -0.51** | -0.18 | -0.01 | -0.18 | 0.32 | -0.21 | |
| Br | -0.28 | 0.24 | 0.42 | -0.03 | -0.18 | -0.14 | -0.29 | 0.04 | -0.08 | -0.19 | |
| Cl | 0.28 | -0.23 | -0.21 | -0.11 | 0.35 | -0.10 | 0.02 | 0.21 | -0.31 | -0.15 | |
| K | 0.40* | -0.36 | -0.17 | -0.36 | 0.63** | -0.03 | 0.05 | -0.23 | -0.22 | 0.13 | |
| Mg | 0.24 | -0.20 | 0.07 | -0.38* | 0.46* | -0.16 | -0.48* | -0.28 | -0.10 | -0.11 | |
| Mn | 0.24 | -0.11 | -0.06 | -0.04 | 0.30 | 0.37 | 0.27 | -0.32 | 0.04 | 0.08 | |
| Na | 0.22 | -0.14 | -0.31 | 0.16 | 0.28 | 0.21 | -0.03 | 0.00 | -0.64** | 0.05 | |
| Rb | 0.49** | -0.45* | -0.13 | -0.32 | 0.68** | -0.23 | -0.19 | -0.21 | -0.27 | -0.04 | |
| Zn | 0.14 | 0.08 | -0.05 | -0.07 | 0.44* | 0.40* | -0.30 | 0.00 | -0.02 | 0.01 | |
| Selangor | Al | 0.12 | 0.38 | 0.26 | 0.21 | 0.23 | 0.38 | 0.04 | 0.20 | 0.02 | 0.07 |
| As | -0.52* | 0.53* | -0.09 | -0.20 | -0.28 | -0.27 | -0.12 | 0.10 | -0.17 | 0.11 | |
| Br | -0.28 | 0.17 | 0.17 | 0.07 | 0.22 | 0.21 | 0.01 | 0.19 | 0.08 | -0.30 | |
| Cl | 0.15 | -0.33 | 0.42 | 0.51* | 0.73** | 0.67** | 0.45 | 0.38 | 0.19 | -0.18 | |
| K | -0.17 | 0.02 | -0.13 | 0.00 | -0.04 | 0.26 | 0.00 | 0.06 | 0.14 | -0.05 | |
| Mg | 0.39 | 0.28 | 0.24 | 0.15 | 0.24 | 0.43 | 0.03 | 0.39 | -0.25 | 0.22 | |
| Mn | 0.01 | 0.10 | 0.14 | 0.02 | 0.22 | 0.26 | 0.10 | 0.30 | -0.25 | -0.02 | |
| Na | -0.47* | 0.24 | -0.23 | -0.19 | -0.24 | 0.00 | -0.03 | 0.16 | -0.03 | 0.05 | |
| Rb | -0.30 | 0.19 | -0.23 | -0.11 | -0.14 | 0.11 | -0.01 | 0.28 | -0.05 | 0.04 | |
| Zn | 0.03 | 0.19 | 0.40 | 0.29 | 0.51* | 0.57** | 0.11 | 0.33 | 0.03 | -0.24 | |
| Langkawi | Al | 0.02 | -0.42 | 0.52 | 0.85* | -0.19 | -0.42 | 0.67 | -0.31 | 0.70 | 0.42 |
| As | 0.12 | 0.34 | 0.56 | 0.37 | -0.50 | 0.03 | 0.82* | -0.74 | -0.02 | -0.24 | |
| Br | 0.82* | 0.64 | 0.17 | -0.38 | 0.47 | 0.80 | 0.38 | -0.18 | -0.21 | 0.27 | |
| Cl | 0.82* | 0.42 | -0.12 | -0.05 | 0.74 | 0.87 | 0.22 | -0.08 | -0.60 | 0.04 | |
| K | 0.16 | -0.11 | 0.05 | 0.58 | 0.08 | -0.38 | 0.40 | 0.17 | 0.69 | 0.70 | |
| Mg | 0.05 | -0.44 | 0.60 | 0.86 | -0.20 | -0.37 | 0.71 | -0.39 | 0.68 | 0.38 | |
| Mn | -0.48 | -0.63 | 0.04 | -0.24 | -0.09 | -0.21 | -0.57 | 0.15 | 0.11 | -0.17 | |
| Na | 0.01 | -0.18 | -0.19 | 0.54 | 0.11 | -0.52 | 0.15 | 0.40 | 0.66 | 0.69 | |
| Rb | 0.05 | -0.13 | 0.00 | 0.65 | -0.01 | -0.47 | 0.38 | 0.16 | 0.63 | 0.58 | |
| Zn | 0.06 | -0.60 | 0.93** | 0.56 | -0.20 | -0.06 | 0.65 | -0.66 | 0.54 | 0.16 | |
Table 4. Pearson correlation coefficients of elements in soil and rice.
| Region | Element in soil | Element in rice | |||||||||
|---|---|---|---|---|---|---|---|---|---|---|---|
| Al | As | Br | Cl | K | Mg | Mn | Na | Rb | Zn | ||
| Kedah | Al | 0.24 | -0.03 | 0.11 | -0.38* | 0.38* | -0.19 | -0.35 | -0.28 | 0.08 | -0.04 |
| As | -0.37 | 0.49** | 0.37* | -0.16 | -0.51** | -0.18 | -0.01 | -0.18 | 0.32 | -0.21 | |
| Br | -0.28 | 0.24 | 0.42 | -0.03 | -0.18 | -0.14 | -0.29 | 0.04 | -0.08 | -0.19 | |
| Cl | 0.28 | -0.23 | -0.21 | -0.11 | 0.35 | -0.10 | 0.02 | 0.21 | -0.31 | -0.15 | |
| K | 0.40* | -0.36 | -0.17 | -0.36 | 0.63** | -0.03 | 0.05 | -0.23 | -0.22 | 0.13 | |
| Mg | 0.24 | -0.20 | 0.07 | -0.38* | 0.46* | -0.16 | -0.48* | -0.28 | -0.10 | -0.11 | |
| Mn | 0.24 | -0.11 | -0.06 | -0.04 | 0.30 | 0.37 | 0.27 | -0.32 | 0.04 | 0.08 | |
| Na | 0.22 | -0.14 | -0.31 | 0.16 | 0.28 | 0.21 | -0.03 | 0.00 | -0.64** | 0.05 | |
| Rb | 0.49** | -0.45* | -0.13 | -0.32 | 0.68** | -0.23 | -0.19 | -0.21 | -0.27 | -0.04 | |
| Zn | 0.14 | 0.08 | -0.05 | -0.07 | 0.44* | 0.40* | -0.30 | 0.00 | -0.02 | 0.01 | |
| Selangor | Al | 0.12 | 0.38 | 0.26 | 0.21 | 0.23 | 0.38 | 0.04 | 0.20 | 0.02 | 0.07 |
| As | -0.52* | 0.53* | -0.09 | -0.20 | -0.28 | -0.27 | -0.12 | 0.10 | -0.17 | 0.11 | |
| Br | -0.28 | 0.17 | 0.17 | 0.07 | 0.22 | 0.21 | 0.01 | 0.19 | 0.08 | -0.30 | |
| Cl | 0.15 | -0.33 | 0.42 | 0.51* | 0.73** | 0.67** | 0.45 | 0.38 | 0.19 | -0.18 | |
| K | -0.17 | 0.02 | -0.13 | 0.00 | -0.04 | 0.26 | 0.00 | 0.06 | 0.14 | -0.05 | |
| Mg | 0.39 | 0.28 | 0.24 | 0.15 | 0.24 | 0.43 | 0.03 | 0.39 | -0.25 | 0.22 | |
| Mn | 0.01 | 0.10 | 0.14 | 0.02 | 0.22 | 0.26 | 0.10 | 0.30 | -0.25 | -0.02 | |
| Na | -0.47* | 0.24 | -0.23 | -0.19 | -0.24 | 0.00 | -0.03 | 0.16 | -0.03 | 0.05 | |
| Rb | -0.30 | 0.19 | -0.23 | -0.11 | -0.14 | 0.11 | -0.01 | 0.28 | -0.05 | 0.04 | |
| Zn | 0.03 | 0.19 | 0.40 | 0.29 | 0.51* | 0.57** | 0.11 | 0.33 | 0.03 | -0.24 | |
| Langkawi | Al | 0.02 | -0.42 | 0.52 | 0.85* | -0.19 | -0.42 | 0.67 | -0.31 | 0.70 | 0.42 |
| As | 0.12 | 0.34 | 0.56 | 0.37 | -0.50 | 0.03 | 0.82* | -0.74 | -0.02 | -0.24 | |
| Br | 0.82* | 0.64 | 0.17 | -0.38 | 0.47 | 0.80 | 0.38 | -0.18 | -0.21 | 0.27 | |
| Cl | 0.82* | 0.42 | -0.12 | -0.05 | 0.74 | 0.87 | 0.22 | -0.08 | -0.60 | 0.04 | |
| K | 0.16 | -0.11 | 0.05 | 0.58 | 0.08 | -0.38 | 0.40 | 0.17 | 0.69 | 0.70 | |
| Mg | 0.05 | -0.44 | 0.60 | 0.86 | -0.20 | -0.37 | 0.71 | -0.39 | 0.68 | 0.38 | |
| Mn | -0.48 | -0.63 | 0.04 | -0.24 | -0.09 | -0.21 | -0.57 | 0.15 | 0.11 | -0.17 | |
| Na | 0.01 | -0.18 | -0.19 | 0.54 | 0.11 | -0.52 | 0.15 | 0.40 | 0.66 | 0.69 | |
| Rb | 0.05 | -0.13 | 0.00 | 0.65 | -0.01 | -0.47 | 0.38 | 0.16 | 0.63 | 0.58 | |
| Zn | 0.06 | -0.60 | 0.93** | 0.56 | -0.20 | -0.06 | 0.65 | -0.66 | 0.54 | 0.16 | |
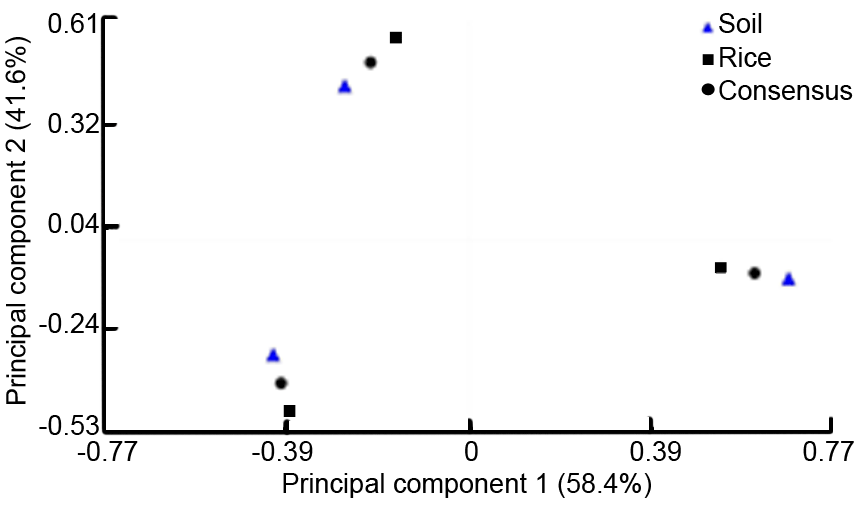
Fig. 4. Configuration of different geographical regions that reflects consensus between soil and rice matrix.
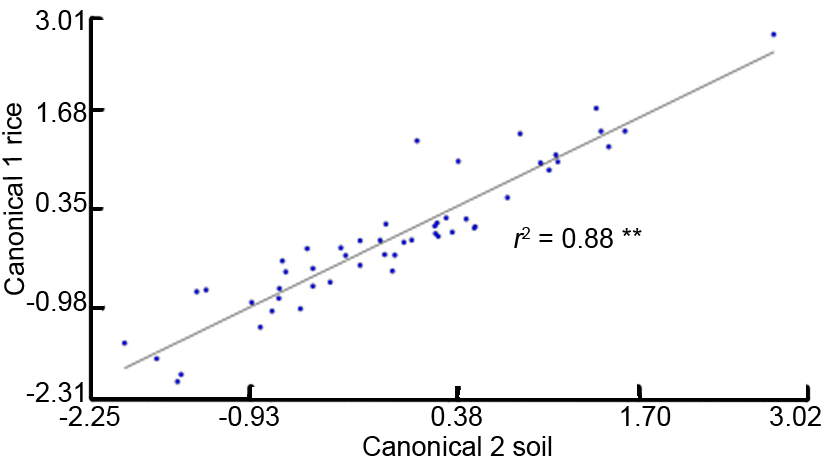
Fig. 5. Canonical variables illustrating the correlation between soil and rice. **, Significant correlation at the 0.01 level.
| [1] | Aguzzoni A, Bassi M, Robatscher P, Scandellari F, Tirler W, Tagliavini M. 2019. Intra-and intertree variability of the 87Sr/86Sr ratio in apple orchards and its correlation with the soil 87Sr/86Sr ratio. J Agric Food Chem, 67(20): 5728-5735. |
| [2] | Ali W, Mao K, Zhang H, Junaid M, Xu N, Rasool A, Feng X B, Yang Z G. 2020. Comprehensive review of the basic chemical behaviours, sources, processes, and endpoints of trace element contamination in paddy soil-rice systems in rice-growing countries. J Hazard Mater, 397: 122720. |
| [3] | Alrawiq N, Khairiah J, Talib M L, Ismail B S, Anizan I. 2014. Accumulation and translocation of heavy metals in paddy plant selected from recycled and non-recycle water area of MADA Kedah, Malaysia. Int J Chemtech Res, 6(4): 2347-2356. |
| [4] | Arunakumara K K I U, Walpola B C, Yoon M H. 2013. Current status of heavy metal contamination in Asia’s rice lands. Rev Environ Sci Biotechnol, 12(4): 355-377. |
| [5] | Aziz R A, Rahim S A, Sahid I, Idris W M R. 2015a. Speciation and availability of heavy metals on serpentinized paddy soil and paddy tissue. Procedia: Soc Behav Sci, 195: 1658-1665. |
| [6] | Aziz R A, Rahim S A, Sahid I, Idris W M R, Bhuiyan M A R. 2015b. Determination of heavy metals uptake in soil and paddy plants. Am Eurasian J Agric Environ Sci, 15(2): 161-164. |
| [7] | Baroni M V, Podio N S, Badini R G, Inga M, Ostera H A, Cagnoni M, Gautier E A, García P P, Hoogewerff J, Wunderlin D A. 2015. Linking soil, water, and honey composition to assess the geographical origin of Argentinean honey by multielemental and isotopic analyses. J Agric Food Chem, 63(18): 4638-4645. |
| [8] | Chai Y J, Li Y, Chen X L, Zhang J, Christie P, Lai Chow K, Ai C, Shan S D. 2019. Potential sources and associated risk assessment of potentially toxic elements in paddy soils of a combined urban and rural area. Environ Sci Pollut Res, 26(23): 23615-23624. |
| [9] | Chowdhury M T A, Deacon C M, Jones G D, Imamul Huq S M, Williams P N, Manzurul Hoque A M, Winkel L H E, Price A H, Norton G J, Meharg A A. 2017. Arsenic in Bangladeshi soils related to physiographic region, paddy management, and mirco- and macro-elemental status. Sci Total Environ, 590/591: 406-415. |
| [10] | Cocks L R M, Fortey R A, Lee C P. 2005. A review of Lower and Middle Palaeozoic biostratigraphy in west peninsular Malaysia and southern Thailand in its context within the Sibumasu Terrane. J Asian Earth Sci, 24(6): 703-717. |
| [11] | Department of Environment Malaysia. 2009. Contaminated land management and control guidelines No. 1: Malaysian recommended site screening levels for contaminated land. Department of Environment Malaysia. [2019-8-1]. https://www.doe.gov.my/portalv1/wp-content/uploads/Contaminated-Land-Management-and-Control-Guidelines-No-1_Malaysian-Recommended-Site-Screening-Levels-for-Contaminated-Land.pdf. |
| [12] | Di Paola-Naranjo R D, Baroni M V, Podio N S, Rubinstein H R, Fabani M P, Badini R G, Inga M, Ostera H A, Cagnoni M, Gallegos E, Gautier E, Peral-García P, Hoogewerff J, Wunderlin D A. 2011. Fingerprints for main varieties of Argentinean wines: Terroir differentiation by inorganic, organic, and stable isotopic analyses coupled to chemometrics. J Agric Food Chem, 59(14): 7854-7865. |
| [13] | Domingo L E, Kyuma K. 1983. Trace elements in tropical Asian paddy soils. Soil Sci Plant Nutr, 29(4): 439-452. |
| [14] | FAO. 1972. FAO Soil Bulletin 17: Trace elements in soils and agriculture. Rome. |
| [15] |
Fu Y R, Chen M L, Bi X Y, He Y S, Ren L M, Xiang W, Qiao S Y, Yan S, Li Z G, Ma Z D. 2011. Occurrence of arsenic in brown rice and its relationship to soil properties from Hainan Island, China. Environ Pollut, 159(7): 1757-1762.
PMID |
| [16] | Griboff J, Baroni M V, Horacek M, Wunderlin D A, Monferran M V. 2019. Multielemental + isotopic fingerprint enables linking soil, water, forage and milk composition, assessing the geographical origin of Argentinean milk. Food Chem, 283: 549-558. |
| [17] | Hammer Ø, Harper D A T, Ryan P D. 2001. PAST: Paleontological statistics software package for education and data analysis. Palaeontol Electron, 4: 1-9. |
| [18] |
Hang X S, Wang H Y, Zhou J M, Ma C L, Du C W, Chen X Q. 2009. Risk assessment of potentially toxic element pollution in soils and rice (Oryza sativa) in a typical area of the Yangtze River Delta. Environ Pollut, 157: 2542-2549.
PMID |
| [19] | Harun N S, Hanafiah M M, Nizam N U M, Rasool A. 2020. Water and soil physicochemical characteristics of different rice cultivation areas. Appl Ecol Env Res, 18(5): 6775-6791. |
| [20] | Hashim M M, Yusop M K, Othman R, Wahid S A. 2015. Characterization of nitrogen uptake pattern in Malaysian rice MR219 at different growth stages using 15N isotope. Rice Sci, 22(5): 250-254. |
| [21] |
Hossain M B, Jahiruddin M, Panaullah G M, Loeppert R H, Islam M R, Duxbury J M. 2008. Spatial variability of arsenic concentration in soils and plants, and its relationship with iron, manganese and phosphorus. Environ Pollut, 156(3): 739-744.
PMID |
| [22] | Huang H B, Lin C Q, Yu R L, Yan Y, Hua G R, Wang Q. 2019. Spatial distribution and source appointment of rare earth elements in paddy soils of Jiulong River Basin, Southeast China. J Geochem Explor, 200: 213-220. |
| [23] | Huang Y, Wang L Y, Wang W J, Li T Q, He Z L, Yang X E. 2019. Current status of agricultural soil pollution by heavy metals in China: A meta-analysis. Sci Total Environ, 651: 3034-3042. |
| [24] | Jamil H, Theng L P, Jusoh K, Razali A M, Ali F B, Ismail B S. 2011. Speciation of heavy metals in paddy soils from selected areas in Kedah and Penang, Malaysia. Afr J Biotechnol, 10(62): 13505-13513. |
| [25] | Kabata-Pendias A. 2013. Trace Elements in Soils and Plants. 4th edn. Boca Raton: CRC Press. |
| [26] | Kato L S, De Nadai Fernandes E A, Bacchi M A, Sarriés G A. 2018. Elemental composition of Brazilian rice grains from different cultivars and origins. J Radioanal Nucl Chem, 318(1): 745-751. |
| [27] | Kawaguchi K, Kyuma K. 1974a. Paddy soils in Tropical Asia: Part 1. Description of fertility characteristics. J Southeast Asian Stud, 12(1): 3-24. |
| [28] | Kawaguchi K, Kyuma K. 1974b. Paddy soils in Tropical Asia: Part 2. Description of material characteristics. J Southeast Asian Stud, 12(2): 177-192. |
| [29] | Kelly S, Baxter M, Chapman S, Rhodes C, Dennis J, Brereton P. 2002. The application of isotopic and elemental analysis to determine the geographical origin of premium long grain rice. Eur Food Res Technol, 214(1): 72-78. |
| [30] | Khairiah J, Habibah H J, Anizan I, Maimon A, Aminah A, Ismail B S. 2009. Content of heavy metals in soil collected from selected paddy cultivation areas in Kedah and Perlis, Malaysia. J Appl Sci Res, 5(12): 2179-2188. |
| [31] | Khairiah J, Ramlee A R, Jamil H, Ismail Z, Ismail B S. 2013. Heavy metal content of paddy plants in Langkawi, Kedah, Malaysia. Aust J Basic Appl Sci, 7(2): 123-127. |
| [32] | Kong X Y, Liu T, Yu Z H, Chen Z, Lei D, Wang Z W, Zhang H, Li Q H, Zhang S S. 2018. Heavy metal bioaccumulation in rice from a high geological background area in Guizhou Province, China. Int J Environ Res Public Health, 15(10): 2281. |
| [33] | Kongsri S, Sricharoen P, Limchoowong N, Kukusamude C. 2021. Tracing the geographical origin of Thai Hom Mali rice in three contiguous provinces of Thailand using stable isotopic and elemental markers combined with multivariate analysis. Foods, 10(10): 2349. |
| [34] | Kukusamude C, Kongsri S. 2018. Elemental and isotopic profiling of Thai jasmine rice (Khao Dawk Mali 105) for discrimination of geographical origins in Thung Kula Rong Hai area, Thailand. Food Control, 91: 357-364. |
| [35] | Kyuma K, Kawaguchi K. 1973. A method of fertility evaluation for paddy soils: I. First approximation: Chemical potentiality grading. Soil Sci Plant Nutr, 19(1): 1-9. |
| [36] | Lagad R A, Dasari K B, Alamelu D, Acharya R, Aggarwal S K. 2014. Evaluation of soil to tea plant elemental correlation using instrumental neutron activation analysis. J Radioanal Nucl Chem, 302(3): 1507-1512. |
| [37] | Lagad R A, Singh S K, Rai V K. 2017. Rare earth elements and 87Sr/86Sr isotopic characterization of Indian Basmati rice as potential tool for its geographical authenticity. Food Chem, 217: 254-265. |
| [38] | Li X X, Yu M, Ma J, Luo Z B, Chen F, Yang Y J. 2018. Identifying the relationship between soil properties and rice growth for improving consolidated land in the Yangtze River Delta, China. Sustainability, 10(9): 3072. |
| [39] | Liu H Y, Wei Y M, Zhang Y Q, Wei S, Zhang S S, Guo B L. 2017. The effectiveness of multi-element fingerprints for identifying the geographical origin of wheat. Int J Food Sci Technol, 52(4): 1018-1025. |
| [40] | Liu Z, Zhang Y Z, Zhang Y, Yang G L, Shao S Z, Nie J, Yuan Y W, Rogers K M. 2019. Influence of leaf age, species and soil depth on the authenticity and geographical origin assignment of green tea. Rapid Commun Mass Spectrom, 33(7): 625-634. |
| [41] | Mohamed Z, Terano R, Shamsudin M N, Abd Latif I. 2016. Paddy farmers’ sustainability practices in granary areas in Malaysia. Resources, 5(2): 17. |
| [42] | Mu T T, Wu T Z, Zhou T, Li Z, Ouyang Y N, Jiang J P, Zhu D, Hou J Y, Wang Z Y, Luo Y M, Christie P, Wu L H. 2019. Geographical variation in arsenic, cadmium, and lead of soils and rice in the major rice producing regions of China. Sci Total Environ, 677: 373-381. |
| [43] | Payus C, Talip A F A, Hsiang T W. 2015. Heavy metals accumulation in paddy cultivation area of Kompipinan, Papar district, Sabah. J Sustain Sci Manag, 10(1): 76-86. |
| [44] | Podio N S, Baroni M V, Badini R G, Inga M, Ostera H A, Cagnoni M, Gautier E A, García P P, Hoogewerff J, Wunderlin D A. 2013. Elemental and isotopic fingerprint of Argentinean wheat. Matching soil, water, and crop composition to differentiate provenance. J Agric Food Chem, 61(16): 3763-3773. |
| [45] | Qian L L, Zuo F, Liu H Y, Zhang C D, Chi X X, Zhang D J.2019a. Determination of geographical origin of Wuchang rice with the geographical indicator by multielement analysis. J Food Qual, 2019: 1-7. |
| [46] | Qian L L, Zhang C D, Zuo F, Zheng L N, Li D, Zhang A W, Zhang D J. 2019b. Effects of fertilizers and pesticides on the mineral elements used for the geographical origin traceability of rice. J Food Compos Anal, 83: 103276. |
| [47] | Rendana M, Idris W M R, Rahim S A, Ali Rahman Z, Lihan T, Jamil H.2019. Field investigation of soil organic carbon and soil respiration rate from paddy cultivation area of Alor Senibong Kedah, Malaysia. AIP Conf Proc, 2111(1): 060021. |
| [48] | Salim N A A, Hamzah M S, Elias M S, Siong W B, Rahman S A, Hashim A, Shukor S A. 2013. Instrumental neutron activation analysis of marine sediment in-house reference material. J Nucl Sci Technol, 10(1): 1-7. |
| [49] | Salim N A A, Mostapa R, Othman Z, Daud N M, Harun A R, Mohamed F. 2020. Geographical identification of Oryza sativa ‘MR220CL’ from Peninsular Malaysia using elemental and isotopic profiling. Food Control, 110: 106967. |
| [50] | Satpathy D, Reddy M V, Dhal S P.2014. Risk assessment of heavy metals contamination in paddy soil, plants, and grains (Oryza sativa L.) at the east coast of India. Biomed Res Int, 2014: 545473. |
| [51] | Sebastian A, Prasad M N V. 2015. Trace element management in rice. Agronomy, 5(3): 374-404. |
| [52] | Seeprasert P, Anurakpongsatorn P, Laoharojanaphand S, Busamongkol A. 2017. Instrumental neutron activation analysis to determine inorganic elements in paddy soil and rice and evaluate bioconcentration factors in rice. Agric Nat Resour, 51(3): 154-157. |
| [53] | Shamshuddin J, Panhwar Q A, Shazana M A R S, Elisa A A, Fauziah C I, Naher U A. 2016. Improving the productivity of acid sulfate soils for rice cultivation using limestone, basalt, organic fertilizer and/or their combinations. Sains Malays, 45(3): 383-392. |
| [54] | Shen S G, Xia L Y, Xiong N, Liu Z H, Sun H W. 2013. Determination of the geographic origin of rice by element fingerprints and correlation analyses with the soil of origin. Anal Methods, 5(21): 6177-6185. |
| [55] | Sun H W, Xia L Y, Liang S Z, Shen S G. 2014. The correlation of inorganic anion contents in rice and its soils based on four geographical origin. Food Anal Methods, 7(9): 1791-1797. |
| [56] | Tsukada H, Hasegawa H, Takeda A, Hisamatsu S. 2007. Concentrations of major and trace elements in polished rice and paddy soils collected in Aomori, Japan. J Radioanal Nucl Chem, 273(1): 199-203. |
| [57] | Tsukada H, Takeda A. 2008. Concentration of chlorine in rice plant components. J Radioanal Nucl Chem, 278(2): 387-390. |
| [58] | Wada K, Kakuto Y, Yamada Y, Vacharotayan S. 1981. Clay mineralogy of paddy soils in Thailand and Malaysia. J Fac Agr Kyushu Univ, 25(4): 223-239. |
| [59] | Wang Z J, Erasmus S W, Dekker P, Guo B L, Stoorvogel J J,van Ruth S M. 2020. Linking growing conditions to stable isotope ratios and elemental compositions of Costa Rican bananas (Musa spp.). Food Res Int, 129: 108882. |
| [60] | Wu W, Roberts S L L, Armitage J R, Tooke P, Cordingley H C, Wildsmith S E. 2003. Validation of consensus between proteomic and clinical chemistry datasets by applying a new randomisation F-test for generalised Procrustes analysis. Anal Chimica Acta, 490(1/2): 365-378. |
| [61] |
Yamada Y. 1968. Occurrence of bromine in plants and soil. Talanta, 15(11): 1135-1141.
PMID |
| [62] | Ying H S, Wasli M E B, Perumal M. 2018. Soil characteristics under intensified shifting cultivation for upland rice cultivation in upland Sabal, Sarawak, Malaysia. Biotropia, 25(1): 72-83. |
| [63] | Yoshida S. 1981. Fundamentals of Rice Crop Science. Los Baños, Laguna, the Philippines: International Rice Research Institute: 269. |
| [64] | Yuita K. 1983. Iodine, bromine and chlorine contents in soils and plants of Japan: III Iodine, bromine and chlorine contents in the andosols and in plants of Central Honshu. Soil Sci Plant Nutr, 29(4): 403-428. |
| [65] | Yuita K, Nobusawa Y, Shibuya M, Aso S. 1982a. Iodine, bromine and chlorine contents in soils and plants of Japan: I Iodine, bromine and chlorine contents in soils and plants of the basin of the Miomote River. Soil Sci Plant Nutr, 28(3): 315-336. |
| [66] | Yuita K, Akabe S, Shibuya M, Aso S. 1982b. Iodine bromine and chlorine contents in solls and plants of Japan: II Iodine, bromine and chlorine contents in soils and plants of the basin of the Nagara River. Soil Sci Plant Nutr, 28(4): 499-515. |
| [67] | Zarcinas B A, Ishak C F, McLaughlin M J, Cozens G. 2004. Heavy metals in soils and crops in Southeast Asia: 1. Peninsular Malaysia. Environ Geochem Health, 26(4): 343-357. |
| [68] | Zhao H Y, Guo B L, Wei Y M, Zhang B. 2013. Multi-element composition of wheat grain and provenance soil and their potentialities as fingerprints of geographical origin. J Cereal Sci, 57(3): 391-397. |
| [69] | Zhang C M, Tanaka N, Dwiyanti M, Shenton M, Maruyama H, Shinano T, Chu Q N, Xie J, Watanabe T. 2022. Ionomic profiling of rice genotypes and identification of varieties with elemental covariation effects. Rice Sci, 29(1): 76-88. |
| [70] | Zheng R L, Sun G X, Zhu Y G. 2013. Effects of microbial processes on the fate of arsenic in paddy soil. Chin Sci Bull, 58(2): 186-193. |
| [71] | Zinicovscaia I, Duliu O G, Culicov O A, Sturza R, Bilici C, Gundorina S. 2017. Geographical origin identification of Moldavian wines by neutron activation analysis. Food Anal Methods, 10(11): 3523-3530. |
| [72] | Zulkafflee N S, Mohd Redzuan N A, Hanafi Z, Selamat J, Ismail M R, Praveena S M, Abdull Razis A F. 2019. Heavy metal in paddy soil and its bioavailability in rice using in vitro digestion model for health risk assessment. Int J Environ Res Public Health, 16(23): 4769. |
| No related articles found! |
| 阅读次数 | ||||||
|
全文 |
|
|||||
|
摘要 |
|
|||||