Rice Science ›› 2025, Vol. 32 ›› Issue (4): 467-471.DOI: 10.1016/j.rsci.2025.05.003
收稿日期:2025-01-22
接受日期:2025-05-12
出版日期:2025-07-28
发布日期:2025-08-06
. [J]. Rice Science, 2025, 32(4): 467-471.

Fig. 1. Effects of nitrogen (N) application levels and growth stages on plant N accumulation (PNA), plant height (PH), and canopy spectral reflectance and correlation analysis. A, Variation of PNA with growth process. B, Variation of PNA with N application level. C, Variation of PH with growth process. D, Variation of PH with N application level. E, Variation of canopy spectral reflectance with growth process. F, Variation of canopy spectral reflectance with N application level. G, Correlation between spectral reflectance with PNA and leaf nitrogen accumulation (LNA) in different datasets. In A-D, data of each growth period is all the data corresponding to the variety and N application level of each growth stage, and data of each N application level is all the data corresponding to the N application level and the whole growth stage. In E and F, reflectance of each growth period is the average value of all the data corresponding to the variety and N application level of each growth stage, and reflectance of each N application level is the average value of all the data corresponding to the N application level and the whole growth stage. N0-N4 represent different N application levels of 0, 75, 150, 225, and 300 kg/hm2, respectively. In G, numbers 1-4 in the legend represent Datasets 1-4, respectively. |r(P < 0.01, n = 90)| = 0.27, |r(P < 0.01, n = 180)| = 0.19, |r(P < 0.01, n = 270)| = 0.16, and |r(P < 0.01, n = 360)| = 0.14.
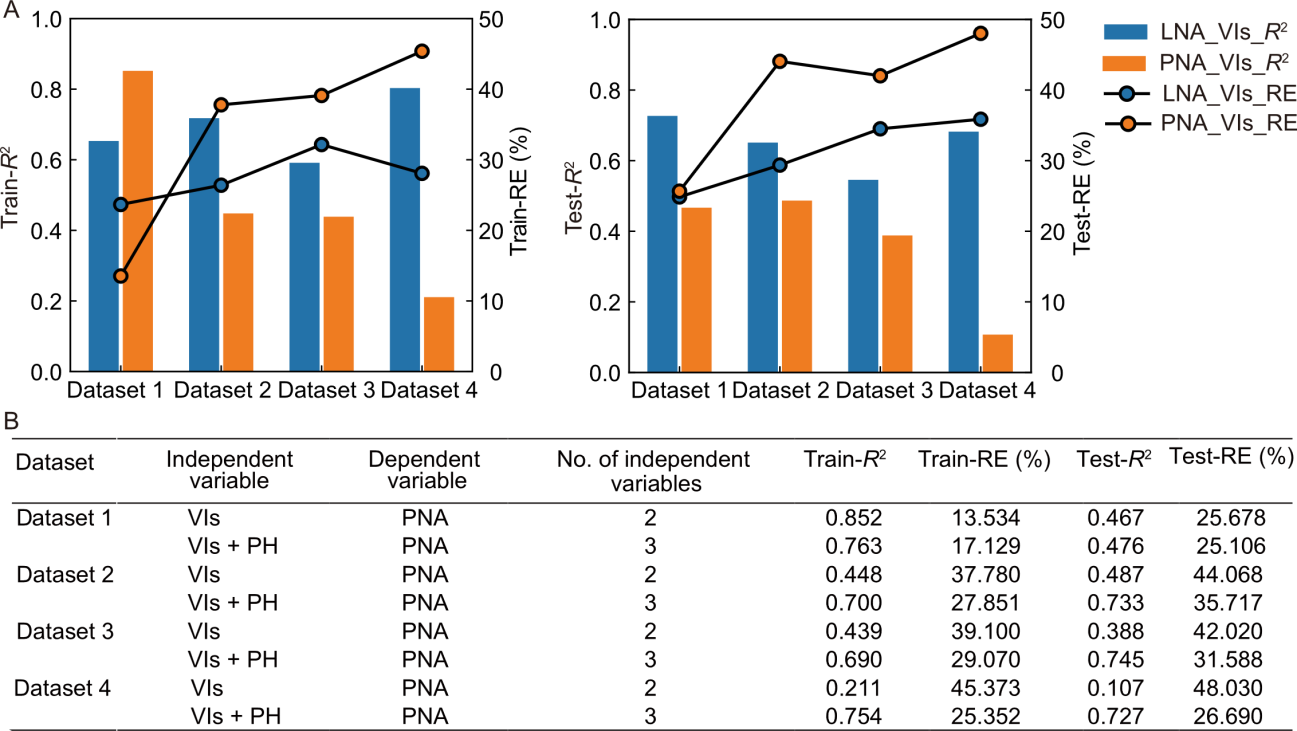
Fig. 2. Performance evaluation results of plant nitrogen accumulation (PNA) and plant nitrogen accumulation (LNA) models. A, Performance evaluation of LNA_VIs and PNA_VIs models. B, Performance evaluation of PNA_VIs and PNA_VIs + PH models. VIs, Vegetation indices; PH, Plant height. The confidence interval (CI) of R2: CI (R2 = 0.852, n = 60, k = 2) ∈ [0.787,0.917], CI (R2 = 0.763, n = 60, k = 3) ∈ [0.665,0.861], CI (R2 = 0.448, n = 120, k = 2) ∈ [0.319,0.577], CI (R2 = 0.700, n = 120, k = 3) ∈ [0.613,0.787], CI (R2 = 0.439, n = 180, k = 2) ∈ [0.332,0.546], CI (R2 = 0.690, n = 180, k = 3) ∈ [0.617,0.763], CI (R2 = 0.211, n = 240, k = 2) ∈ [0.121,0.301], CI (R2 = 0.754, n = 240, k = 3) ∈ [0.701,0.807].
| [1] | Berger K, Verrelst J, Féret J B, et al. 2020. Crop nitrogen monitoring: Recent progress and principal developments in the context of imaging spectroscopy missions. Remote Sens Environ, 242: 111758. |
| [2] | Borrell A K, Garside A L, Fukai S, et al. 1998. Season, nitrogen rate, and plant type affect nitrogen uptake and nitrogen use efficiency in rice. Aust J Agric Res, 49(5): 829-844. |
| [3] | Cheng T, Zhu Y, Li D, et al. 2018. Hyperspectral Remote Sensing of Leaf Nitrogen Concentration in Cereal Crops. Florida, USA: CRC Press: 163-182. |
| [4] | Cui P, Athey S. 2022. Stable learning establishes some common ground between causal inference and machine learning. Nat Mach Intell, 4(2): 110-115. |
| [5] | Evans J R. 1989. Photosynthesis and nitrogen relationships in leaves of C3 plants. Oecologia, 78(1): 9-19. |
| [6] | Fei S P, Xiao S F, Li Q, et al. 2023. Enhancing leaf area index and biomass estimation in maize with feature augmentation from unmanned aerial vehicle-based nadir and cross-circling oblique photography. Comput Electron Agric, 215: 108462. |
| [7] | Feng W, Yao X, Zhu Y, et al. 2008. Monitoring leaf nitrogen status with hyperspectral reflectance in wheat. Eur J Agron, 28(3): 394-404. |
| [8] | Fitzgerald G, Rodriguez D, O’Leary G. 2010. Measuring and predicting canopy nitrogen nutrition in wheat using a spectral index: The canopy chlorophyll content index (CCCI). Field Crops Res, 116(3): 318-324. |
| [9] | Freeman K W, Girma K, Arnall D B, et al. 2007. By-plant prediction of corn forage biomass and nitrogen uptake at various growth stages using remote sensing and plant height. Agron J, 99(2): 530-536. |
| [10] | Fu Y Y, Yang G J, Li Z H, et al. 2020. Progress of hyperspectral data processing and modelling for cereal crop nitrogen monitoring. Comput Electron Agric, 172: 105321. |
| [11] | Gnyp M L, Yu K, Aasen H, et al. 2013. Analysis of crop reflectance for estimating biomass in rice canopies at different phenological stages. Photogramm Fernerkun Geoinf, 2013(4): 351-365. |
| [12] | Gnyp M L, Miao Y X, Yuan F, et al. 2014. Hyperspectral canopy sensing of paddy rice aboveground biomass at different growth stages. Field Crops Res, 155: 42-55. |
| [13] | Hikosaka K. 2004. Interspecific difference in the photosynthesis-nitrogen relationship: Patterns, physiological causes, and ecological importance. J Plant Res, 117(6): 481-494. |
| [14] | Jiang J, Atkinson P M, Chen C S, et al. 2023. Combining UAV and Sentinel-2 satellite multi-spectral images to diagnose crop growth and N status in winter wheat at the county scale. Field Crop Res, 294: 108860. |
| [15] | Lu N, Wang W H, Zhang Q F, et al. 2019. Estimation of nitrogen nutrition status in winter wheat from unmanned aerial vehicle based multi-angular multispectral imagery. Front Plant Sci, 10: 1601. |
| [16] | Luo L, Zhang Y L, Xu G H. 2020. How does nitrogen shape plant architecture? J Exp Bot, 71(15): 4415-4427. |
| [17] | Muharam F M, Bronson K F, Maas S J, et al. 2014. Inter-relationships of cotton plant height, canopy width, ground cover and plant nitrogen status indicators. Field Crops Res, 169: 58-69. |
| [18] | Seck P A, Diagne A, Mohanty S, et al. 2012. Crops that feed the world 7: Rice. Food Secur, 4(1): 7-24. |
| [19] | Sinclair T R, Hoffer R M, Schreiber M M. 1971. Reflectance and internal structure of leaves from several crops during a growing season. Agron J, 63(6): 864-868. |
| [20] | Wang T T, Xue C, Zhang Z J, et al. 2024. Unraveling the distinction between depression and anxiety: A machine learning exploration of causal relationships. Comput Biol Med, 174: 108446. |
| [21] | Wang Z. 2009. Plant Physiology. Beijing, China: China Agriculture Press. (in Chinese) |
| [22] | Yu J, Wang J F, Leblon B, et al. 2022. Nitrogen estimation for wheat using UAV-based and satellite multispectral imagery, topographic metrics, leaf area index, plant height, soil moisture, and machine learning methods. Nitrogen, 3(1): 1-25. |
| [23] | Yue J B, Yang H, Yang G J, et al. 2023. Estimating vertically growing crop above-ground biomass based on UAV remote sensing. Comput Electron Agric, 205: 107627. |
| [24] | Zheng H B, Cheng T, Li D, et al. 2018. Evaluation of RGB, color-infrared and multispectral images acquired from unmanned aerial systems for the estimation of nitrogen accumulation in rice. Remote Sens, 10(6): 824. |
| [25] | Zheng H B, Ma J F, Zhou M, et al. 2020. Enhancing the nitrogen signals of rice canopies across critical growth stages through the integration of textural and spectral information from unmanned aerial vehicle (UAV) multispectral imagery. Remote Sens, 12(6): 957. |
| [26] | Zheng J, Song X Y, Yang G J, et al. 2022. Remote sensing monitoring of rice and wheat canopy nitrogen: A review. Remote Sens, 14(22): 5712. |
| [27] | Zhou L F, Meng R, Yu X, et al. 2023. Improved yield prediction of ratoon rice using unmanned aerial vehicle-based multi-temporal feature method. Rice Sci, 30(3): 247-256. |
| No related articles found! |
| 阅读次数 | ||||||
|
全文 |
|
|||||
|
摘要 |
|
|||||