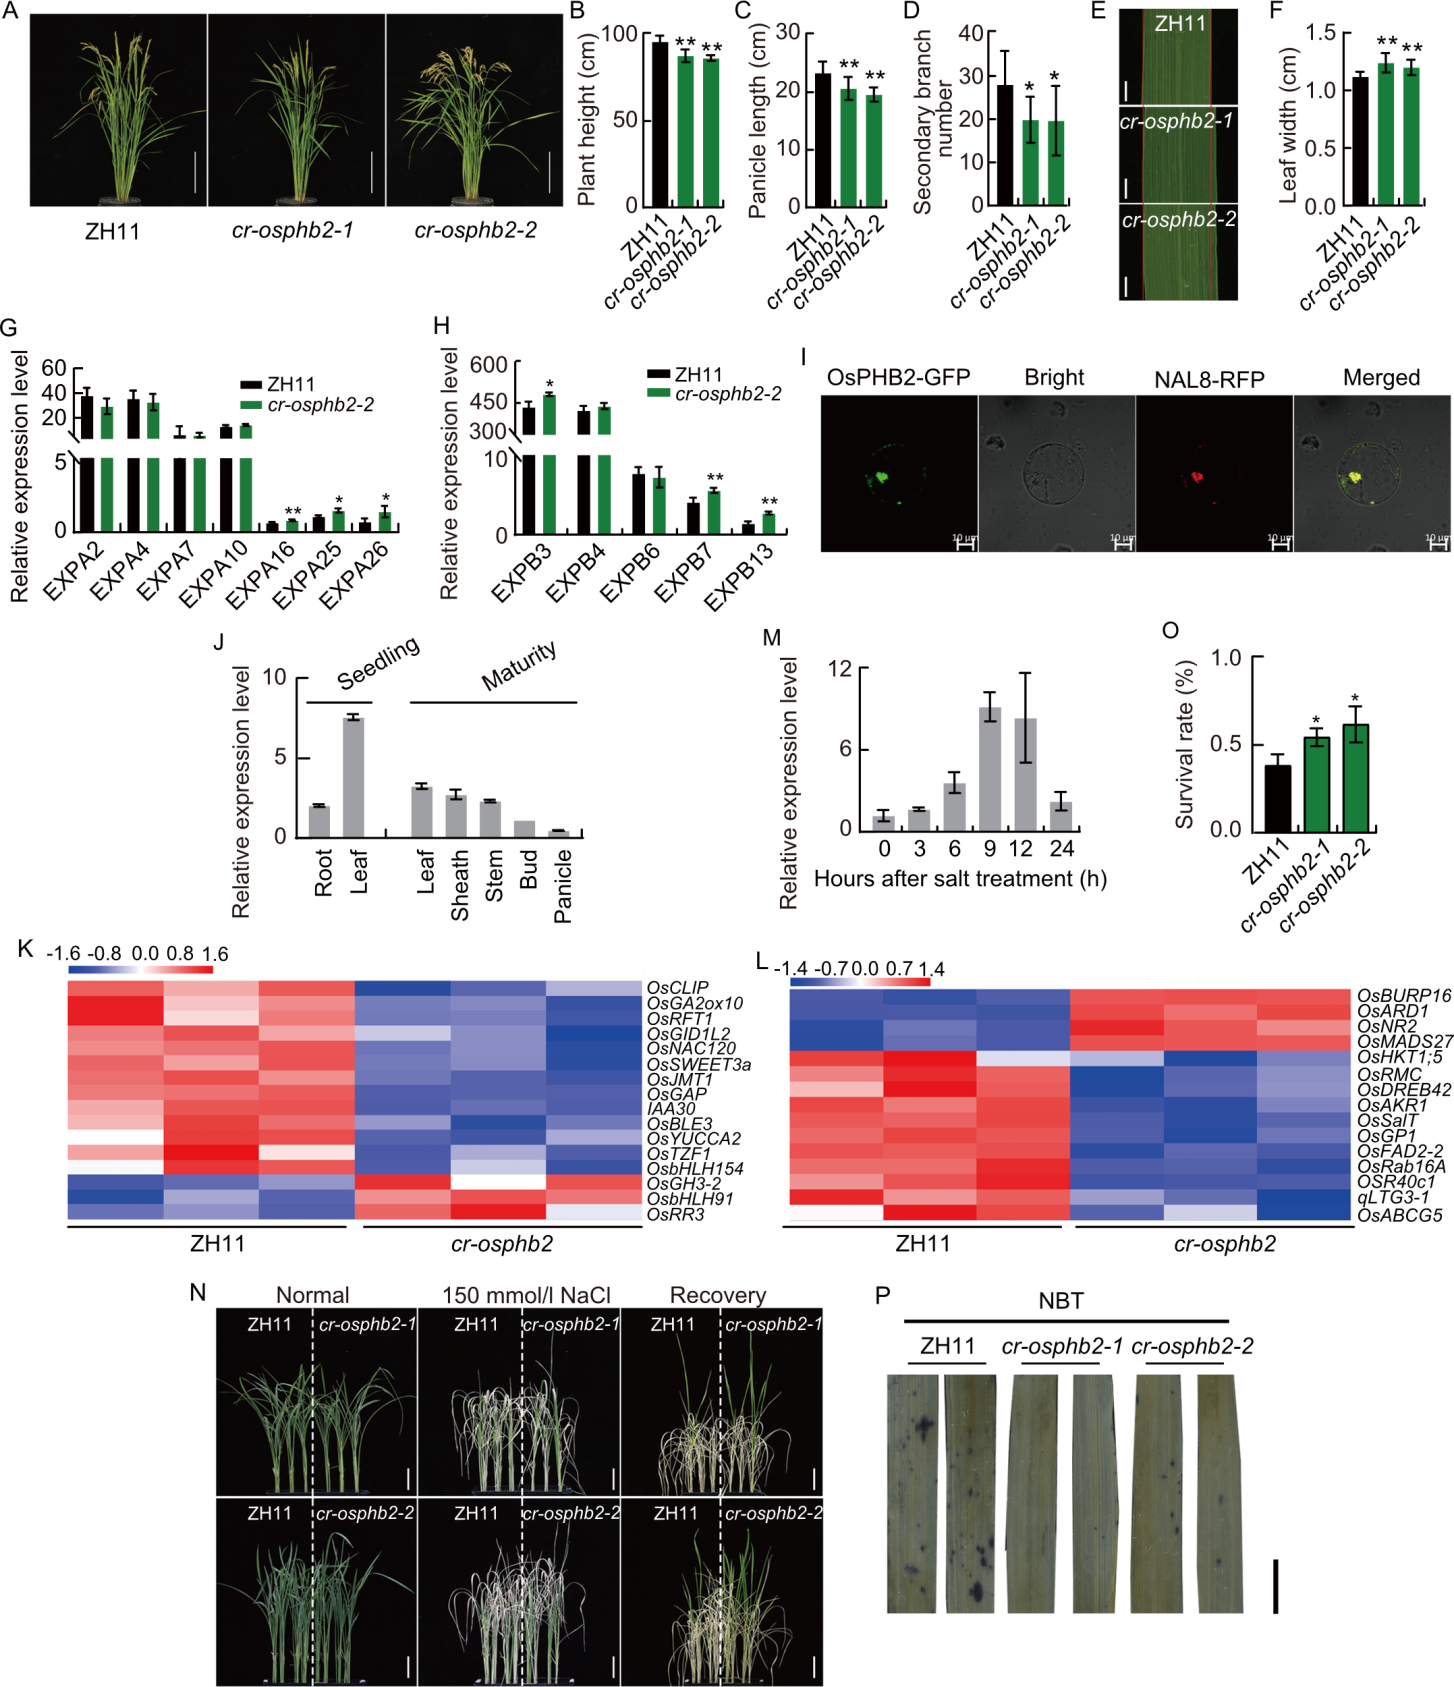
Fig. 1. Agronomic traits, expression patterns, transcriptome and salt tolerance in Zhonghua 11 (ZH11) and knock-out mutant cr-osphb2. A, Plant architecture of ZH11 and cr-osphb2 at the maturity stage. Scale bars, 20 cm. B-D, Plant height (B), panicle length (C), and secondary branch number (D) of ZH11 and cr-osphb2. E, Flag leaves of ZH11 and cr-osphb2. Scale bars, 2 cm. F, Leaf width of ZH11 and cr-osphb2. G and H, Expression of EXPA (G) and EXPB (H) genes in the leaves of ZH11 and cr-osphb2-2. I, Subcellular localization of OsPHB2-GFP fusion protein in rice protoplasts. NAL8-RFP fused protein is a marker for mitochondria. Scale bars, 10 µm. J, Expression levels of OsPHB2 in different tissues of ZH11 at the seedling and mature stages. The rice ubiquitin (OsUBQ) gene was used as an internal control. K and L, Transcriptome-identified differentially expressed genes associated with salt stress (K) and hormone (L) pathways. M, OsPHB2 expression levels at 0, 3, 6, 9, 12, and 24 h after salt treatment. N, Phenotype of 10-day-old seedlings of ZH11 and cr-osphb2 treated with 150 mmol/L NaCl. Scale bars, 2 cm. O, Survival rate of ZH11 and cr-osphb2 after 150 mmol/L NaCl treatment. P, Nitroblue tetrazolium (NBT) staining of ZH11 and cr-osphb2 after 150 mmol/L NaCl treatment. Scale bar, 1 cm. Data are mean ± SD (n = 9 in B, C, D, and F; n = 3 in G, H, J, M, and O). * and **, Significant differences at the 0.05 and 0.01 levels by Student’s t-test.