Rice Science ›› 2023, Vol. 30 ›› Issue (4): 321-334.DOI: 10.1016/j.rsci.2023.02.002
收稿日期:2022-10-13
接受日期:2023-02-24
出版日期:2023-07-28
发布日期:2023-05-26
. [J]. Rice Science, 2023, 30(4): 321-334.
| Factor | Final germination (%) | Germination energy (%) | Mean germination time (d) | Germination rate index (seed/d) | Root length (cm) | Shoot length (cm) | Seedling vigor index |
|---|---|---|---|---|---|---|---|
| Genotype (G) | |||||||
| RD31 | 82.1 ± 1.4 f | 64.8 ± 1.4 f | 4.8 ± 0.03 a | 55.0 ± 1.0 g | 2.5 ± 0.1 b | 5.3 ± 0.2 d | 679.1 ± 23.9 ef |
| RD41 | 83.9 ± 1.4 ef | 72.2 ± 1.7 de | 4.8 ± 0.02 b | 58.4 ± 1.0 ef | 1.9 ± 0.1 de | 5.5 ± 0.1 cd | 644.8 ± 20.7 f |
| RD57 | 85.4 ± 1.4 de | 71.7 ± 1.4 de | 4.6 ± 0.03 ef | 61.7 ± 1.1 d | 2.7 ± 0.2 ab | 5.6 ± 0.2 bc | 733.0 ± 17.1 cd |
| RD71 | 85.4 ± 1.5 de | 67.4 ± 1.2 f | 4.8 ± 0.03 bc | 57.5 ± 1.1 f | 2.0 ± 0.1 cd | 4.9 ± 0.1 e | 603.3 ± 18.1 g |
| RD77 | 86.9 ± 1.3 cd | 74.1 ± 1.3 cd | 4.7 ± 0.01 de | 61.3 ± 0.8 d | 2.1 ± 0.1 cd | 5.8 ± 0.1 b | 702.3 ± 17.5 de |
| RD79 | 83.6 ± 1.1 ef | 70.7 ± 1.3 e | 4.7 ± 0.03 cd | 58.7 ± 1.0 ef | 2.2 ± 0.1 c | 5.3 ± 0.1 d | 651.2 ± 14.0 f |
| RD85 | 91.9 ± 0.9 a | 88.0 ± 0.9 a | 4.5 ± 0.01 h | 73.6 ± 0.6 a | 2.7 ± 0.1 ab | 6.5 ± 0.1 a | 851.0 ± 11.4 a |
| RD87 | 88.5 ± 1.1 bc | 81.0 ± 1.0 b | 4.5 ± 0.02 h | 69.4 ± 0.6 b | 2.8 ± 0.1 a | 5.9 ± 0.1 b | 771.6 ± 17.7 b |
| RD35 | 89.7 ± 1.0 ab | 83.6 ± 1.3 b | 4.6 ± 0.03 fg | 66.8 ± 0.9 c | 1.9 ± 0.1 de | 6.3 ± 0.1 a | 750.7 ± 12.4 bc |
| Azucena | 85.9 ± 1.4 cde | 75.0 ± 1.5 c | 4.7 ± 0.02 cd | 59.1 ± 0.9 ef | 2.8 ± 0.1 ab | 5.5 ± 0.1 cd | 728.7 ± 15.1 cd |
| IR64 | 78.3 ± 1.3 g | 73.2 ± 1.3 cde | 4.6 ± 0.02 g | 60.4 ± 1.0 de | 1.8 ± 0.1 e | 4.8 ± 0.1 e | 554.7 ± 13.2 h |
| Fe level (Fe, mg/L) | |||||||
| 0 (control) | 92.9 ± 1.2 a | 92.9 ± 1.3 a | 4.4 ± 0.01 d | 78.8 ± 0.9 a | 3.2 ± 0.1 b | 7.0 ± 0.1 b | 950.5 ± 21.9 b |
| 150 | 90.6 ± 1.4 b | 90.6 ± 1.4 b | 4.4 ± 0.01 d | 76.5 ± 1.1 b | 3.7 ± 0.1 a | 7.5 ± 0.1 a | 1 014.0 ± 24.2 a |
| 300 | 88.4 ± 1.1 c | 75.9 ± 1.2 c | 4.6 ± 0.02 c | 62.9 ± 0.8 c | 2.2 ± 0.1 c | 5.5 ± 0.1 c | 684.9 ± 14.1 c |
| 600 | 84.0 ± 1.1 d | 65.5 ± 1.2 d | 4.8 ± 0.03 b | 53.4 ± 0.8 d | 1.4 ± 0.1 d | 4.6 ± 0.1 d | 516.1 ± 11.6 d |
| 900 | 72.1 ± 1.4 e | 48.6 ± 1.4 e | 5.1 ± 0.04 a | 38.3 ± 0.9 e | 1.1 ± 0.1 e | 3.3 ± 0.1 e | 321.0 ± 10.6 e |
| G | ** | ** | ** | ** | ** | ** | ** |
| Fe | ** | ** | ** | ** | ** | ** | ** |
| G × Fe | ** | ** | ** | ** | ** | ** | ** |
Table 1. Individual effect of genotype and iron (Fe) level on germination parameters of tested rice genotypes.
| Factor | Final germination (%) | Germination energy (%) | Mean germination time (d) | Germination rate index (seed/d) | Root length (cm) | Shoot length (cm) | Seedling vigor index |
|---|---|---|---|---|---|---|---|
| Genotype (G) | |||||||
| RD31 | 82.1 ± 1.4 f | 64.8 ± 1.4 f | 4.8 ± 0.03 a | 55.0 ± 1.0 g | 2.5 ± 0.1 b | 5.3 ± 0.2 d | 679.1 ± 23.9 ef |
| RD41 | 83.9 ± 1.4 ef | 72.2 ± 1.7 de | 4.8 ± 0.02 b | 58.4 ± 1.0 ef | 1.9 ± 0.1 de | 5.5 ± 0.1 cd | 644.8 ± 20.7 f |
| RD57 | 85.4 ± 1.4 de | 71.7 ± 1.4 de | 4.6 ± 0.03 ef | 61.7 ± 1.1 d | 2.7 ± 0.2 ab | 5.6 ± 0.2 bc | 733.0 ± 17.1 cd |
| RD71 | 85.4 ± 1.5 de | 67.4 ± 1.2 f | 4.8 ± 0.03 bc | 57.5 ± 1.1 f | 2.0 ± 0.1 cd | 4.9 ± 0.1 e | 603.3 ± 18.1 g |
| RD77 | 86.9 ± 1.3 cd | 74.1 ± 1.3 cd | 4.7 ± 0.01 de | 61.3 ± 0.8 d | 2.1 ± 0.1 cd | 5.8 ± 0.1 b | 702.3 ± 17.5 de |
| RD79 | 83.6 ± 1.1 ef | 70.7 ± 1.3 e | 4.7 ± 0.03 cd | 58.7 ± 1.0 ef | 2.2 ± 0.1 c | 5.3 ± 0.1 d | 651.2 ± 14.0 f |
| RD85 | 91.9 ± 0.9 a | 88.0 ± 0.9 a | 4.5 ± 0.01 h | 73.6 ± 0.6 a | 2.7 ± 0.1 ab | 6.5 ± 0.1 a | 851.0 ± 11.4 a |
| RD87 | 88.5 ± 1.1 bc | 81.0 ± 1.0 b | 4.5 ± 0.02 h | 69.4 ± 0.6 b | 2.8 ± 0.1 a | 5.9 ± 0.1 b | 771.6 ± 17.7 b |
| RD35 | 89.7 ± 1.0 ab | 83.6 ± 1.3 b | 4.6 ± 0.03 fg | 66.8 ± 0.9 c | 1.9 ± 0.1 de | 6.3 ± 0.1 a | 750.7 ± 12.4 bc |
| Azucena | 85.9 ± 1.4 cde | 75.0 ± 1.5 c | 4.7 ± 0.02 cd | 59.1 ± 0.9 ef | 2.8 ± 0.1 ab | 5.5 ± 0.1 cd | 728.7 ± 15.1 cd |
| IR64 | 78.3 ± 1.3 g | 73.2 ± 1.3 cde | 4.6 ± 0.02 g | 60.4 ± 1.0 de | 1.8 ± 0.1 e | 4.8 ± 0.1 e | 554.7 ± 13.2 h |
| Fe level (Fe, mg/L) | |||||||
| 0 (control) | 92.9 ± 1.2 a | 92.9 ± 1.3 a | 4.4 ± 0.01 d | 78.8 ± 0.9 a | 3.2 ± 0.1 b | 7.0 ± 0.1 b | 950.5 ± 21.9 b |
| 150 | 90.6 ± 1.4 b | 90.6 ± 1.4 b | 4.4 ± 0.01 d | 76.5 ± 1.1 b | 3.7 ± 0.1 a | 7.5 ± 0.1 a | 1 014.0 ± 24.2 a |
| 300 | 88.4 ± 1.1 c | 75.9 ± 1.2 c | 4.6 ± 0.02 c | 62.9 ± 0.8 c | 2.2 ± 0.1 c | 5.5 ± 0.1 c | 684.9 ± 14.1 c |
| 600 | 84.0 ± 1.1 d | 65.5 ± 1.2 d | 4.8 ± 0.03 b | 53.4 ± 0.8 d | 1.4 ± 0.1 d | 4.6 ± 0.1 d | 516.1 ± 11.6 d |
| 900 | 72.1 ± 1.4 e | 48.6 ± 1.4 e | 5.1 ± 0.04 a | 38.3 ± 0.9 e | 1.1 ± 0.1 e | 3.3 ± 0.1 e | 321.0 ± 10.6 e |
| G | ** | ** | ** | ** | ** | ** | ** |
| Fe | ** | ** | ** | ** | ** | ** | ** |
| G × Fe | ** | ** | ** | ** | ** | ** | ** |
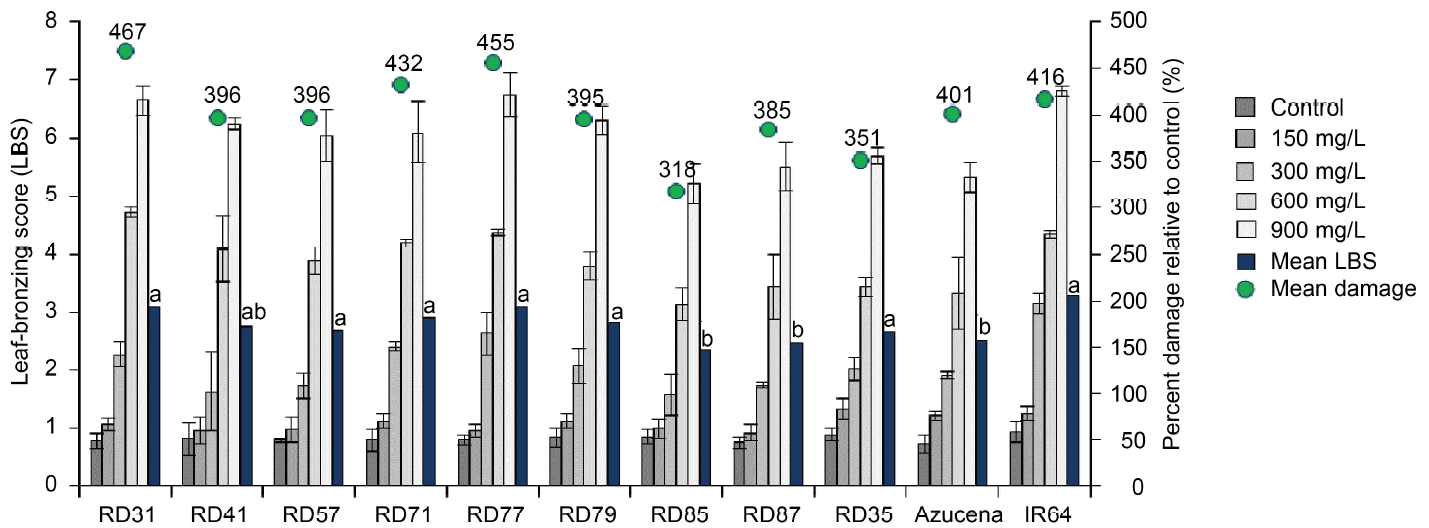
Fig. 1. Leaf-bronzing score (LBS) of 11 rice genotypes exposed to five iron (Fe) levels at 55 d after transplanting. Data are Mean ± SE (n = 3). Different lowercase letters on bars for mean LBS are significantly different based on the Tukey’s honest significant difference test at P ≤ 0.05.
| Factor | Plant height (cm) | Root length (m) | Shoot dry matter (g/plant) | Root dry matter (g/plant) | Tiller number per plant | Panicle number per plant | Filled grain ratio (%) | 1000-grain weight (g) | Grain yield (g/plant) | |||||
|---|---|---|---|---|---|---|---|---|---|---|---|---|---|---|
| Genotype (G) | ||||||||||||||
| RD31 | 92.1 ± 1.9 bc | 128.9 ± 6.4 a | 86.5 ± 3.0 bc | 13.3 ± 0.5 cd | 23.6 ± 0.6 ab | 16.6 ± 0.7 ab | 78.6 ± 0.2 gh | 16.8 ± 0.7 cd | 19.1 ± 1.1 c | |||||
| RD41 | 90.6 ± 3.6 bc | 129.1 ± 6.2 a | 71.9 ± 1.8 d | 13.4 ± 0.7 cd | 19.7 ± 0.5 d | 14.1 ± 0.8 cd | 81.6 ± 0.1 cde | 19.0 ± 0.8 ab | 19.4 ± 1.2 c | |||||
| RD57 | 93.5 ± 2.0 b | 127.2 ± 7.7 a | 84.3 ± 1.4 c | 12.0 ± 1.2 d | 22.4 ± 0.5 bc | 16.5 ± 0.8 ab | 79.2 ± 0.1 fgh | 18.3 ± 0.3 b | 18.8 ± 1.0 c | |||||
| RD71 | 91.7 ± 1.7 bc | 125.4 ± 7.7 a | 73.3 ± 1.3 d | 13.0 ± 0.5 cd | 21.4 ± 0.5 bcd | 14.8 ± 0.9 bcd | 81.2 ± 0.1 def | 19.2 ± 0.7 ab | 20.5 ± 0.8 bc | |||||
| RD77 | 90.1 ± 2.7 bcd | 121.4 ± 6.7 a | 69.1 ± 2.3 de | 11.6 ± 0.7 d | 22.1 ± 0.8 bc | 16.4 ± 0.8 ab | 78.9 ± 0.2 gh | 18.8 ± 0.4 ab | 20.6 ± 0.8 bc | |||||
| RD79 | 90.9 ± 2.4 bc | 121.4 ± 6.8 a | 90.1 ± 2.0 b | 13.8 ± 0.6 bcd | 21.7 ± 0.8 bcd | 16.1 ± 1.2 abc | 80.3 ± 0.4 efg | 18.8 ± 0.4 b | 20.9 ± 0.8 bc | |||||
| RD85 | 84.8 ± 1.0 d | 125.9 ± 4.4 a | 68.5 ± 2.1 de | 17.2 ± 1.1 a | 22.2 ± 0.7 bc | 17.1 ± 0.7 a | 84.9 ± 0.3 b | 20.3 ± 0.5 a | 23.5 ± 0.8 a | |||||
| RD87 | 87.9 ± 2.8 cd | 120.1 ± 6.9 a | 73.5 ± 1.8 d | 15.9 ± 1.4 ab | 21.0 ± 0.7 cd | 15.0 ± 1.1 bc | 82.9 ± 0.1 bcd | 19.5 ± 0.8 ab | 21.8 ± 0.5 ab | |||||
| RD35 | 88.4 ± 3.4 bcd | 128.9 ± 8.0 a | 69.9 ± 1.0 de | 16.2 ± 0.5 a | 23.3 ± 0.8 zb | 15.2 ± 0.9 abc | 83.6 ± 0.3 bc | 18.2 ± 0.5 bc | 22.4 ± 0.8 ab | |||||
| Azucena | 129.3 ± 2.7 a | 120.3 ± 10.2 a | 106.3 ± 1.8 a | 15.0 ± 0.6 abc | 11.3 ± 0.5 e | 7.0 ± 0.3 e | 93.7 ± 0.1 a | 18.8 ± 0.6 ab | 16.4 ± 0.6 d | |||||
| IR64 | 76.0 ± 1.6 e | 126.7 ± 7.0 a | 64.6 ± 4.0 e | 16.5 ± 0.9 a | 24.7 ± 1.0 a | 13.0 ± 1.1 d | 78.0 ± 0.2 h | 16.5 ± 0.5 d | 19.0 ± 1.0 c | |||||
| Fe level (Fe, mg/L) | ||||||||||||||
| 0 (control) | 92.1 ± 2.2 ab | 121.1 ± 8.8 c | 80.9 ± 1.6 c | 13.7 ± 0.8 c | 21.5 ± 0.7 bc | 15.5 ± 0.8 b | 81.3 ± 0.8 bc | 18.8 ± 0.4 c | 21.0 ± 0.9 c | |||||
| 150 | 94.3 ± 2.8 a | 134.6 ± 5.6 b | 89.6 ± 1.5 b | 17.5 ± 0.7 b | 22.5 ± 0.7 ab | 16.9 ± 0.9 a | 83.0 ± 1.2 ab | 19.9 ± 0.6 b | 23.6 ± 1.2 b | |||||
| 300 | 94.9 ± 2.7 a | 149.7 ± 7.1 a | 97.7 ± 2.4 a | 21.0 ± 1.0 a | 23.3 ± 0.7 a | 16.5 ± 1.0 ab | 83.2 ± 0.8 a | 20.8 ± 0.9 a | 25.2 ± 1.3 a | |||||
| 600 | 91.1 ± 1.6 b | 115.2 ± 7.5 c | 69.5 ± 2.2 d | 11.6 ± 0.9 d | 20.6 ± 0.6 c | 13.2 ± 0.8 c | 81.9 ± 1.0 c | 17.7 ± 0.4 d | 18.8 ± 0.4 d | |||||
| 900 | 89.1 ± 2.3 b | 104.6 ± 6.5 d | 52.3 ± 2.5 e | 7.9 ± 0.5 e | 18.2 ± 0.6 d | 11.3 ± 0.8 d | 81.0 ± 0.9 c | 15.6 ± 0.5 e | 12.5 ± 0.5 e | |||||
| G | ** | ns | ** | ** | ** | ** | ** | ** | ** | |||||
| Fe | ** | ** | ** | ** | ** | ** | ** | ** | ** | |||||
| G × Fe | ns | ns | ** | ** | * | * | ** | ** | ** | |||||
| Factor | SPAD value | Net photosynthetic rate [μmol/(m2∙s)] | Membrane stability index (%) | Leaf Fe content (mg/g) | Root Fe content (mg/g) | |||||||||
| Genotype (G) | ||||||||||||||
| RD31 | 36.9 ± 0.4 cd | 18.6 ± 0.6 b | 72.8 ± 0.5 cd | 7.2 ± 0.2 b | 11.8 ± 0.4 b | |||||||||
| RD41 | 37.8 ± 0.5 abcd | 18.2 ± 0.7 b | 75.2 ± 0.5 abcd | 3.7 ± 0.1 f | 10.9 ± 0.4 f | |||||||||
| RD57 | 38.3 ± 0.3 abc | 18.8 ± 1.0 b | 77.1 ± 0.5 abc | 5.7 ± 0.1 e | 11.0 ± 0.2 d | |||||||||
| RD71 | 38.1 ± 0.4 abc | 19.6 ± 0.8 b | 75.3 ± 0.6 abcd | 5.3 ± 0.1 d | 11.4 ± 0.3 e | |||||||||
| RD77 | 35.7 ± 0.4 d | 19.3 ± 0.6 b | 74.5 ± 0.5 bcd | 6.2 ± 0.1 c | 11.6 ± 0.5 c | |||||||||
| RD79 | 39.1 ± 0.2 abc | 19.4 ± 0.8 b | 77.2 ± 0.5 abc | 3.9 ± 0.1 f | 11.0 ± 0.3 e | |||||||||
| RD85 | 39.2 ± 0.5 abc | 23.0 ± 0.9 a | 80.4 ± 0.2 ab | 2.3 ± 0.1 h | 10.1 ± 0.3 i | |||||||||
| RD87 | 40.1 ± 0.3 a | 22.4 ± 1.2 a | 78.5 ± 0.4 abc | 3.1 ± 0.1 g | 10.6 ± 0.4 g | |||||||||
| RD35 | 39.3 ± 0.5 ab | 21.8 ± 0.8 a | 78.4 ± 0.4 abc | 2.6 ± 0.1 h | 10.4 ± 0.2 h | |||||||||
| Azucena | 39.2 ± 0.6 ab | 19.8 ± 0.7 b | 81.3 ± 0.6 a | 2.5 ± 0.1 h | 9.9 ± 0.5 j | |||||||||
| IR64 | 37.6 ± 0.5 bcd | 19.2 ± 0.8 b | 70.0 ± 0.4 d | 8.7 ± 0.3 a | 12.3 ± 0.5 a | |||||||||
| Fe level (Fe, mg/L) | ||||||||||||||
| 0 (control) | 38.4 ± 0.4 bc | 20.5 ± 0.7 c | 84.1 ± 0.4 a | 0.7 ± 0.0 e | 4.1 ± 0.5 e | |||||||||
| 150 | 39.3 ± 0.4 ab | 22.4 ± 0.5 b | 83.9 ± 0.5 a | 1.2 ± 0.0 d | 8.0 ± 0.2 d | |||||||||
| 300 | 40.1 ± 0.4 a | 25.0 ± 1.2 a | 77.9 ± 0.4 b | 2.0 ± 0.1 c | 10.8 ± 0.2 c | |||||||||
| 600 | 37.5 ± 0.4 c | 18.4 ± 0.5 d | 71.4 ± 0.5 c | 6.5 ± 0.1 b | 13.3 ± 0.2 b | |||||||||
| 900 | 36.1 ± 0.4 d | 13.7 ± 1.1 e | 64.7 ± 0.6 d | 12.8 ± 0.4 a | 18.7 ± 0.5 a | |||||||||
| G | ** | ** | ** | ** | ** | |||||||||
| Fe | ** | ** | ** | ** | ** | |||||||||
| G × Fe | ** | ** | ** | ** | ** | |||||||||
Table 2. Individual effect of genotype and iron (Fe) level on growth characteristics and physiochemical parameters of tested rice genotypes.
| Factor | Plant height (cm) | Root length (m) | Shoot dry matter (g/plant) | Root dry matter (g/plant) | Tiller number per plant | Panicle number per plant | Filled grain ratio (%) | 1000-grain weight (g) | Grain yield (g/plant) | |||||
|---|---|---|---|---|---|---|---|---|---|---|---|---|---|---|
| Genotype (G) | ||||||||||||||
| RD31 | 92.1 ± 1.9 bc | 128.9 ± 6.4 a | 86.5 ± 3.0 bc | 13.3 ± 0.5 cd | 23.6 ± 0.6 ab | 16.6 ± 0.7 ab | 78.6 ± 0.2 gh | 16.8 ± 0.7 cd | 19.1 ± 1.1 c | |||||
| RD41 | 90.6 ± 3.6 bc | 129.1 ± 6.2 a | 71.9 ± 1.8 d | 13.4 ± 0.7 cd | 19.7 ± 0.5 d | 14.1 ± 0.8 cd | 81.6 ± 0.1 cde | 19.0 ± 0.8 ab | 19.4 ± 1.2 c | |||||
| RD57 | 93.5 ± 2.0 b | 127.2 ± 7.7 a | 84.3 ± 1.4 c | 12.0 ± 1.2 d | 22.4 ± 0.5 bc | 16.5 ± 0.8 ab | 79.2 ± 0.1 fgh | 18.3 ± 0.3 b | 18.8 ± 1.0 c | |||||
| RD71 | 91.7 ± 1.7 bc | 125.4 ± 7.7 a | 73.3 ± 1.3 d | 13.0 ± 0.5 cd | 21.4 ± 0.5 bcd | 14.8 ± 0.9 bcd | 81.2 ± 0.1 def | 19.2 ± 0.7 ab | 20.5 ± 0.8 bc | |||||
| RD77 | 90.1 ± 2.7 bcd | 121.4 ± 6.7 a | 69.1 ± 2.3 de | 11.6 ± 0.7 d | 22.1 ± 0.8 bc | 16.4 ± 0.8 ab | 78.9 ± 0.2 gh | 18.8 ± 0.4 ab | 20.6 ± 0.8 bc | |||||
| RD79 | 90.9 ± 2.4 bc | 121.4 ± 6.8 a | 90.1 ± 2.0 b | 13.8 ± 0.6 bcd | 21.7 ± 0.8 bcd | 16.1 ± 1.2 abc | 80.3 ± 0.4 efg | 18.8 ± 0.4 b | 20.9 ± 0.8 bc | |||||
| RD85 | 84.8 ± 1.0 d | 125.9 ± 4.4 a | 68.5 ± 2.1 de | 17.2 ± 1.1 a | 22.2 ± 0.7 bc | 17.1 ± 0.7 a | 84.9 ± 0.3 b | 20.3 ± 0.5 a | 23.5 ± 0.8 a | |||||
| RD87 | 87.9 ± 2.8 cd | 120.1 ± 6.9 a | 73.5 ± 1.8 d | 15.9 ± 1.4 ab | 21.0 ± 0.7 cd | 15.0 ± 1.1 bc | 82.9 ± 0.1 bcd | 19.5 ± 0.8 ab | 21.8 ± 0.5 ab | |||||
| RD35 | 88.4 ± 3.4 bcd | 128.9 ± 8.0 a | 69.9 ± 1.0 de | 16.2 ± 0.5 a | 23.3 ± 0.8 zb | 15.2 ± 0.9 abc | 83.6 ± 0.3 bc | 18.2 ± 0.5 bc | 22.4 ± 0.8 ab | |||||
| Azucena | 129.3 ± 2.7 a | 120.3 ± 10.2 a | 106.3 ± 1.8 a | 15.0 ± 0.6 abc | 11.3 ± 0.5 e | 7.0 ± 0.3 e | 93.7 ± 0.1 a | 18.8 ± 0.6 ab | 16.4 ± 0.6 d | |||||
| IR64 | 76.0 ± 1.6 e | 126.7 ± 7.0 a | 64.6 ± 4.0 e | 16.5 ± 0.9 a | 24.7 ± 1.0 a | 13.0 ± 1.1 d | 78.0 ± 0.2 h | 16.5 ± 0.5 d | 19.0 ± 1.0 c | |||||
| Fe level (Fe, mg/L) | ||||||||||||||
| 0 (control) | 92.1 ± 2.2 ab | 121.1 ± 8.8 c | 80.9 ± 1.6 c | 13.7 ± 0.8 c | 21.5 ± 0.7 bc | 15.5 ± 0.8 b | 81.3 ± 0.8 bc | 18.8 ± 0.4 c | 21.0 ± 0.9 c | |||||
| 150 | 94.3 ± 2.8 a | 134.6 ± 5.6 b | 89.6 ± 1.5 b | 17.5 ± 0.7 b | 22.5 ± 0.7 ab | 16.9 ± 0.9 a | 83.0 ± 1.2 ab | 19.9 ± 0.6 b | 23.6 ± 1.2 b | |||||
| 300 | 94.9 ± 2.7 a | 149.7 ± 7.1 a | 97.7 ± 2.4 a | 21.0 ± 1.0 a | 23.3 ± 0.7 a | 16.5 ± 1.0 ab | 83.2 ± 0.8 a | 20.8 ± 0.9 a | 25.2 ± 1.3 a | |||||
| 600 | 91.1 ± 1.6 b | 115.2 ± 7.5 c | 69.5 ± 2.2 d | 11.6 ± 0.9 d | 20.6 ± 0.6 c | 13.2 ± 0.8 c | 81.9 ± 1.0 c | 17.7 ± 0.4 d | 18.8 ± 0.4 d | |||||
| 900 | 89.1 ± 2.3 b | 104.6 ± 6.5 d | 52.3 ± 2.5 e | 7.9 ± 0.5 e | 18.2 ± 0.6 d | 11.3 ± 0.8 d | 81.0 ± 0.9 c | 15.6 ± 0.5 e | 12.5 ± 0.5 e | |||||
| G | ** | ns | ** | ** | ** | ** | ** | ** | ** | |||||
| Fe | ** | ** | ** | ** | ** | ** | ** | ** | ** | |||||
| G × Fe | ns | ns | ** | ** | * | * | ** | ** | ** | |||||
| Factor | SPAD value | Net photosynthetic rate [μmol/(m2∙s)] | Membrane stability index (%) | Leaf Fe content (mg/g) | Root Fe content (mg/g) | |||||||||
| Genotype (G) | ||||||||||||||
| RD31 | 36.9 ± 0.4 cd | 18.6 ± 0.6 b | 72.8 ± 0.5 cd | 7.2 ± 0.2 b | 11.8 ± 0.4 b | |||||||||
| RD41 | 37.8 ± 0.5 abcd | 18.2 ± 0.7 b | 75.2 ± 0.5 abcd | 3.7 ± 0.1 f | 10.9 ± 0.4 f | |||||||||
| RD57 | 38.3 ± 0.3 abc | 18.8 ± 1.0 b | 77.1 ± 0.5 abc | 5.7 ± 0.1 e | 11.0 ± 0.2 d | |||||||||
| RD71 | 38.1 ± 0.4 abc | 19.6 ± 0.8 b | 75.3 ± 0.6 abcd | 5.3 ± 0.1 d | 11.4 ± 0.3 e | |||||||||
| RD77 | 35.7 ± 0.4 d | 19.3 ± 0.6 b | 74.5 ± 0.5 bcd | 6.2 ± 0.1 c | 11.6 ± 0.5 c | |||||||||
| RD79 | 39.1 ± 0.2 abc | 19.4 ± 0.8 b | 77.2 ± 0.5 abc | 3.9 ± 0.1 f | 11.0 ± 0.3 e | |||||||||
| RD85 | 39.2 ± 0.5 abc | 23.0 ± 0.9 a | 80.4 ± 0.2 ab | 2.3 ± 0.1 h | 10.1 ± 0.3 i | |||||||||
| RD87 | 40.1 ± 0.3 a | 22.4 ± 1.2 a | 78.5 ± 0.4 abc | 3.1 ± 0.1 g | 10.6 ± 0.4 g | |||||||||
| RD35 | 39.3 ± 0.5 ab | 21.8 ± 0.8 a | 78.4 ± 0.4 abc | 2.6 ± 0.1 h | 10.4 ± 0.2 h | |||||||||
| Azucena | 39.2 ± 0.6 ab | 19.8 ± 0.7 b | 81.3 ± 0.6 a | 2.5 ± 0.1 h | 9.9 ± 0.5 j | |||||||||
| IR64 | 37.6 ± 0.5 bcd | 19.2 ± 0.8 b | 70.0 ± 0.4 d | 8.7 ± 0.3 a | 12.3 ± 0.5 a | |||||||||
| Fe level (Fe, mg/L) | ||||||||||||||
| 0 (control) | 38.4 ± 0.4 bc | 20.5 ± 0.7 c | 84.1 ± 0.4 a | 0.7 ± 0.0 e | 4.1 ± 0.5 e | |||||||||
| 150 | 39.3 ± 0.4 ab | 22.4 ± 0.5 b | 83.9 ± 0.5 a | 1.2 ± 0.0 d | 8.0 ± 0.2 d | |||||||||
| 300 | 40.1 ± 0.4 a | 25.0 ± 1.2 a | 77.9 ± 0.4 b | 2.0 ± 0.1 c | 10.8 ± 0.2 c | |||||||||
| 600 | 37.5 ± 0.4 c | 18.4 ± 0.5 d | 71.4 ± 0.5 c | 6.5 ± 0.1 b | 13.3 ± 0.2 b | |||||||||
| 900 | 36.1 ± 0.4 d | 13.7 ± 1.1 e | 64.7 ± 0.6 d | 12.8 ± 0.4 a | 18.7 ± 0.5 a | |||||||||
| G | ** | ** | ** | ** | ** | |||||||||
| Fe | ** | ** | ** | ** | ** | |||||||||
| G × Fe | ** | ** | ** | ** | ** | |||||||||
| Genotype | Tolerance (TOL) | Stress tolerance index (STI) | |||||||||
|---|---|---|---|---|---|---|---|---|---|---|---|
| 150 mg/L | 300 mg/L | 600 mg/L | 900 mg/L | Mean# | 150 mg/L | 300 mg/L | 600 mg/L | 900 mg/L | Mean# | ||
| RD31 | -2.92 ± 0.26 g | -5.24 ± 0.69 i | 1.83 ± 0.62 e | 10.16 ± 1.75 b | 5.99 ± 1.19 c | 1.00 ± 0.01 b | 1.03 ± 0.01 d | 0.83 ± 0.01 g | 0.66 ± 0.01 g | 0.75 ± 0.01 f | |
| RD41 | -3.79 ± 0.15 i | -5.32 ± 0.29 j | 1.31 ± 0.38 f | 7.23 ± 1.08 i | 4.27 ± 0.78 h | 1.04 ± 0.00 a | 1.10 ± 0.01 a | 0.85 ± 0.01 f | 0.81 ± 0.01 c | 0.83 ± 0.01 d | |
| RD57 | -4.10 ± 0.51 j | -5.68 ± 0.61 k | 2.73 ± 0.68 b | 8.34 ± 1.13 e | 5.54 ± 0.91 d | 1.01 ± 0.02 b | 1.11 ± 0.00 a | 0.88 ± 0.02 de | 0.77 ± 0.01 e | 0.83 ± 0.02 d | |
| RD71 | -2.66 ± 0.19 e | -4.88 ± 0.25 f | 2.32 ± 0.60 c | 8.16 ± 1.24 g | 5.24 ± 0.92 f | 1.01 ± 0.01 b | 1.08 ± 0.01 c | 0.87 ± 0.00 ef | 0.77 ± 0.02 e | 0.82 ± 0.01 d | |
| RD77 | -2.19 ± 0.11 c | -4.91 ± 0.82 g | 2.29 ± 0.81 d | 8.32 ± 1.38 f | 5.30 ± 1.10 e | 1.01 ± 0.01 b | 1.10 ± 0.02 ab | 0.85 ± 0.01 f | 0.75 ± 0.01 f | 0.80 ± 0.01 e | |
| RD79 | -3.04 ± 0.28 h | -5.01 ± 0.26 h | 2.28 ± 0.75 d | 9.77 ± 1.13 c | 6.03 ± 0.94 b | 1.02 ± 0.01 ab | 1.10 ± 0.00 ab | 0.90 ± 0.01 d | 0.79 ± 0.01 cd | 0.84 ± 0.01 c | |
| RD85 | -2.46 ± 0.12 d | -3.79 ± 0.82 b | 1.21 ± 0.39 g | 6.93 ± 1.20 j | 4.07 ± 0.80 j | 1.01 ± 0.03 b | 1.12 ± 0.02 a | 0.94 ± 0.02 ab | 0.83 ± 0.02 b | 0.88 ± 0.02 b | |
| RD87 | -1.03 ± 0.09 a | -4.06 ± 0.71 d | 0.86 ± 0.57 h | 9.48 ± 1.79 d | 5.17 ± 1.18 g | 1.01 ± 0.02 b | 1.08 ± 0.01 bc | 0.91 ± 0.01 c | 0.78 ± 0.02 de | 0.85 ± 0.02 c | |
| RD35 | -2.77 ± 0.14 f | -4.29 ± 0.95 e | 0.73 ± 0.90 i | 7.78 ± 1.67 h | 4.26 ± 1.29 i | 1.01 ± 0.01 b | 1.11 ± 0.00 a | 0.92 ± 0.01 bc | 0.83 ± 0.01 b | 0.87 ± 0.01 b | |
| Azucena | -1.19 ± 0.17 b | -3.87 ± 0.43 c | 0.45 ± 0.45 j | 4.36 ± 0.98 k | 2.40 ± 0.72 k | 1.02 ± 0.01 ab | 1.10 ± 0.00 ab | 0.95 ± 0.02 a | 0.85 ± 0.02 a | 0.90 ± 0.02 a | |
| IR64 | -3.02 ± 0.35 h | 1.16 ± 0.67 a | 8.15 ± 1.79 a | 12.95 ± 1.34 a | 10.55 ± 1.57 a | 1.00 ± 0.01 b | 0.91 ± 0.01 e | 0.70 ± 0.01 h | 0.58 ± 0.01 h | 0.64 ± 0.01 g | |
Table 3. Magnitude of stress tolerance indices among rice genotypes at different iron (Fe) levels.
| Genotype | Tolerance (TOL) | Stress tolerance index (STI) | |||||||||
|---|---|---|---|---|---|---|---|---|---|---|---|
| 150 mg/L | 300 mg/L | 600 mg/L | 900 mg/L | Mean# | 150 mg/L | 300 mg/L | 600 mg/L | 900 mg/L | Mean# | ||
| RD31 | -2.92 ± 0.26 g | -5.24 ± 0.69 i | 1.83 ± 0.62 e | 10.16 ± 1.75 b | 5.99 ± 1.19 c | 1.00 ± 0.01 b | 1.03 ± 0.01 d | 0.83 ± 0.01 g | 0.66 ± 0.01 g | 0.75 ± 0.01 f | |
| RD41 | -3.79 ± 0.15 i | -5.32 ± 0.29 j | 1.31 ± 0.38 f | 7.23 ± 1.08 i | 4.27 ± 0.78 h | 1.04 ± 0.00 a | 1.10 ± 0.01 a | 0.85 ± 0.01 f | 0.81 ± 0.01 c | 0.83 ± 0.01 d | |
| RD57 | -4.10 ± 0.51 j | -5.68 ± 0.61 k | 2.73 ± 0.68 b | 8.34 ± 1.13 e | 5.54 ± 0.91 d | 1.01 ± 0.02 b | 1.11 ± 0.00 a | 0.88 ± 0.02 de | 0.77 ± 0.01 e | 0.83 ± 0.02 d | |
| RD71 | -2.66 ± 0.19 e | -4.88 ± 0.25 f | 2.32 ± 0.60 c | 8.16 ± 1.24 g | 5.24 ± 0.92 f | 1.01 ± 0.01 b | 1.08 ± 0.01 c | 0.87 ± 0.00 ef | 0.77 ± 0.02 e | 0.82 ± 0.01 d | |
| RD77 | -2.19 ± 0.11 c | -4.91 ± 0.82 g | 2.29 ± 0.81 d | 8.32 ± 1.38 f | 5.30 ± 1.10 e | 1.01 ± 0.01 b | 1.10 ± 0.02 ab | 0.85 ± 0.01 f | 0.75 ± 0.01 f | 0.80 ± 0.01 e | |
| RD79 | -3.04 ± 0.28 h | -5.01 ± 0.26 h | 2.28 ± 0.75 d | 9.77 ± 1.13 c | 6.03 ± 0.94 b | 1.02 ± 0.01 ab | 1.10 ± 0.00 ab | 0.90 ± 0.01 d | 0.79 ± 0.01 cd | 0.84 ± 0.01 c | |
| RD85 | -2.46 ± 0.12 d | -3.79 ± 0.82 b | 1.21 ± 0.39 g | 6.93 ± 1.20 j | 4.07 ± 0.80 j | 1.01 ± 0.03 b | 1.12 ± 0.02 a | 0.94 ± 0.02 ab | 0.83 ± 0.02 b | 0.88 ± 0.02 b | |
| RD87 | -1.03 ± 0.09 a | -4.06 ± 0.71 d | 0.86 ± 0.57 h | 9.48 ± 1.79 d | 5.17 ± 1.18 g | 1.01 ± 0.02 b | 1.08 ± 0.01 bc | 0.91 ± 0.01 c | 0.78 ± 0.02 de | 0.85 ± 0.02 c | |
| RD35 | -2.77 ± 0.14 f | -4.29 ± 0.95 e | 0.73 ± 0.90 i | 7.78 ± 1.67 h | 4.26 ± 1.29 i | 1.01 ± 0.01 b | 1.11 ± 0.00 a | 0.92 ± 0.01 bc | 0.83 ± 0.01 b | 0.87 ± 0.01 b | |
| Azucena | -1.19 ± 0.17 b | -3.87 ± 0.43 c | 0.45 ± 0.45 j | 4.36 ± 0.98 k | 2.40 ± 0.72 k | 1.02 ± 0.01 ab | 1.10 ± 0.00 ab | 0.95 ± 0.02 a | 0.85 ± 0.02 a | 0.90 ± 0.02 a | |
| IR64 | -3.02 ± 0.35 h | 1.16 ± 0.67 a | 8.15 ± 1.79 a | 12.95 ± 1.34 a | 10.55 ± 1.57 a | 1.00 ± 0.01 b | 0.91 ± 0.01 e | 0.70 ± 0.01 h | 0.58 ± 0.01 h | 0.64 ± 0.01 g | |
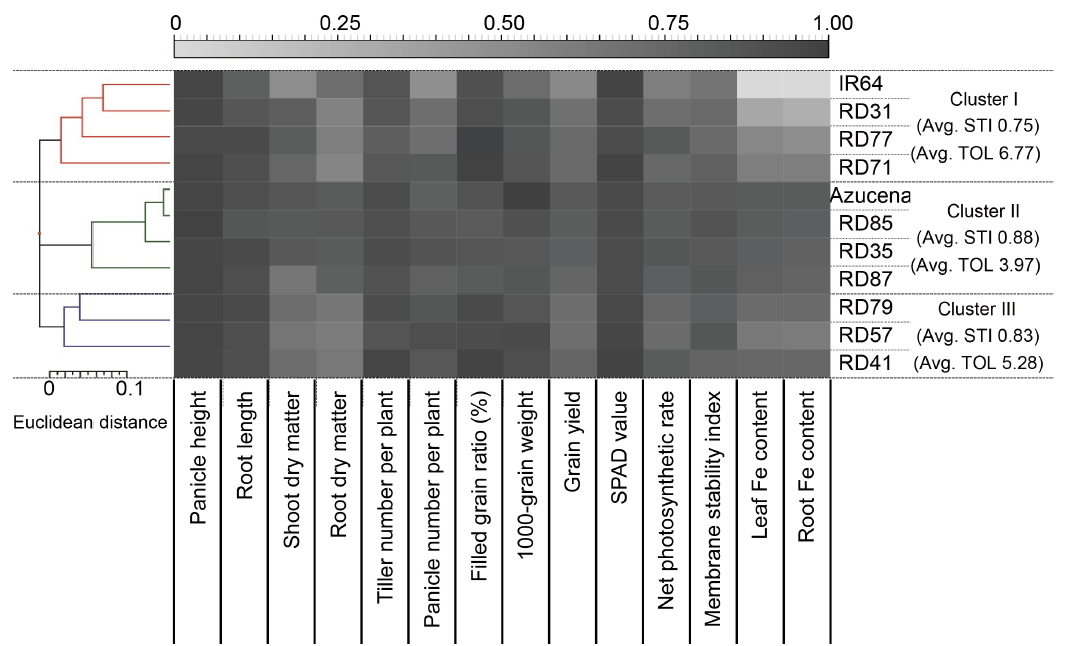
Fig. 2. Unweighted pair group method with arithmetic means-based neighbor-jointing dendrogram and co-cluster heatmap analysis of tested rice genotypes. Genotypes were categorized into three clusters based on the Euclidean distance matrix. Color shades in heatmap express the intensity of the stress tolerance index (STI) values on tested parameters. Avg. STI, Average stress tolerance index; Avg. TOL, Average tolerance; SPAD, Soil and plant analyzer development.
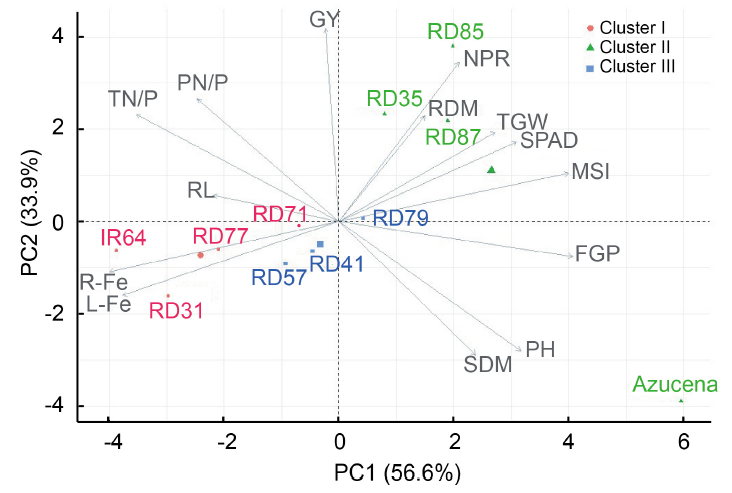
Fig. 3. Principal component analysis (PCA)-biplot of tested rice genotypes and selected parameters. Genotypes are dispersed in different ordinates based on their dissimilarities among them. The length of vectors in the biplot reflects their contribution on the principal component and the angles between them (from the middle point) indicate their positive or negative interactions. Larger points indicate the centroid of the corresponding cluster.
| [1] | Abdi H, Williams L J. 2010. Principal component analysis. WIREs Comp Stat, 2(4): 433-459. |
| [2] | Ali J, Jewel Z, Mahender A, Anandan A, Hernandez J, Li Z K. 2018. Molecular genetics and breeding for nutrient use efficiency in rice. Int J Mol Sci, 19(6): 1762. |
| [3] | Asch F, Becker M, Kpongor D S. 2005. A quick and efficient screen for resistance to iron toxicity in lowland rice. J Plant Nutr Soil Sci, 168(6): 764-773. |
| [4] | Audebert A, Fofana M. 2009. Rice yield gap due to iron toxicity in West Africa. J Agron Crop Sci, 195(1): 66-76. |
| [5] | Audebert A, Sahrawat K L. 2000. Mechanisms for iron toxicity tolerance in lowland rice. J Plant Nutr, 23(11/12): 1877-1885. |
| [6] | Bahrami F, Arzani A, Karimi V. 2014. Evaluation of yield-based drought tolerance indices for screening safflower genotypes. Agron J, 106(4): 1219-1224. |
| [7] | Becker M, Asch F. 2005. Iron toxicity in rice: Conditions and management concepts. J Plant Nutr Soil Sci, 168(4): 558-573. |
| [8] |
Chan-Rodriguez D, Walker E L. 2018. Analysis of yellow striped mutants of Zea mays reveals novel loci contributing to iron deficiency chlorosis. Front Plant Sci, 9: 157.
PMID |
| [9] | Cha-um S, Supaibulwatana K, Kirdmanee C. 2006. Water relation, photosynthetic ability and growth of Thai jasmine rice (Oryza sativa L. ssp. indica cv. KDML 105) to salt stress by application of exogenous glycinebetaine and choline. J Agron Crop Sci, 192(1): 25-36. |
| [10] | Chérif M, Audebert A, Fofana M, Zouzou M. 2009. Evaluation of iron toxicity on lowland irrigated rice in West Africa. Tropicultura, 27(2): 88-92. |
| [11] | Ellis R H, Roberts E H. 1981. The quantification of ageing and survival in orthodox seeds. Seed Sci Technol, 9: 373-409. |
| [12] | Engel K, Asch F, Becker M. 2012. Classification of rice genotypes based on their mechanisms of adaptation to iron toxicity. J Plant Nutr Soil Sci, 175(6): 871-881. |
| [13] | Fageria N K. 2007. Yield physiology of rice. J Plant Nutr, 30(6): 843-879. |
| [14] | Fageria N K, Baligar V C, Li Y C. 2008. The role of nutrient efficient plants in improving crop yields in the twenty first century. J Plant Nutr, 31(6): 1121-1157. |
| [15] | Fernandez G C. 1992. Effective selection criteria for assessing plant stress tolerance. In: Proceeding of the International Symposium on Adaptation of Vegetables and other Food Crops in Temperature and Water Stress. 13-16 Aug 1992, Taiwan, China: 257-270. |
| [16] | Harahap S M, Ghulamahdi M, Aziz S A, Sutandi A, Miftahudin Dr. 2014. Relationship of ethylene production and aerenchyme formation on oxidation ability and root surfaced-iron (Fe2+) accumulation under different iron concentrations and rice genotypes. Int J Appl Sci, 4(1): 186-194. |
| [17] | Hayat S, Hasan S A, Fariduddin Q, Ahmad A. 2008. Growth of tomato (Lycopersicon esculentum) in response to salicylic acid under water stress. J Plant Interact, 3(4): 297-304. |
| [18] |
Hellal F A, El-Shabrawi H M, Abd El-Hady M, Khatab I A, El-Sayed S A, Abdelly C. 2018. Influence of PEG induced drought stress on molecular and biochemical constituents and seedling growth of Egyptian barley cultivars. J Genet Eng Biotechnol, 16(1): 203-212.
PMID |
| [19] | Hernández-Herrera R M, Santacruz-Ruvalcaba F, Ruiz-López M A, Norrie J, Hernández-Carmona G. 2014. Effect of liquid seaweed extracts on growth of tomato seedlings (Solanum lycopersicum L.). J Appl Phycol, 26(1): 619-628. |
| [20] | Hussain F, Bronson K F, Yadvinder S, Singh B, Peng S. 2000. Use of chlorophyll meter sufficiency indices for nitrogen management of irrigated rice in Asia. Agron J, 92(5): 875-879. |
| [21] |
Ishimaru Y, Suzuki M, Tsukamoto T, Suzuki K, Nakazono M, Kobayashi T, Wada Y, Watanabe S, Matsuhashi S, Takahashi M, Nakanishi H, Mori S, Nishizawa N K. 2006. Rice plants take up iron as an Fe3+-phytosiderophore and as Fe2+. Plant J, 45(3): 335-346.
PMID |
| [22] |
Jain A, Connolly E L. 2013. Mitochondrial iron transport and homeostasis in plants. Front Plant Sci, 4: 348.
PMID |
| [23] | Kar S, Panda S K. 2020. Iron homeostasis in rice: Deficit and excess. Proc Natl Acad Sci India Sect B Biol Sci, 90(2): 227-235. |
| [24] | Keita A, Yacouba H, Hayde L G, Schultz B. 2013. A single-season irrigated rice soil presents higher iron toxicity risk in tropical savannah valley bottoms. Open J Soil Sci, 3(7): 314-322. |
| [25] | Khan F U, Mohammad F. 2016. Application of stress selection indices for assessment of nitrogen tolerance in wheat (Triticum aestivum L.). J Anim Plant Sci, 26(1): 201-210. |
| [26] | Kirk G. 2004. The biogeochemistry of submerged soils. Chichester, UK: John Wiley & Sons, Ltd.: 304. |
| [27] | Krohling C A, Eutrópio F J, Bertolazi A A, Dobbss L B, Campostrini E, Dias T, Ramos A C. 2016. Ecophysiology of iron homeostasis in plants. Soil Sci Plant Nutr, 62(1): 39-47. |
| [28] | Lê S, Josse J, Husson F. 2008. FactoMineR: An R package for multivariate analysis. J Stat Softw, 25: 1-18. |
| [29] | Lestari A P, Suwarno, Trikoesoemaningtyas, Sopandie D, Aswidinnoor H. 2019. Estimation for stress tolerance indices of rice genotypes in low nitrogen condition. Thai J Agric Sci, 52(4): 180-190. |
| [30] | Li G J, Kronzucker H J, Shi W M. 2016. Root developmental adaptation to Fe toxicity: Mechanisms and management. Plant Signal Behav, 11(1): e1117722. |
| [31] |
López-Millán A F, Duy D, Philippar K. 2016. Chloroplast iron transport proteins: Function and impact on plant physiology. Front Plant Sci, 7: 178.
PMID |
| [32] | Maguire J D. 1962. Speed of germination: Aid in selection and evaluation for seedling emergence and Vigor. Crop Sci, 2(2): 176-177. |
| [33] | Mahender A, Swamy B P M, Anandan A, Ali J. 2019. Tolerance of iron-deficient and -toxic soil conditions in rice. Plants, 8(2): 31. |
| [34] |
Matthus E, Wu L B, Ueda Y, Höller S, Becker M, Frei M. 2015. Loci, genes, and mechanisms associated with tolerance to ferrous iron toxicity in rice (Oryza sativa L.). Theor Appl Genet, 128(10): 2085-2098.
PMID |
| [35] | Mohi-Ud-Din M, Hossain M A, Rohman M M, Uddin M N, Haque M S, Ahmed J U, Hossain A, Hassan M M, Mostofa M G. 2021. Multivariate analysis of morpho-physiological traits reveals differential drought tolerance potential of bread wheat genotypes at the seedling stage. Plants, 10(5): 879. |
| [36] | Müller C, Kuki K N, Pinheiro D T, de Souza L R, Silva A I S, Loureiro M E, Oliva M A, Almeida A M. 2015. Differential physiological responses in rice upon exposure to excess distinct iron forms. Plant Soil, 391(1): 123-138. |
| [37] | Nugraha Y, Rumanti I A, Guswara A, Ardie S W, Suwarno, Ghulammahdi M, Aswidinnoor H. 2016. Response of selected rice varieties under excess iron condition in media culture at seedling stage. J Pen Pert Tan Pangan, 35(3): 181-190. |
| [38] | Onaga G, Edema R, Asea G. 2013a. Tolerance of rice germplasm to iron toxicity stress and the relationship between tolerance, Fe2+, P and K content in the leaves and roots. Arch Agron Soil Sci, 59(2): 213-229. |
| [39] | Onaga G, Egdane J, Edema R, Abdelbagi I. 2013b. Morphological and genetic diversity analysis of rice accessions (Oryza sativa L.) differing in iron toxicity tolerance. J Crop Sci Biotechnol, 16(1): 53-62. |
| [40] |
Onaga G, Dramé K N, Ismail A M. 2016. Understanding the regulation of iron nutrition: Can it contribute to improving iron toxicity tolerance in rice? Funct Plant Biol, 43(8): 709-726.
PMID |
| [41] |
Onyango D A, Entila F, Dida M M, Ismail A M, Drame K N. 2018. Mechanistic understanding of iron toxicity tolerance in contrasting rice varieties from Africa: 1. Morpho-physiological and biochemical responses. Funct Plant Biol, 46(1): 93-105.
PMID |
| [42] | Pawar S, Pandit E, Mohanty I C, Saha D, Pradhan S K. 2021. Population genetic structure and association mapping for iron toxicity tolerance in rice. PLoS One, 16(3): e0246232. |
| [43] | Pereira E G, Oliva M A, Rosado-Souza L, Mendes G C, Colares D S, Stopato C H, Almeida A M. 2013. Iron excess affects rice photosynthesis through stomatal and non-stomatal limitations. Plant Sci, 201/202: 81-92. |
| [44] | Phukunkamkaew S, Tisarum R, Pipatsitee P, Samphumphuang T, Maksup S, Cha-Um S. 2021. Morpho-physiological responses of indica rice (Oryza sativa sub. indica) to aluminum toxicity at seedling stage. Environ Sci Pollut Res Int, 28(23): 29321-29331. |
| [45] | Quinet M, Vromman D, Clippe A, Bertin P, Lequeux H, Dufey I, Lutts S, Lefèvre I. 2012. Combined transcriptomic and physiological approaches reveal strong differences between short- and long-term response of rice (Oryza sativa) to iron toxicity. Plant Cell Environ, 35(10): 1837-1859. |
| [46] | Ray D K, Mueller N D, West P C, Foley J A. 2013. Yield trends are insufficient to double global crop production by 2050. PLoS One, 8(6): e66428. |
| [47] | Rout G R, Sunita S, Das A B, Das S R. 2014. Screening of iron toxicity in rice genotypes on the basis of morphological, physiological and biochemical analysis. J Exp Biol Agric Sci, 2(6): 567-582. |
| [48] | Rout G R, Sahoo S. 2015. Role of iron in plant growth and metabolism. Rev Agric Sci, 3: 1-24. |
| [49] | Roy S C, Sharma B D. 2014. Assessment of genetic diversity in rice [Oryza sativa L.] germplasm based on agro-morphology traits and zinc-iron content for crop improvement. Physiol Mol Biol Plants, 20(2): 209-224. |
| [50] | Santiago-Arenas R, Fanshuri B A, Hadi S N, Ullah H, Datta A. 2020. Nitrogen fertiliser and establishment method affect growth, yield and nitrogen use efficiency of rice under alternate wetting and drying irrigation. Ann Appl Biol, 176(3): 314-327. |
| [51] | Sikirou M, Saito K, Achigan-Dako E G, Dramé K N, Adam A, Venuprasad R. 2015. Genetic improvement of iron toxicity tolerance in rice-progress, challenges and prospects in West Africa. Plant Prod Sci, 18(4): 423-434. |
| [52] | Sikirou M, Saito K, Dramé K N, Saidou A, Dieng I, Ahanchédé A, Venuprasad R. 2016. Soil-based screening for iron toxicity tolerance in rice using pots. Plant Prod Sci, 19(4): 489-496. |
| [53] | Stein R J, Lopes S I G, Fett J P. 2014. Iron toxicity in field- cultivated rice: Contrasting tolerance mechanisms in distinct cultivars. Theor Exp Plant Physiol, 26(2): 135-146. |
| [54] | Streck E A, Aguiar G A, Facchinello P H K, Perin L, da Silva P U, de Magalhães Júnior A M. 2019. Tolerance and phenotypic analysis of irrigated rice genotypes under iron toxicity. J Exp Agric Int, 31: 1-11. |
| [55] | Tarantino T B, Barbosa I S, Lima D, Pereira M, Teixeira L S G, Korn M G A. 2017. Microwave-assisted digestion using diluted nitric acid for multi-element determination in rice by ICP OES and ICP-MS. Food Anal Method, 10(4): 1007-1015. |
| [56] | Tennant D. 1975. A test of a modified line intersect method of estimating root length. J Ecol, 63: 995-1001. |
| [57] | Tripathi D K, Singh S, Gaur S, Singh S, Yadav V, Liu S L, Singh V P, Sharma S, Srivastava P, Prasad S M, Dubey N K, Chauhan D K, Sahi S. 2018. Acquisition and homeostasis of iron in higher plants and their probable role in abiotic stress tolerance. Front Environ Sci, 5: 86. |
| [58] | Ullah H, Datta A, Shrestha S, Ud Din S. 2017. The effects of cultivation methods and water regimes on root systems of drought-tolerant (RD6) and drought-sensitive (RD10) rice varieties of Thailand. Arch Agron Soil Sci, 63(9): 1198-1209. |
| [59] | Ullah H, Giri S, Attia A, Datta A. 2020. Effects of establishment method and water management on yield and water productivity of tropical lowland rice. Exp Agr, 56(3): 331-346. |
| [60] | Wickham H. 2016. ggplot2: Elegant Graphics for Data Analysis. New York, USA: Springer. |
| [61] | Wu L B, Shhadi M Y, Gregorio G, Matthus E, Becker M, Frei M. 2014. Genetic and physiological analysis of tolerance to acute iron toxicity in rice. Rice, 7(1): 8. |
| [62] | Zaid A, Ahmad B, Jaleel H, Wani S H, Hasanuzzaman M. 2020. A critical review on iron toxicity and tolerance in plants: Role of exogenous phytoprotectants. In: Aftab T, Hakeem K R. Plant Micronutrients. Cham, the Switzerland: Springer: 83-99. |
| No related articles found! |
| 阅读次数 | ||||||
|
全文 |
|
|||||
|
摘要 |
|
|||||