Rice Science ›› 2018, Vol. 25 ›› Issue (2): 111-116.DOI: 10.1016/j.rsci.2018.02.003
• Orginal Article • Previous Articles Next Articles
Taherparvar Maryam, Pirmoradian Nader( )
)
Received:2017-06-17
Accepted:2017-11-23
Online:2018-03-28
Published:2017-12-22
Taherparvar Maryam, Pirmoradian Nader. Estimation of Rice Evapotranspiration Using Reflective Images of Landsat Satellite in Sefidrood Irrigation and Drainage Network[J]. Rice Science, 2018, 25(2): 111-116.
Add to citation manager EndNote|Ris|BibTeX
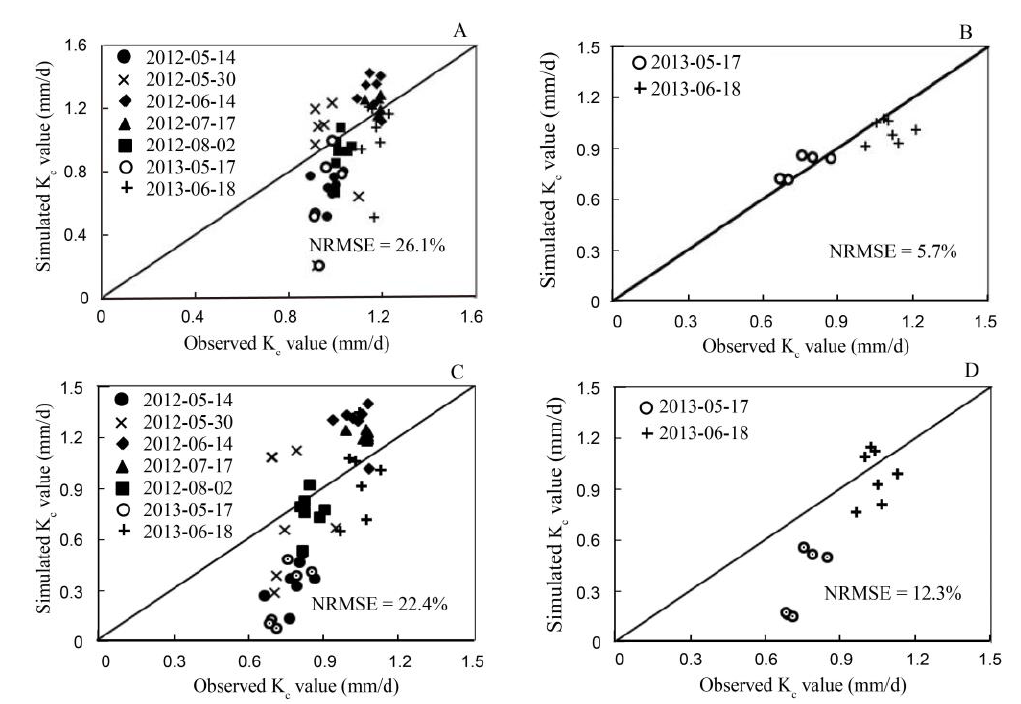
Fig. 1. Comparison of observed and simulated Kc values using Kc-VI linear model (A), Kc-VI calibrated model (B), Kcb-VI linear model (C), and Kcb-VI calibrated model (D).Kc, Crop coefficient; VI, Vegetation index; Kcb, Basal crop coefficient; NRMSE, Normalized root mean square error.
| Date | Period | Model type | Linear relationship for Kc-VI model | Linear relationship for Kcb-VI model | |||||||
|---|---|---|---|---|---|---|---|---|---|---|---|
| (Year-Month-Day) | RMSE (mm/d) | NRMSE | MAE | ME | RMSE (mm/d) | NRMSE | MAE | ME | |||
| (%) | (mm/d) | (mm/d) | (%) | (mm/d) | (mm/d) | ||||||
| 2012/5/14 | Initial | Linear | 0.29 | 29.9 | 0.28 | 0.28 | 0.33 | 32.8 | 0.32 | 0.32 | |
| 2012/5/30 | Initial | Linear | 0.36 | 37.9 | 0.3 | 0.04 | 0.24 | 25.6 | 0.23 | 0 | |
| 2012/6/15 | Middle | Linear | 0.19 | 16.2 | 0.17 | -0.15 | 0.2 | 18.3 | 0.19 | -0.19 | |
| 2012/7/17 | Middle | Linear | 0.07 | 6.2 | 0.06 | -0.03 | 0.13 | 9.7 | 0.12 | -0.12 | |
| 2012/8/2 | Late | Linear | 0.16 | 15.4 | 0.12 | 0.11 | 0.2 | 10.1 | 0.17 | 0.15 | |
| Total (2012) | 0.24 | 22.5 | 0.19 | 0.05 | 0.23 | 20.6 | 0.21 | 0.03 | |||
| 2013/5/17 | Initial | Calibrated | 0.03 | 3.2 | 0.02 | -0.02 | 0.18 | 18.7 | 0.3 | 0.3 | |
| 2013/6/18 | Middle | Calibrated | 0.08 | 7.2 | 0.06 | 0.06 | 0.07 | 5.9 | 0.1 | 0.04 | |
| Total (2013) | 0.06 | 5.7 | 0.05 | 0.02 | 0.13 | 12.3 | 0.19 | 0.16 | |||
Table 1 Statistical criteria for estimating Kc on dates in 2012 and 2013.
| Date | Period | Model type | Linear relationship for Kc-VI model | Linear relationship for Kcb-VI model | |||||||
|---|---|---|---|---|---|---|---|---|---|---|---|
| (Year-Month-Day) | RMSE (mm/d) | NRMSE | MAE | ME | RMSE (mm/d) | NRMSE | MAE | ME | |||
| (%) | (mm/d) | (mm/d) | (%) | (mm/d) | (mm/d) | ||||||
| 2012/5/14 | Initial | Linear | 0.29 | 29.9 | 0.28 | 0.28 | 0.33 | 32.8 | 0.32 | 0.32 | |
| 2012/5/30 | Initial | Linear | 0.36 | 37.9 | 0.3 | 0.04 | 0.24 | 25.6 | 0.23 | 0 | |
| 2012/6/15 | Middle | Linear | 0.19 | 16.2 | 0.17 | -0.15 | 0.2 | 18.3 | 0.19 | -0.19 | |
| 2012/7/17 | Middle | Linear | 0.07 | 6.2 | 0.06 | -0.03 | 0.13 | 9.7 | 0.12 | -0.12 | |
| 2012/8/2 | Late | Linear | 0.16 | 15.4 | 0.12 | 0.11 | 0.2 | 10.1 | 0.17 | 0.15 | |
| Total (2012) | 0.24 | 22.5 | 0.19 | 0.05 | 0.23 | 20.6 | 0.21 | 0.03 | |||
| 2013/5/17 | Initial | Calibrated | 0.03 | 3.2 | 0.02 | -0.02 | 0.18 | 18.7 | 0.3 | 0.3 | |
| 2013/6/18 | Middle | Calibrated | 0.08 | 7.2 | 0.06 | 0.06 | 0.07 | 5.9 | 0.1 | 0.04 | |
| Total (2013) | 0.06 | 5.7 | 0.05 | 0.02 | 0.13 | 12.3 | 0.19 | 0.16 | |||
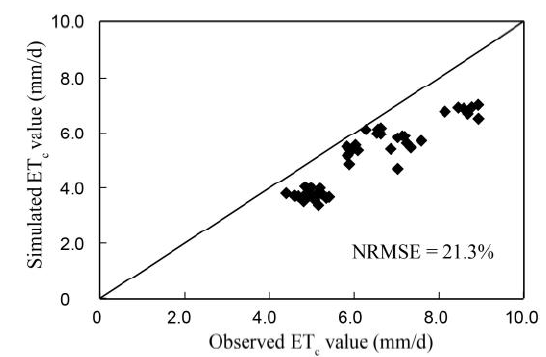
Fig. 2. Comparing the observed and estimated (ETc)rice value using VI-ET0 model.NRMSE, Normalized root mean square error.
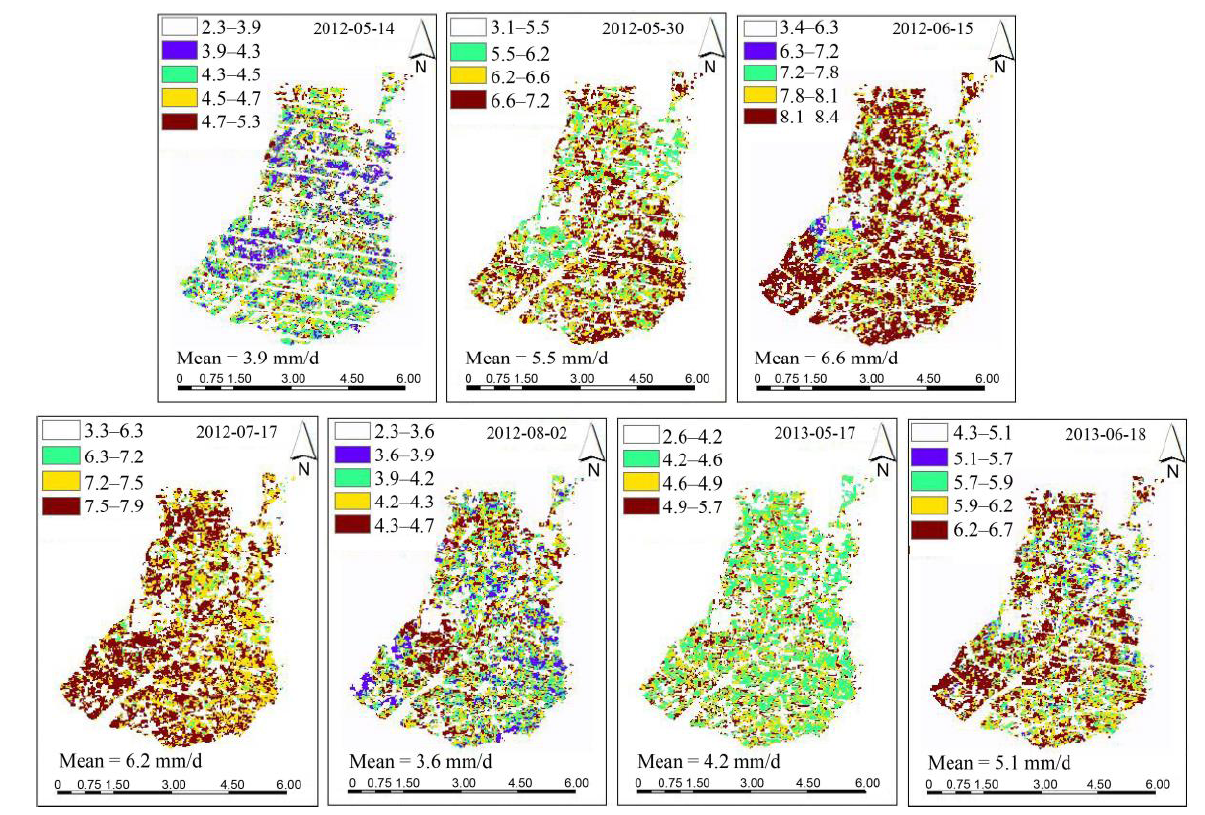
Fig. 3. Rice evapotranspiration [(ETc)rice] maps for the studied dates in 2012 and 2013.
| Date | Average temperature (ºC) | Average humidity (%) |
|---|---|---|
| (Year-Month-Day) | ||
| 2012/5/14 | 24.4 | 75 |
| 2012/5/30 | 26 | 79 |
| 2012/6/15 | 27.4 | 67 |
| 2012/7/17 | 25.8 | 77 |
| 2012/8/2 | 26.5 | 74 |
| 2013/5/17 | 19.8 | 75 |
| 2013/6/18 | 25.7 | 53 |
Table 2 Average daily temperature and humidity in the study.
| Date | Average temperature (ºC) | Average humidity (%) |
|---|---|---|
| (Year-Month-Day) | ||
| 2012/5/14 | 24.4 | 75 |
| 2012/5/30 | 26 | 79 |
| 2012/6/15 | 27.4 | 67 |
| 2012/7/17 | 25.8 | 77 |
| 2012/8/2 | 26.5 | 74 |
| 2013/5/17 | 19.8 | 75 |
| 2013/6/18 | 25.7 | 53 |
| [1] | Agapiou A, Hadjimitsis D G, Papoutsa C, Alexakis D D, Papadavid G.2011. The importance of accounting for atmospheric effects in the application of NDVI and interpretation of satellite imagery supporting archaeological research: The case studies of Palae Paphos and Nea Paphos sites in Cyprus.Remote Sens, 3(12): 2605-2629. |
| [2] | Allen R G, Pereira L S, Raes D, Smith M.1998. Crop Evapotranspiration: Guidelines for Computing Crop Water Requirements. Rome: Food and Agriculture Organization of the United Nations: 300. |
| [3] | Anda A, Soos G, Silva J A T D, Kozma-Bognar V.2015. Regional evapotranspiration from a wetland in Central Europe, in a 16-year period without human intervention.Agr Forest Meteorol, 205: 60-72. |
| [4] | Bastiaanssen W G M, Noordman E J M, Pelgrum H, Davids G, Thoreson B P, Allen R G.2005. SEBAL model with remotely sensed data to improve water-resources management under actual field condition.J Irrig Drain E, 131(1): 85-93. |
| [5] | Bausch W C, Neale C M U.1987. Crop coefficients derived from reflected canopy radiation: A concept.T ASAE, 30(3): 703-709. |
| [6] | Bausch W C, Neale C M U.1989. Spectral inputs improve corn crop coefficients and irrigation scheduling.T ASAE, 32(6): 1901-1908. |
| [7] | Bausch W C.1995. Remote sensing of crop coefficients for improving the irrigation scheduling of corn.Agr Water Manage, 27: 55-68. |
| [8] | Belmonte A C, Jochum A M, Garcia A C, Rodriguez A M, Fuster P L.2005. Irrigation management from space: Towards user-friendly products.Irrig Drain Syst, 19: 337-353. |
| [9] | Blanka V, Ladányi Z, Szilassi P, Sipos G, Rácz A, Szatmári J.2017. Public perception on hydro-climatic extremes and water management related to environmental exposure, SE Hungary.Water Resour Manag, 31(5): 1619-1634. |
| [10] | Campos I, Neale C M U, Calera A, Balbontin C, González- Piqueras J.2010. Assessing satellite-based basal crop coefficients for irrigated grapes (Vitis vinifera L.). Agr Water Manage, 22(17): 3357-3362. |
| [11] | Choudhury B J, Ahmed N U, Idso S B, Reginato R J, Daughtry C S T.1994. Relations between evaporation coefficients and vegetation indices studied by model simulations.Remote Sens Environ, 50(1): 1-17. |
| [12] | de Santa Olalla F M, Calera A, Domínguez A.2003. Monitoring irrigation water use by combining irrigation advisory service, and remotely sensed data with a geographic information system.Agr Water Manage, 61(2): 111-124. |
| [13] | Gao Y C, Long D, Li Z L.2008. Estimation of daily evapotranspiration from remotely sensed data under complex terrain over the upper Chao river basin in north China.Int J Remote Sens, 29: 3295-3315. |
| [14] | Garatuza-Payan J, Watts C J.2005. The use of remote sensing for estimating ET of irrigated wheat and cotton in Northwest Mexico.Irrig Drain Syst, 19: 301-320. |
| [15] | Glenn E P, Neale C M U, Hunsaker D J, Nagler P L.2011. Vegetation index-based crop coefficients to estimate evapotranspiration by remote sensing in agricultural and natural ecosystems.Hydrol Process, 25: 4050-4062. |
| [16] | Gonzalez-Dugo M P, Escuin S, Cano F, Cifuentes V, Padilla F L M, Tirado J L, Oyonarte N, Fernandez P, Mateos L.2013. Monitoring evapotranspiration of irrigated crops using crop coefficient derived from time series of satellite images: II. Application on basin scale.Agr Water Manage, 125: 92-104. |
| [17] | Gonzalez-Dugo M P, Mateos L.2008. Spectral vegetation indices for benchmarking water productivity of irrigated cotton and sugarbeet crops.Agr Water Manage, 95(1): 48-58. |
| [18] | Gowda P H, Chavez J L, Colaizzi P D, Evett S R, Howell T A, Tolk J L.2008. ET mapping for agricultural water management: Present status and challenges. Irrigation Sci, 26(3): 223-237. |
| [19] | Güçlü Y S, Subyani A M, Sen Z.2017. Regional fuzzy chain model for evapotranspiration estimation.J Hydrol, 544: 233-241. |
| [20] | Hadinia H, Pirmoradian N, Ashrafzadeh A.2017. Effect of changing climate on rice water requirement in Guilan, north of Iran.J Water Clim Chang, 8(1): 177-190. |
| [21] | Hadjimitsis D G, Papadavid G, Agapiou A, Themistocleous K, Hadjimitsis M G, Retalis A, Michaelides S, Chrysoulakis N, Toulios L, Clayton C R I.2010. Atmospheric correction for satellite remotely sensed data intended for agricultural applications: Impact on vegetation indices.Nat Hazard Earth Sys, 10: 89-95. |
| [22] | Heilman J L, Heilman W E, Moore D G.1982. Evaluating the crop coefficient using spectral reflectance.Agron J, 74(6): 967-971. |
| [23] | Hunsaker D J, Pinter Jr P J, Barnes E M, Kimball B A.2003. Estimating cotton evapotranspiration crop coefficients with a multispectral vegetation index.Irrigation Sci, 22(2): 95-104. |
| [24] | Hunsaker D J, Pinter Jr P J, Kimball B A.2005a. Wheat basal crop coefficients determined by normalized difference vegetation index.Irrigation Sci, 24(1): 1-14. |
| [25] | Hunsaker D J, Barnes E M, Clarke T R, Fitzgerald G J, Pinter Jr P J.2005b. Cotton irrigation scheduling using remotely sensed and FAO-56 basal crop coefficients.T ASAE, 48(4): 1395-1407. |
| [26] | Kamble B, Kilic A, Hubbard K.2013. Estimating crop coefficients using remote sensing-based vegetation index.Remote Sens, 5(4): 1588-1602. |
| [27] | Kite G W, Droogers P.2000. Comparing evapotranspiration estimates from satellites, hydrological models and field data.J Hydrol, 229: 3-18. |
| [28] | Mateos L, Gonzalez-Dogo M P, Testi L, villalobos F J.2013. Monitoring evapotranspiration of irrigated crops using crop coefficient derived from time series of satellite images: I. Method validation.Agr Water Manage, 125: 81-91. |
| [29] | Neal C M U, Bausch W C, Heerman D F.1989. Development of reflectance-based crop coefficients for corn.T ASAE, 32(6): 1891-1900. |
| [30] | Nistor M M.2016a. Seasonal analysis of crop evapotranspiration based on Penman-Monteith equation in Po River Delta, Italy. In: Italy: Economic, Social and Environmental Issue. New York, USA: Nova Science Publishers. |
| [31] | Nistor M M.2016b. Mapping evapotranspiration coefficients in the Paris metropolitan area.GEO Review, 26(1): 138-153. |
| [32] | Odi-Lara M, Campos I, Neale C M U, Ortege-Farias S, Poblete-Echeverria C, Balbontin C, Calera A.2016. Estimating evapotranspiration of an apple orchard using a remote sensing-based soil water balance. Remote Sens, 8(253): 1-20. |
| [33] | Rossi S, Rampini A, Bocchi S, Boschetti M.2010. Operational monitoring of daily crop water requirements at the regional scale with time series of satellite data.J Irrig Drain E, 136(4): 225-231. |
| [34] | Song C, Woodcock C E, Seto K C, Lenney M P, Macomber S A.2001. Classification and change detection using Landsat TM data: When and how to correct atmospheric effects.Remote Sens Environ, 75(2): 230-244. |
| [35] | Taherparvar M, Pirmoradin N, Vazifedoust M.2017. Comparison of gap filling methods in Landsat 7 ETM+ images to estimate crop coefficient.Iran J Soil Water Res, 47: 665-676. (in Persian with English abstract) |
| [36] | Tasumi M, Allen R G, Trezza R, Wright J L.2005. Satellite-based energy balance to assess within-population variance crop coefficient curves.J Irrig Drain E, 131(1): 94-139. |
| [1] | WANG Lin, ZHANG Fucun, JING Yuanshu, JIANG Xiaodong, YANG Shenbin, HAN Xiaomei. Multi-Temporal Detection of Rice Phenological Stages Using Canopy Spectrum [J]. RICE SCIENCE, 2014, 21(2): 108-115. |
| [2] | Chusnul ARIF1,3, Budi Indra SETIAWAN1, Hanhan Ahmad SOFIYUDDIN2, Lolly Martina MARTIEF2, Masaru MIZOGUCHI3, Ryoichi DOI3. Estimating Crop Coefficient in Intermittent Irrigation Paddy Fields Using Excel Solver [J]. RICE SCIENCE, 2012, 19(2): 143-152. |
| [3] | WANG Fu-min, HUANG Jing-feng, TANG Yan-lin, WANG Xiu-zhen. New Vegetation Index and Its Application in Estimating Leaf Area Index of Rice [J]. RICE SCIENCE, 2007, 14(3): 195-203 . |
| [4] |
TANG Yan-lin, HUANG Jing-feng, WANG Ren-chao.
Change Law of Hyperspectral Data in Related with Chlorophyll and Carotenoid in Rice at Different Developmental Stages [J]. RICE SCIENCE, 2004, 11(5-6): 274-282 . |
| Viewed | ||||||
|
Full text |
|
|||||
|
Abstract |
|
|||||