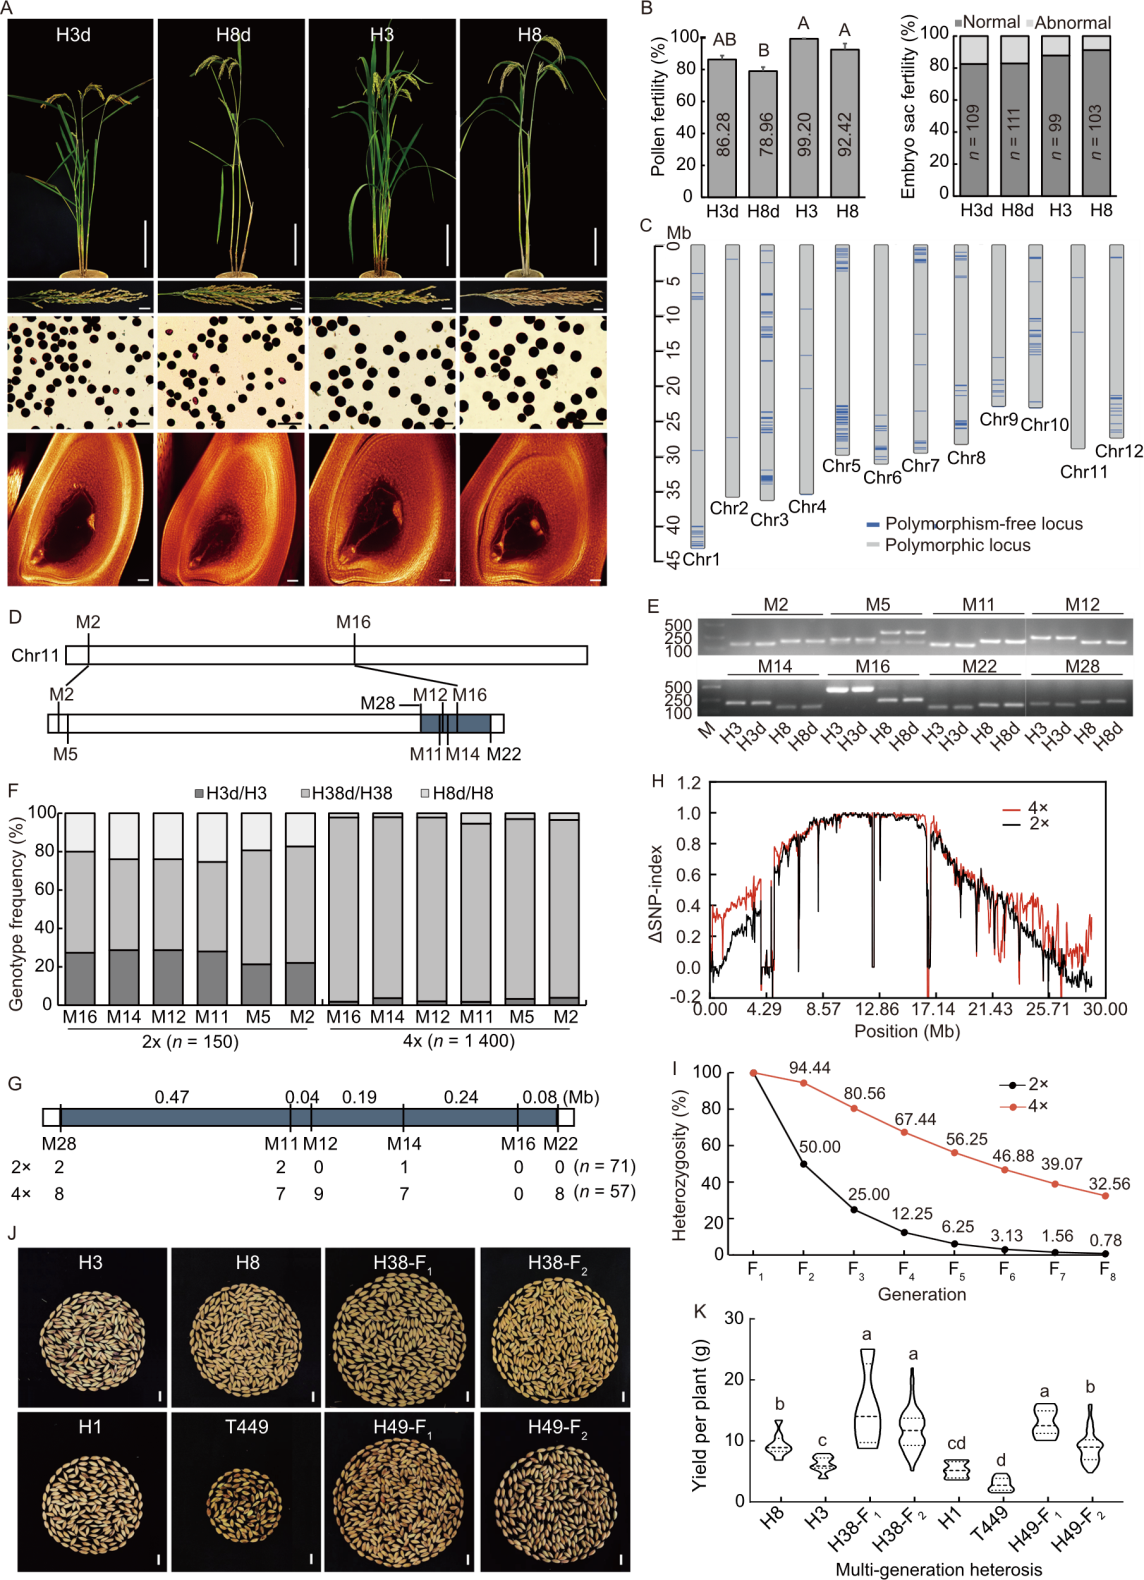
Fig. 1. Genetic analysis and multi-generation heterosis assessment in neo-tetraploid rice. A, Plant type (scale bars, 20 cm), panicles (scale bars, 2 cm), pollen grains stained with 1% I2-KI solution (scale bars, 100 μm), and mature embryo sacs (scale bars, 40 μm) of H3d, H8d, H3, and H8. B, Pollen fertility and embryo sac fertility of H3d, H8d, H3, and H8. C, Distribution of polymorphic loci on 12 rice chromosomes (Chr). D, Location of molecular markers (M2, M5, M11, M12, M14, M16, M22, and M28) on chromosome 11. E, Genotyping of H3, H3d, H8, and H8d using molecular markers. ‘M’ indicates DNA marker; M2, M5, M11, M12, M14, M16, M22, and M28 denote polymorphic molecular markers. F‒H, Distributions of molecular marker genotypes (F), recombinant individuals relative to marker M16 (G), and ΔSNP-index on chromosome 11 (H) in diploid (2×) and tetraploid (4×) F2 populations. I, Heterozygote frequencies in 2× and 4× populations from F1 to F8 generations. J and K, Multi-generation heterosis assessment of grain yield per plant in tetraploid hybrids and their parental lines (n ≥ 3). ‘H38’ and ‘H49’ indicate the offspring of H3 × H8 and T449 × H1, respectively. ‘n’ indicates the total number of samples observed in B and G. Different letters above bars in B and K indicate significant differences (uppercase letters: α = 0.01; lowercase letters: α = 0.05; one-way analysis of variance with least significant difference test).
Fig. 1. Genetic analysis and multi-generation heterosis assessment in neo-tetraploid rice. A, Plant type (scale bars, 20 cm), panicles (scale bars, 2 cm), pollen grains stained with 1% I2-KI solution (scale bars, 100 μm), and mature embryo sacs (scale bars, 40 μm) of H3d, H8d, H3, and H8. B, Pollen fertility and embryo sac fertility of H3d, H8d, H3, and H8. C, Distribution of polymorphic loci on 12 rice chromosomes (Chr). D, Location of molecular markers (M2, M5, M11, M12, M14, M16, M22, and M28) on chromosome 11. E, Genotyping of H3, H3d, H8, and H8d using molecular markers. ‘M’ indicates DNA marker; M2, M5, M11, M12, M14, M16, M22, and M28 denote polymorphic molecular markers. F‒H, Distributions of molecular marker genotypes (F), recombinant individuals relative to marker M16 (G), and ΔSNP-index on chromosome 11 (H) in diploid (2×) and tetraploid (4×) F2 populations. I, Heterozygote frequencies in 2× and 4× populations from F1 to F8 generations. J and K, Multi-generation heterosis assessment of grain yield per plant in tetraploid hybrids and their parental lines (n ≥ 3). ‘H38’ and ‘H49’ indicate the offspring of H3 × H8 and T449 × H1, respectively. ‘n’ indicates the total number of samples observed in B and G. Different letters above bars in B and K indicate significant differences (uppercase letters: α = 0.01; lowercase letters: α = 0.05; one-way analysis of variance with least significant difference test).
 ), Lu Zijun1,2,3(