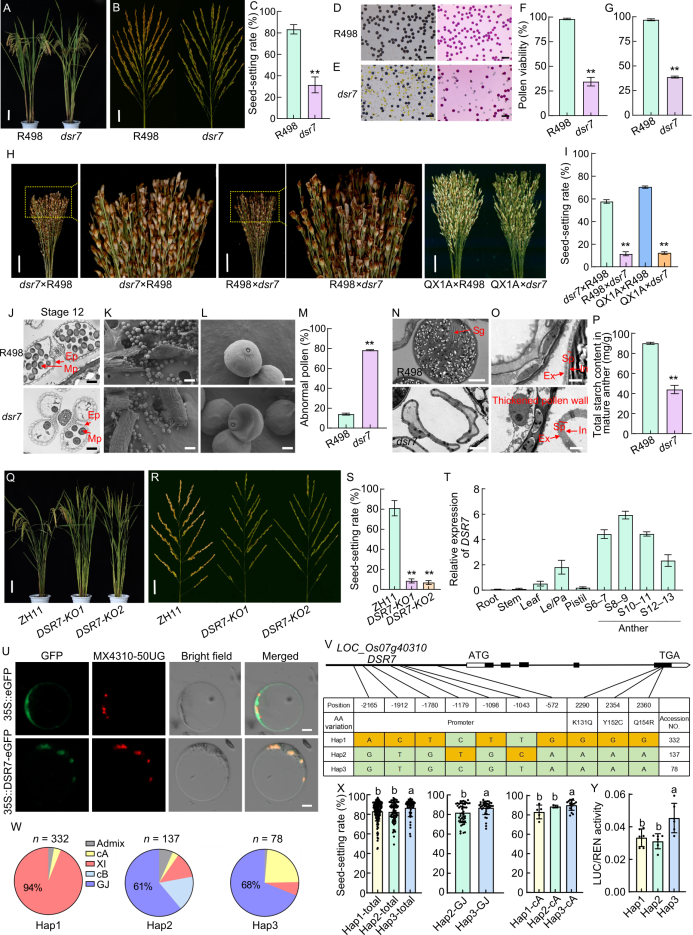
Fig. 1. DSR7 is essential for male fertility in rice by regulating starch accumulation in pollen. A, Plant architecture of Shuhui 498 (R498) and dsr7 mutant at maturity. Scale bar, 10 cm. B, Panicle architecture of R498 and dsr7. Scale bar, 3 cm. C, Statistical analysis of seed-setting rate in R498 and dsr7. Data are mean ± SD (n = 6). D and E, I2-KI staining and Alexander’s staining of pollen from R498 (D) and dsr7 (E); Scale bars, 200 µm. F and G, Pollen viability rates of R498 and dsr7 determined by I2-KI staining (F) and Alexander’s staining (G). Data are mean ± SD (n = 6). H and I, Seed-setting phenotypes from reciprocal crosses and testcrosses with the male-sterile line QX1A. The yellow dashed boxes in the left panels highlight the regions magnified in the adjacent right panels. Scale bars, 3 cm. Data are mean ± SD (n = 3). J, Semi-thin sections of anthers from R498 and dsr7 at the developmental stage 12. Ep, Epidermis; Mp, Mature pollen grain. Scale bars, 20 µm. K, Scanning electron microscopy (SEM) images of mature pollen grains from R498 and dsr7. Scale bars, 100 µm. L, Higher-magnification SEM views of pollen grains from R498 and dsr7. Scale bars, 10 µm. M, Percentage of abnormally shaped pollen grains in R498 and dsr7 determined by SEM. Data are mean ± SD (n = 3). N, Transmission electron microscopy (TEM) images showing starch accumulation in pollen grains of R498 and dsr7. Sg, Starch granule. Scale bars, 10 µm. O, TEM images of the pollen wall structure of R498 and dsr7. Sp, Sporopollenin; Ex, Exine; In, Intine. Scale bars, 2 µm. P, Total starch content in the mature anthers of R498 and dsr7. Data are mean ± SD (n = 3). Q and R, Plant architecture (Q) and panicle morphology (R) of wild type Zhonghua 11 (ZH11) and two independent DSR7 knockout mutants (DSR7-KO1 and DSR7-KO2) at maturity. Scale bars, 10 cm (Q) and 3 cm (R). S, Seed-setting rates of ZH11 and DSR7 knockout mutants. Data are mean ± SD (n = 6). T, Relative expression levels of DSR7 in various tissues. Root, stem, and leaf were sampled at the booting stage; Le/Pa, Lemma/palea; S6-7, S8-9, S10-11, and S12-13 represent anther developmental stages 6-7, 8-9, 10-11, and 12-13, respectively. Data are mean ± SD (n = 3). UBQ5 and FhaB were selected as internal reference genes. U, Subcellular localization of DSR7-eGFP in rice protoplasts. Mitochondria were labeled with MitoTracker Deep Red FM (MX4310-50UG). Scale bars, 10 µm. V, Sequence variations in the DSR7 locus defined three major haplotypes (Hap1, Hap2, and Hap3). W, Distribution of the three DSR7 haplotypes across subgroups within the germplasm population. Admix, Admixture; XI, Xian/Indica; GJ, Geng/Japonica; cA, Circum-aus; cB, Circum-basmati. X, Comparison of seed-setting rates among the three haplotypes within the total, GJ, and cA subpopulations. Data are mean ± SD. Among the 547 accessions, seed-setting rate data were available for 318 accessions. Sample sizes (n) for each haplotype are: Total (Hap1: 180, Hap2: 78, Hap3: 60), GJ (Hap2: 47, Hap3: 39), and cA (Hap1: 5, Hap2: 3, Hap3: 18). Y, Comparison of promoter [luciferase (LUC)/renilla luciferase (REN) activities among the three haplotypes. Data are mean ± SD (n = 6). Different lowercase letters above bars indicate statistically significant differences between groups (P < 0.05) as determined by one-way ANOVA followed by Tukey’s HSD (honestly significant difference) post-hoc test for multiple comparisons. Additionally, asterisks ‘*’ denote the results of comparisons with the control group using Student’s t-test (**, P < 0.01).
Fig. 1. DSR7 is essential for male fertility in rice by regulating starch accumulation in pollen. A, Plant architecture of Shuhui 498 (R498) and dsr7 mutant at maturity. Scale bar, 10 cm. B, Panicle architecture of R498 and dsr7. Scale bar, 3 cm. C, Statistical analysis of seed-setting rate in R498 and dsr7. Data are mean ± SD (n = 6). D and E, I2-KI staining and Alexander’s staining of pollen from R498 (D) and dsr7 (E); Scale bars, 200 µm. F and G, Pollen viability rates of R498 and dsr7 determined by I2-KI staining (F) and Alexander’s staining (G). Data are mean ± SD (n = 6). H and I, Seed-setting phenotypes from reciprocal crosses and testcrosses with the male-sterile line QX1A. The yellow dashed boxes in the left panels highlight the regions magnified in the adjacent right panels. Scale bars, 3 cm. Data are mean ± SD (n = 3). J, Semi-thin sections of anthers from R498 and dsr7 at the developmental stage 12. Ep, Epidermis; Mp, Mature pollen grain. Scale bars, 20 µm. K, Scanning electron microscopy (SEM) images of mature pollen grains from R498 and dsr7. Scale bars, 100 µm. L, Higher-magnification SEM views of pollen grains from R498 and dsr7. Scale bars, 10 µm. M, Percentage of abnormally shaped pollen grains in R498 and dsr7 determined by SEM. Data are mean ± SD (n = 3). N, Transmission electron microscopy (TEM) images showing starch accumulation in pollen grains of R498 and dsr7. Sg, Starch granule. Scale bars, 10 µm. O, TEM images of the pollen wall structure of R498 and dsr7. Sp, Sporopollenin; Ex, Exine; In, Intine. Scale bars, 2 µm. P, Total starch content in the mature anthers of R498 and dsr7. Data are mean ± SD (n = 3). Q and R, Plant architecture (Q) and panicle morphology (R) of wild type Zhonghua 11 (ZH11) and two independent DSR7 knockout mutants (DSR7-KO1 and DSR7-KO2) at maturity. Scale bars, 10 cm (Q) and 3 cm (R). S, Seed-setting rates of ZH11 and DSR7 knockout mutants. Data are mean ± SD (n = 6). T, Relative expression levels of DSR7 in various tissues. Root, stem, and leaf were sampled at the booting stage; Le/Pa, Lemma/palea; S6-7, S8-9, S10-11, and S12-13 represent anther developmental stages 6-7, 8-9, 10-11, and 12-13, respectively. Data are mean ± SD (n = 3). UBQ5 and FhaB were selected as internal reference genes. U, Subcellular localization of DSR7-eGFP in rice protoplasts. Mitochondria were labeled with MitoTracker Deep Red FM (MX4310-50UG). Scale bars, 10 µm. V, Sequence variations in the DSR7 locus defined three major haplotypes (Hap1, Hap2, and Hap3). W, Distribution of the three DSR7 haplotypes across subgroups within the germplasm population. Admix, Admixture; XI, Xian/Indica; GJ, Geng/Japonica; cA, Circum-aus; cB, Circum-basmati. X, Comparison of seed-setting rates among the three haplotypes within the total, GJ, and cA subpopulations. Data are mean ± SD. Among the 547 accessions, seed-setting rate data were available for 318 accessions. Sample sizes (n) for each haplotype are: Total (Hap1: 180, Hap2: 78, Hap3: 60), GJ (Hap2: 47, Hap3: 39), and cA (Hap1: 5, Hap2: 3, Hap3: 18). Y, Comparison of promoter [luciferase (LUC)/renilla luciferase (REN) activities among the three haplotypes. Data are mean ± SD (n = 6). Different lowercase letters above bars indicate statistically significant differences between groups (P < 0.05) as determined by one-way ANOVA followed by Tukey’s HSD (honestly significant difference) post-hoc test for multiple comparisons. Additionally, asterisks ‘*’ denote the results of comparisons with the control group using Student’s t-test (**, P < 0.01).

 ), Yuan Hua(