Rice Science ›› 2017, Vol. 24 ›› Issue (3): 173-180.DOI: 10.1016/j.rsci.2017.02.001
• Orginal Article • Previous Articles Next Articles
Sharifi Peyman1( ), Aminpanah Hashem1, Erfani Rahman2, Mohaddesi Ali3, Abbasian Abouzar4
Received:2016-10-03
Accepted:2017-02-17
Online:2017-05-28
Published:2017-03-03
Sharifi Peyman, Aminpanah Hashem, Erfani Rahman, Mohaddesi Ali, Abbasian Abouzar. Evaluation of Genotype × Environment Interaction in Rice Based on AMMI Model in Iran[J]. Rice Science, 2017, 24(3): 173-180.
Add to citation manager EndNote|Ris|BibTeX
| Genotype | Parent | Origin |
|---|---|---|
| G1 | Shiroudi × Khazar | Iran |
| G2 | IR64669-153-2-3-(A8948) × (Surinam × Deylamani) | Iran |
| G3 | IR67015-22-6-2-(A37632) × (Amol 3 × Number 3) | Iran |
| G4 | IR67015-22-6-2-(A37632) × (Amol 3 × Number 3) | Iran |
| G5 | IR67015-22-6-2-(A37632) × (Amol 3 × Number 3) | Iran |
| G6 | IR67015-22-6-2-(A37632) × (Amol 3 × Number 3) | Iran |
| G7 | IR67015-22-6-2-(A37632) × (Amol 3 × Number 3) | Iran |
| G8 | 843 (check variety) | Iran |
| G9 | Shiroudi (check variety) | Iran |
Table 1 Pedigrees related to genotypes.
| Genotype | Parent | Origin |
|---|---|---|
| G1 | Shiroudi × Khazar | Iran |
| G2 | IR64669-153-2-3-(A8948) × (Surinam × Deylamani) | Iran |
| G3 | IR67015-22-6-2-(A37632) × (Amol 3 × Number 3) | Iran |
| G4 | IR67015-22-6-2-(A37632) × (Amol 3 × Number 3) | Iran |
| G5 | IR67015-22-6-2-(A37632) × (Amol 3 × Number 3) | Iran |
| G6 | IR67015-22-6-2-(A37632) × (Amol 3 × Number 3) | Iran |
| G7 | IR67015-22-6-2-(A37632) × (Amol 3 × Number 3) | Iran |
| G8 | 843 (check variety) | Iran |
| G9 | Shiroudi (check variety) | Iran |
| Location | Soil type | Year | Tmax | Tmin | Precipitation (mm) |
|---|---|---|---|---|---|
| Tonekabon | Silty clay loam | 2012 | 28.42 | 21.68 | 357.7 |
| 2013 | 26.6 | 22.04 | 225.8 | ||
| 2014 | 26.02 | 19.1 | 209.9 | ||
| Amol | Silt loam | 2012 | 34.04 | 15.84 | 125.8 |
| 2013 | 32.92 | 15.2 | 97.8 | ||
| 2014 | 34.24 | 14.72 | 103.5 | ||
| Sari | Silt loam | 2012 | 35.34 | 16.76 | 136.9 |
| 2013 | 35.04 | 15.48 | 138 | ||
| 2014 | 35.2 | 14.52 | 101.1 | ||
| Tmax, Maximum temperature; Tmin, Minimum temperature. | |||||
Table 2 Description of environmental factors in three locations in Iran.
| Location | Soil type | Year | Tmax | Tmin | Precipitation (mm) |
|---|---|---|---|---|---|
| Tonekabon | Silty clay loam | 2012 | 28.42 | 21.68 | 357.7 |
| 2013 | 26.6 | 22.04 | 225.8 | ||
| 2014 | 26.02 | 19.1 | 209.9 | ||
| Amol | Silt loam | 2012 | 34.04 | 15.84 | 125.8 |
| 2013 | 32.92 | 15.2 | 97.8 | ||
| 2014 | 34.24 | 14.72 | 103.5 | ||
| Sari | Silt loam | 2012 | 35.34 | 16.76 | 136.9 |
| 2013 | 35.04 | 15.48 | 138 | ||
| 2014 | 35.2 | 14.52 | 101.1 | ||
| Tmax, Maximum temperature; Tmin, Minimum temperature. | |||||
| S.O.V. a | df | SS | MS | Proportion | Noise |
|---|---|---|---|---|---|
| G | 8 | 25 163 913.2 | 3 145 489.1** | 0.30 b | 0.11 d |
| E | 8 | 24 561 020.4 | 3 070 127.5** | 0.29 b | 0.11 d |
| GE | 64 | 34 642 143.0 | 541 283.5** | 0.41 b | 0.62 d |
| Component 1 | 15 | 16 944 012.8 | 1 129 601.8** | 0.49 c | |
| Component 2 | 13 | 8 185 865.6 | 629 681.9** | 0.24 c | |
| Component 3 | 11 | 3 366 417.6 | 306 037.9 | 0.10 c | |
| Component 4 | 9 | 3 102 534.2 | 344 726.0 | 0.09 c | |
| Component 5 | 7 | 2 110 207.7 | 301 458.2 | 0.06 c | |
| Component 6 | 5 | 735 189.0 | 147 037.8 | 0.02 c | |
| Component 7 | 3 | 196 850.2 | 65 616.7 | 0.006 c | |
| Residual | 1 | 1 067.4 | 1 067.4 | 0.00003 c | |
| Error | 162 | 54 335 177.0 | 335 402.3 | ||
| G, Genotype; E, Environment; GE, Genotype × environment interaction; SS, Sum of squares; MS, Mean square. | |||||
| **, Significant at the 0.01 level. | |||||
| a Predicted by the SAS program with repeating 1 000 times splitting data; b Calculated by dividing on total SS of G, E and GE; c Calculated by dividing on SS of GE; d Calculated by [(df × MS Error)/SS]. | |||||
Table 3 ANOVA for AMMI model and Gollob’s F-test and average root mean square predictive difference.
| S.O.V. a | df | SS | MS | Proportion | Noise |
|---|---|---|---|---|---|
| G | 8 | 25 163 913.2 | 3 145 489.1** | 0.30 b | 0.11 d |
| E | 8 | 24 561 020.4 | 3 070 127.5** | 0.29 b | 0.11 d |
| GE | 64 | 34 642 143.0 | 541 283.5** | 0.41 b | 0.62 d |
| Component 1 | 15 | 16 944 012.8 | 1 129 601.8** | 0.49 c | |
| Component 2 | 13 | 8 185 865.6 | 629 681.9** | 0.24 c | |
| Component 3 | 11 | 3 366 417.6 | 306 037.9 | 0.10 c | |
| Component 4 | 9 | 3 102 534.2 | 344 726.0 | 0.09 c | |
| Component 5 | 7 | 2 110 207.7 | 301 458.2 | 0.06 c | |
| Component 6 | 5 | 735 189.0 | 147 037.8 | 0.02 c | |
| Component 7 | 3 | 196 850.2 | 65 616.7 | 0.006 c | |
| Residual | 1 | 1 067.4 | 1 067.4 | 0.00003 c | |
| Error | 162 | 54 335 177.0 | 335 402.3 | ||
| G, Genotype; E, Environment; GE, Genotype × environment interaction; SS, Sum of squares; MS, Mean square. | |||||
| **, Significant at the 0.01 level. | |||||
| a Predicted by the SAS program with repeating 1 000 times splitting data; b Calculated by dividing on total SS of G, E and GE; c Calculated by dividing on SS of GE; d Calculated by [(df × MS Error)/SS]. | |||||
| Genotype | Grain yield | Rank | AMMI-1 | AMMI-2 | AMMI-3 |
|---|---|---|---|---|---|
| (kg/hm2) | |||||
| G1 | 5 809.0 | 6 | -22.73 | -6.22 | -9.18 |
| G2 | 5 632.3 | 7 | -4.98 | 8.4 | 9.96 |
| G3 | 5 264.6 | 9 | 13.02 | -23.97 | 7.82 |
| G4 | 5 298.5 | 8 | 20.29 | -6.84 | -10.12 |
| G5 | 5 709.7 | 5 | 30.1 | 18.77 | -5.41 |
| G6 | 6 020.8 | 4 | -5.17 | 4.66 | 26.05 |
| G7 | 6 213.7 | 1 | -3.99 | -13.06 | -5.89 |
| G8 | 6 093.3 | 2 | -10.83 | 9.22 | 2.04 |
| G9 | 6 030.9 | 3 | -15.72 | 9.03 | -15.28 |
| AMMI-1, AMMI-2 and AMMI-3 are the first three interaction principal component environments, respectively. | |||||
Table 4 Average yield and first three AMMI parameters for nine rice genotypes.
| Genotype | Grain yield | Rank | AMMI-1 | AMMI-2 | AMMI-3 |
|---|---|---|---|---|---|
| (kg/hm2) | |||||
| G1 | 5 809.0 | 6 | -22.73 | -6.22 | -9.18 |
| G2 | 5 632.3 | 7 | -4.98 | 8.4 | 9.96 |
| G3 | 5 264.6 | 9 | 13.02 | -23.97 | 7.82 |
| G4 | 5 298.5 | 8 | 20.29 | -6.84 | -10.12 |
| G5 | 5 709.7 | 5 | 30.1 | 18.77 | -5.41 |
| G6 | 6 020.8 | 4 | -5.17 | 4.66 | 26.05 |
| G7 | 6 213.7 | 1 | -3.99 | -13.06 | -5.89 |
| G8 | 6 093.3 | 2 | -10.83 | 9.22 | 2.04 |
| G9 | 6 030.9 | 3 | -15.72 | 9.03 | -15.28 |
| AMMI-1, AMMI-2 and AMMI-3 are the first three interaction principal component environments, respectively. | |||||
| Genotype | EV1 | EV2 | EV4 | SIPC2 | ASV | MASV | GI | E | EI |
|---|---|---|---|---|---|---|---|---|---|
| g1 | 0.013 | 0.16 | 0.16 | 1.15 | 30.2 | 41.44 | 23.09 | e1 | 474.2 |
| g2 | 0.078 | 0.09 | 0.11 | 0.73 | 10.61 | 23.88 | -153.61 | e2 | -118.43 |
| g3 | 0.201 | 0.1 | 0.08 | 1.76 | 29.34 | 55.56 | -521.24 | e3 | -281.43 |
| g4 | 0.218 | 0.11 | 0.07 | 1.83 | 27.25 | 39.64 | -487.39 | e4 | 175.61 |
| g5 | 0.099 | 0.09 | 0.13 | 0.92 | 43.4 | 63.73 | -76.17 | e5 | -79.72 |
| g6 | 0.068 | 0.09 | 0.11 | 0.63 | 8.18 | 34.68 | 234.94 | e6 | -263.83 |
| g7 | 0.168 | 0.11 | 0.06 | 1.93 | 14.05 | 28.91 | 427.83 | e7 | 320.87 |
| g8 | 0.108 | 0.06 | 0.15 | 1.46 | 16.83 | 26.67 | 307.46 | e8 | -535.54 |
| g9 | 0.048 | 0.18 | 0.12 | 1.58 | 22.34 | 40.3 | 245.06 | e9 | 308.24 |
| EV, Eigenvector; SIPC, Sum of interaction principal component scores; ASV, AMMI stability value; MASV, Modified AMMI stability value; GI, Genotypic index; E, Environment; EI, Environmental index; E1, Tonekabon in 2012; E2, Amol in 2012; E3, Sari in 2012; E4, Tonekabon in 2013; E5, Amol in 2013; E6, Sari in 2013; E7, Tonekabon in 2014; E8, Amol in 2014; E9, Sari in 2014. | |||||||||
Table 5 Values of AMMI stability parameters for nine rice genotypes
| Genotype | EV1 | EV2 | EV4 | SIPC2 | ASV | MASV | GI | E | EI |
|---|---|---|---|---|---|---|---|---|---|
| g1 | 0.013 | 0.16 | 0.16 | 1.15 | 30.2 | 41.44 | 23.09 | e1 | 474.2 |
| g2 | 0.078 | 0.09 | 0.11 | 0.73 | 10.61 | 23.88 | -153.61 | e2 | -118.43 |
| g3 | 0.201 | 0.1 | 0.08 | 1.76 | 29.34 | 55.56 | -521.24 | e3 | -281.43 |
| g4 | 0.218 | 0.11 | 0.07 | 1.83 | 27.25 | 39.64 | -487.39 | e4 | 175.61 |
| g5 | 0.099 | 0.09 | 0.13 | 0.92 | 43.4 | 63.73 | -76.17 | e5 | -79.72 |
| g6 | 0.068 | 0.09 | 0.11 | 0.63 | 8.18 | 34.68 | 234.94 | e6 | -263.83 |
| g7 | 0.168 | 0.11 | 0.06 | 1.93 | 14.05 | 28.91 | 427.83 | e7 | 320.87 |
| g8 | 0.108 | 0.06 | 0.15 | 1.46 | 16.83 | 26.67 | 307.46 | e8 | -535.54 |
| g9 | 0.048 | 0.18 | 0.12 | 1.58 | 22.34 | 40.3 | 245.06 | e9 | 308.24 |
| EV, Eigenvector; SIPC, Sum of interaction principal component scores; ASV, AMMI stability value; MASV, Modified AMMI stability value; GI, Genotypic index; E, Environment; EI, Environmental index; E1, Tonekabon in 2012; E2, Amol in 2012; E3, Sari in 2012; E4, Tonekabon in 2013; E5, Amol in 2013; E6, Sari in 2013; E7, Tonekabon in 2014; E8, Amol in 2014; E9, Sari in 2014. | |||||||||
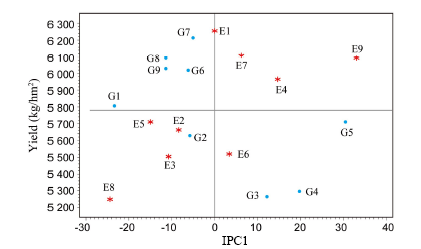
Fig. 1. AMMI-1 model biplot for grain yield of nine rice genotypes in nine environments.( E1, Tonekabon in 2012; E2, Amol in 2012; E3, Sari in 2012; E4, Tonekabon in 2013; E5, Amol in 2013; E6, Sari in 2013; E7, Tonekabon in 2014; E8, Amol in 2014; E9, Sari in 2014.)
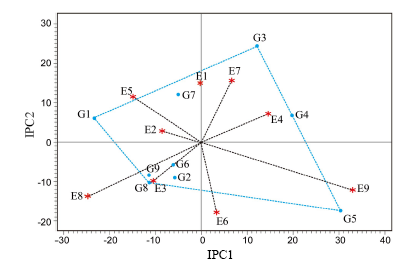
Fig. 2. AMMI-2 model biplot for IPC1 vs IPC2 for nine rice genotypes in nine environments.( E1, Tonekabon in 2012; E2, Amol in 2012; E3, Sari in 2012; E4, Tonekabon in 2013; E5, Amol in 2013; E6, Sari in 2013; E7, Tonekabon in 2014; E8, Amol in 2014; E9, Sari in 2014.)
| 1 | Adugna W, Labuschagne M T.2002. Genotype-environment interactions and phenotypic stability analyses of linseed in Ethiopia.Plant Breeding, 121(1): 66-71. |
| 2 | Akbarpour O, Dehghani H, Sorkhi B, Gauch H G.2014. Evaluation of genotype × environment interaction in barley (Hordeum Vulgare L.) based on AMMI model using developed SAS program. J Agric Sci Technol, 16: 909-920. |
| 3 | Akter A, Hasan M J, Kulsum M U, Rahman M H, Paul A K, Lipi L F, Akter S.2015. Genotype × environment interaction and yield stability analysis in hybrid rice (Oryza sativa L.) by AMMI biplot. Bangl Rice J, 19(2): 83-90. |
| 4 | Becker H C, Léon J.1988. Stability analysis in plant breeding.Plant Breeding, 101(1): 1-23. |
| 5 | Blanche S B, Utomo H S, Wenefrida I, Myers G O.2009. Genotype × environment interactions of hybrid and varietal rice cultivars for grain yield and milling quality.Crop Sci, 49(6): 2011-2018. |
| 6 | Bose L K, Jambhulkar N N, Pande K, Singh O N.2014a. Use of AMMI and other stability statistics in the simultaneous selection of rice genotypes for yield and stability under direct-seeded conditions.Chil J Agric Res, 74(1): 1-7. |
| 7 | Bose L K, Jambhulkar N N, Singh O N.2014b. Additive main effects and multiplicative interaction (AMMI) analysis of grain yield stability in early duration rice.J Anim Plant Sci, 24(6): 1885-1897. |
| 8 | Crossa J.1990. Statistical analysis of multilocation trials.Adv Agron, 44: 55-85. |
| 9 | Crossa J, Gauch H G, Zobel R W.1990. Additive main effects and multiplicative interactions analysis of two international maize cultivar trials.Crop Sci, 30(3): 493-500. |
| 10 | Dehghani H, Sabaghpour S H, Ebadi A.2010. Study of genotype × environment interaction for chickpea yield in Iran.Agron J, 102(1): 1-8. |
| 11 | Eberhart S A, Russell W A.1966. Stability parameters for comparing varieties.Crop Sci, 6(1): 36-40. |
| 12 | FAO 2016. Fao statistic. AO 2016. Fao statistic.. |
| 13 | Finlay K W, Wilkinson G N.1963. The analysis of adaptation in a plant breeding programme.Aust J Agric Res, 14(6): 742-754. |
| 14 | Gabriel K R.1978. Analysis of meteorological data by means of canonical decomposition and biplots.J Appl Meteor, 11: 1072-1077. |
| 15 | Gauch H G.1992. Statistical Analysis of Regional Yield Trials: AMMI Analysis of Factorial Designs. Amsterdam, the Netherlands: Elsevier. |
| 16 | Gauch H G, Zobel R W.1996. AMMI analyses of yield trials. In: Kang M S, Gauch H G. Genotype by Environment Interaction. Boca Raton, Florida: CRC: 85-122. |
| 17 | Gauch H G, Zobel R W.1997. Identifying mega-environments and targeting genotypes.Crop Sci, 37(2): 311-326. |
| 18 | Gollob H F.1968. A statistical model which combines features of factor analytic and analysis of variance techniques.Psychometrika, 33(1): 73-115. |
| 19 | Hill J.1975. Genotype × environment interactions: A challenge to plant breeding.J Agric Sci, 85(3): 477-493. |
| 20 | Karimizadeh R, Mohammadi M, Shefazadeh M K, Mahmoodi A A, Rostami B, Karimpour F.2012. Relationship among and repeatability of ten stability indices for grain yield of food lentil genotypes in Iran.Turk J Field Crop, 17(1): 51-61. |
| 21 | Katsura K, Tsujimoto Y, Oda M, Matsushima K, Inusah B, Dogbe W, Sakagami J I.2016. Genotype-by-environment interaction analysis of rice (Oryza spp.) yield in a floodplain ecosystem in West Africa. Eur J Agron, 73: 152-159. |
| 22 | Khatun H, Islam R, Anisuzzaman M, Ahmed H U, Haque M.2015. GGE bipot analysis of genotype × environment interaction in rice (Oryza sativa L.) genotypes in Bangladesh. Sci Agric, 12(1): 34-39. |
| 23 | Mostafavi K, Hosseini Imeni S S, Firoozi M.2014. Stability analysis of grain yield in lines and cultivars of rice (Oryza sativa L.) using AMMI (additive main effects and multiplicative interaction) method. Iran J Field Crop Sci, 45(3): 445-452. (in Persian with English abstract) |
| 24 | Nasiri M, Pirdashti H.2003. Effect of level and time of nitrogen on yield component of rice rationing.J Biol Sci, 2: 217-222. |
| 25 | Nath D, Dasgupta T.2013. Genotype × Environment interaction and stability analysis in Mungbean.J Agric Vet Sci, 5(1): 62-70. |
| 26 | Nayak D, Bose L K, Singh S, Nayak P.2008. Additive main effects and multiplicative interaction analysis of host-pathogen relationship in rice-bacterial blight pathosystems.Plant Path J, 24(3): 337-351. |
| 27 | Purchase J L, Hatting H, van Deventer C S.2000. Genotype × environment interaction of winter wheat (Triticum aestivum L.) in South Africa: II. Stability analysis of yield performance. South Afric J Plant Soil, 17: 101-107. |
| 28 | Romagosa I, Fox P N, Garcia del Moral L F, Ramos J M, Garcia del Moral B, Roca de Togores F, Molina-Cano J L.1993. Integration of statistical and physiological adaptation in barley cultivars.Theor Appl Genet, 86: 822-826. |
| 29 | Sabaghnia N, Sabaghpour S H, Dehghani H.2008. The use of AMMI model and its parameters to analyze yield stability in multi-environment trials.J Agric Sci, 146(5): 571-581. |
| 30 | Saied Z F.2010. Survey of adaptation of thirty rice (Oryza sativa L.) genotypes to west Guilan climatic conditions-Astara. J Crop Ecophysiol, 4(15): 111-126. (in Persian with English abstract) |
| 31 | Samonte S O P, Wilson L T, McClung A M, Medley J C.2005. Targeting cultivars onto rice growing environments using AMMI and SREG GGE biplot analyses.Crop Sci, 45(6): 2414-2424. |
| 32 | Shukla G K.1972. Some statistical aspects of partitioning genotype-environmental components of variability.Heredity, 29(2): 237-245. |
| 33 | Sneller M C, Wang J, Dale J K, Strober W, Middelton L A, Choi Y, Fleisher T A, Lim M S, Jaffe E S, Puck J M, Lenardo M J, Straus S E.1997. Clinical, immunologic, and genetic features of an autoimmune lymphoproliferative syndrome associated with abnormal lymphocyte apoptosis.Blood, 89: 1341-1348. |
| 34 | Tarang A, Chaleshtary M H, Tolghilani A, Esfahani M.2013. Evaluation of grain yield stability of pure lines of rice in Guilan province.Iran J Crop Sci, 15(1): 24-34. (in Persian with English abstract) |
| 35 | Tariku S, Lakew T, Bitew M, Asfaw M.2013. Genotype by environment interaction and grain yield stability analysis of rice (Oryza sativa L.) genotypes evaluated in north western Ethiopia. Net J Agric Sci, 1(1): 10-16. |
| 36 | Yan W K, Hunt L A, Sheng O L, Szlavnics Z.2000. Cultivar evaluation and mega-environment investigation based on the GGE biplot.Crop Sci, 40(3): 597-605. |
| 37 | Yan W K, Rajcan I.2002. Biplots analysis of the test sites and trait relations of soybean in Ontario.Crop Sci, 42(1): 11-20. |
| 38 | Yan W K, Kang M S.2003. GGE Biplot Analysis: A Graphical Tool for Breeders, Geneticists and Agronomists. Boca Raton, USA: CRC Press. |
| 39 | Yates F, Cochran W G.1938. The analysis of groups of experiments.J Agric Sci, 28: 556-580. |
| 40 | Zobel R W, Wright M J, Gauch H G.1988. Statistical analysis of a yield trial.Agron J, 80(3): 388-393. |
| 41 | (Managing Editor: Fang Hongmin) |
| [1] | JI Dongling, XIAO Wenhui, SUN Zhiwei, LIU Lijun, GU Junfei, ZHANG Hao, Tom Matthew HARRISON, LIU Ke, WANG Zhiqin, WANG Weilu, YANG Jianchang. Translocation and Distribution of Carbon-Nitrogen in Relation to Rice Yield and Grain Quality as Affected by High Temperature at Early Panicle Initiation Stage [J]. Rice Science, 2023, 30(6): 12-. |
| [2] | Minghua Zhang, Zhaowen Mo, Juan Liao, Shenggang Pan, Xiongfei Chen, Le Zheng, Xiwen Luo, Zaiman Wang. Lodging Resistance Related to Root Traits for Mechanized Wet-Seeding of Two Super Rice Cultivars [J]. Rice Science, 2021, 28(2): 200-208. |
| [3] | Yuyu Chen, Aike Zhu, Pao Xue, Xiaoxia Wen, Yongrun Cao, Beifang Wang, Yue Zhang, Liaqat Shah, Shihua Cheng, Liyong Cao, Yingxin Zhang. Effects of GS3 and GL3.1 for Grain Size Editing by CRISPR/Cas9 in Rice [J]. Rice Science, 2020, 27(5): 405-413. |
| [4] | Mukherjee Mitadru, Padhy Barada, Srinivasan Bharathkumar, Mahadani Pradosh, Yasin Baksh Sk, Donde Ravindra, Nath Singh Onkar, Behera Lambodar, Swain Padmini, Kumar Dash Sushanta. Revealing Genetic Relationship and Prospecting of Novel Donors Among Upland Rice Genotypes Using qDTY-Linked SSR Markers [J]. Rice Science, 2018, 25(6): 308-319. |
| [5] | Nguyen Le Tieu-Ngoc, Lee Beomgi, Back Kyoungwhan, Soon Kim Young, Cheong Hyeonsook. Coordinated Expression of Cytosolic and Chloroplastic Glutamine Synthetase During Reproductive Stage and Its Impact in GS1 RNAi Transgenic Rice [J]. Rice Science, 2018, 25(5): 250-260. |
| [6] | Mohibul Alam Khan Md, Haque Effi, Chandra Paul Narayan, Abdul Khaleque Md, M. S. Al-Garni Saleh, Rahman Mahfuzur, Tofazzal Islam Md. Enhancement of Growth and Grain Yield of Rice in Nutrient Deficient Soils by Rice Probiotic Bacteria [J]. Rice Science, 2017, 24(5): 264-273. |
| [7] | Vivitha P., Raveendran M., Vijayalakshmi D.. Introgression of QTLs Controlling Spikelet Fertility Maintains Membrane Integrity and Grain Yield in Improved White Ponni Derived Progenies Exposed to Heat Stress [J]. Rice Science, 2017, 24(1): 32-40. |
| [8] | Amanullah, Hidayatullah. Influence of Organic and Inorganic Nitrogen on Grain Yield and Yield Components of Hybrid Rice in Northwestern Pakistan [J]. Rice Science, 2016, 23(6): 326-333. |
| [9] | Manisha KUMARI1, Bavita ASTHIR1, Navtej Singh BAINS2. Temporal Dynamics of Antioxidant Defence System in Relation to Polyamine Catabolism in Rice under Direct-Seeded and Transplanted Conditions [J]. RICE SCIENCE, 2014, 21(6): 343-353. |
| [10] | LIU Qi-hua, WU Xiu, CHEN Bo-cong, MA Jia-qing, GAO Jie. Effects of Low Light on Agronomic and Physiological Characteristics of Rice Including Grain Yield and Quality [J]. RICE SCIENCE, 2014, 21(5): 243-251. |
| [11] | Mohammad H. FOTOKIAN, Kayvan AGAHI. Biplot Analysis of Genotype by Environment for Cooking Quality in Hybrid Rice: A Tool for Line × Tester Data [J]. RICE SCIENCE, 2014, 21(5): 282-287. |
| [12] | MA Yi-hu, GU Dao-jian, LIU Li-jun, WANG Zhi-qin, ZHANG Hao, YANG Jian-chang. Changes in Grain Yield of Rice and Emission of Greenhouse Gases from Paddy Fields after Application of Organic Fertilizers Made from Maize Straw [J]. RICE SCIENCE, 2014, 21(4): 224-232. |
| [13] | Y. V. SINGH, K. K. SINGH, S. K. SHARMA. Influence of Crop Nutrition on Grain Yield, Seed Quality and Water Productivity under Two Rice Cultivation Systems [J]. RICE SCIENCE, 2013, 20(2): 129-138. |
| [14] | Stanley Omar P B. Samonte1, Rodante E. Tabien2, Lloyd T. Wilson2. Parental Selection in Rice Cultivar Improvement [J]. RICE SCIENCE, 2013, 20(1): 45-51. |
| [15] | FU Jing, YANG Jianchang. Research Advances in High-Yielding Cultivation and Physiology of Super Rice [J]. RICE SCIENCE, 2012, 19(3): 177-184. |
| Viewed | ||||||
|
Full text |
|
|||||
|
Abstract |
|
|||||