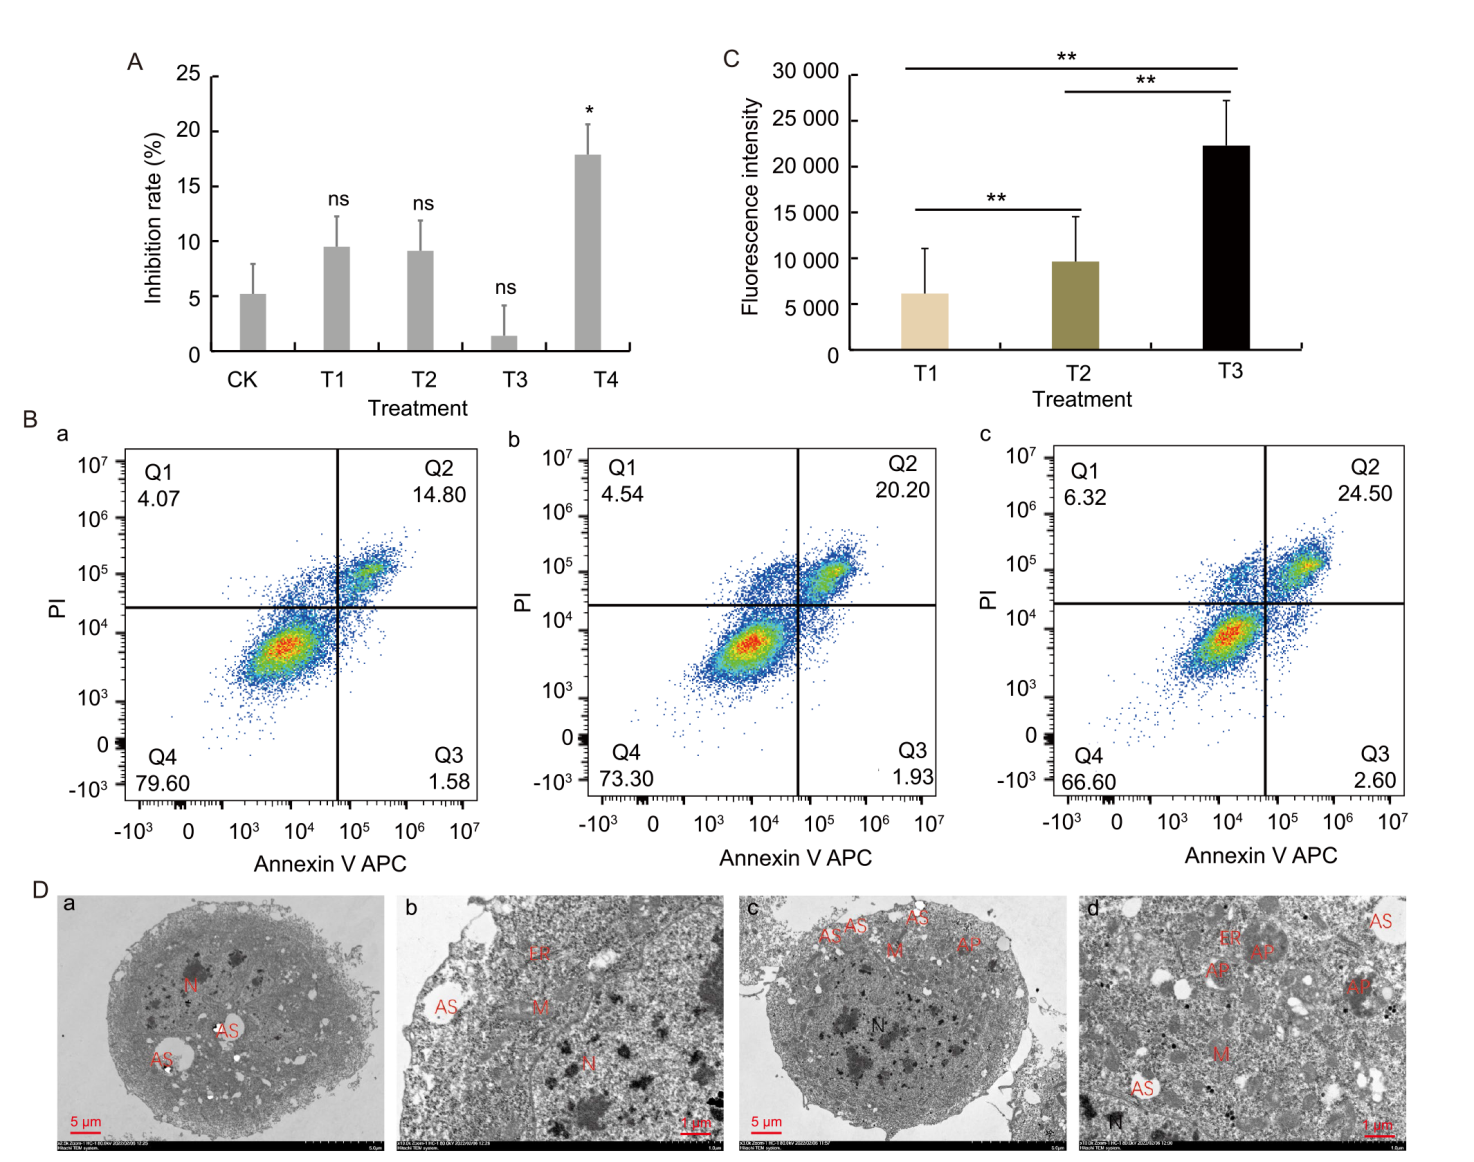
Fig. 1. Impact of chelerythrine on Sf9 cells of Spodoptera frugiperda. A, Inhibition rates of different concentrations of chelerythrine and 16.0 μg/mL abamectin on Sf9 cells of S. frugiperda. B, Fluorescence intensity of Sf9 cells induced by 16.0 μg/mL chelerythrine for 24 h. a, Control (single-cell fluorescence intensity: 16 629); b, Chelerythrine (single-cell fluorescence intensity: 26 630); c, Abamectin (single-cell fluorescence intensity: 17 392). Q1 represents the rate of mechanical necrosis; Q2 represents the late apoptosis rate; Q3 represents the early apoptosis rate; Q4 represents the viable cell rate. PI, Propidium iodide; APC, Allophycocyanin. C, Reactive oxygen species (ROS) production, shown by fluorescence intensity, in Sf9 cells of S. frugiperda treated with 16.0 μg/mL chelerythrine or abamectin for 24 h. T1, Medium containing cells; T2, 16.0 µg/mL abamectin; T3, 12.8 µg/mL chelerythrine. D, Ultrastructure of Sf9 cells induced by 16.0 μg/mL chelerythrine for 24 h. a and b, Untreated Sf9 cells under low-magnification panorama (a, 2.5×) and high magnification (b, 10.0×). c and d, Sf9 cells treated with 16.0 μg /mL chelerythrine under low-magnification panorama (c, 2.5×) and high magnification (d, 10.0×). N, Nucleus; AS, Autolysosome; M, Mitochondrion; ER, Endoplasmic reticulum; AP, Autophagosome. CK, Blank control group (cell-free culture medium); T1, Medium containing cells; T2, 16.0 µg/mL abamectin; T3, 12.8 µg/mL chelerythrine; T4, 16.0 µg/mL chelerythrine. In A and C, * and ** represent the significant differences at the 0.05 and 0.01 levels, respectively, between treatments, while ‘ns’ represents no significant difference, as determined by the t-test.

 ), Liu Chunlai(