Rice Science ›› 2026, Vol. 33 ›› Issue (3): 367-380.DOI: 10.1016/j.rsci.2026.02.010
• Research Papers • Previous Articles Next Articles
Li Wei1,#, Zhang Mengchen1,3,#, Chen Xiaoyang2, Li Yan2, Xu Qun1, Wang Shan1, Feng Yue1, Wei Xinghua1,3( ), Yang Yaolong1()
Received:2025-11-27
Accepted:2026-02-02
Online:2026-05-28
Published:2026-06-02
Contact:
Yang Yaolong (yangyaolong@caas.cn);
Wei Xinghua (weixinghua@caas.cn)
About author:#These authors contributed equally to this work
Li Wei, Zhang Mengchen, Chen Xiaoyang, Li Yan, Xu Qun, Wang Shan, Feng Yue, Wei Xinghua, Yang Yaolong. Genetic Variation and Population Structure of Asian Cultivated Rice[J]. Rice Science, 2026, 33(3): 367-380.
Add to citation manager EndNote|Ris|BibTeX
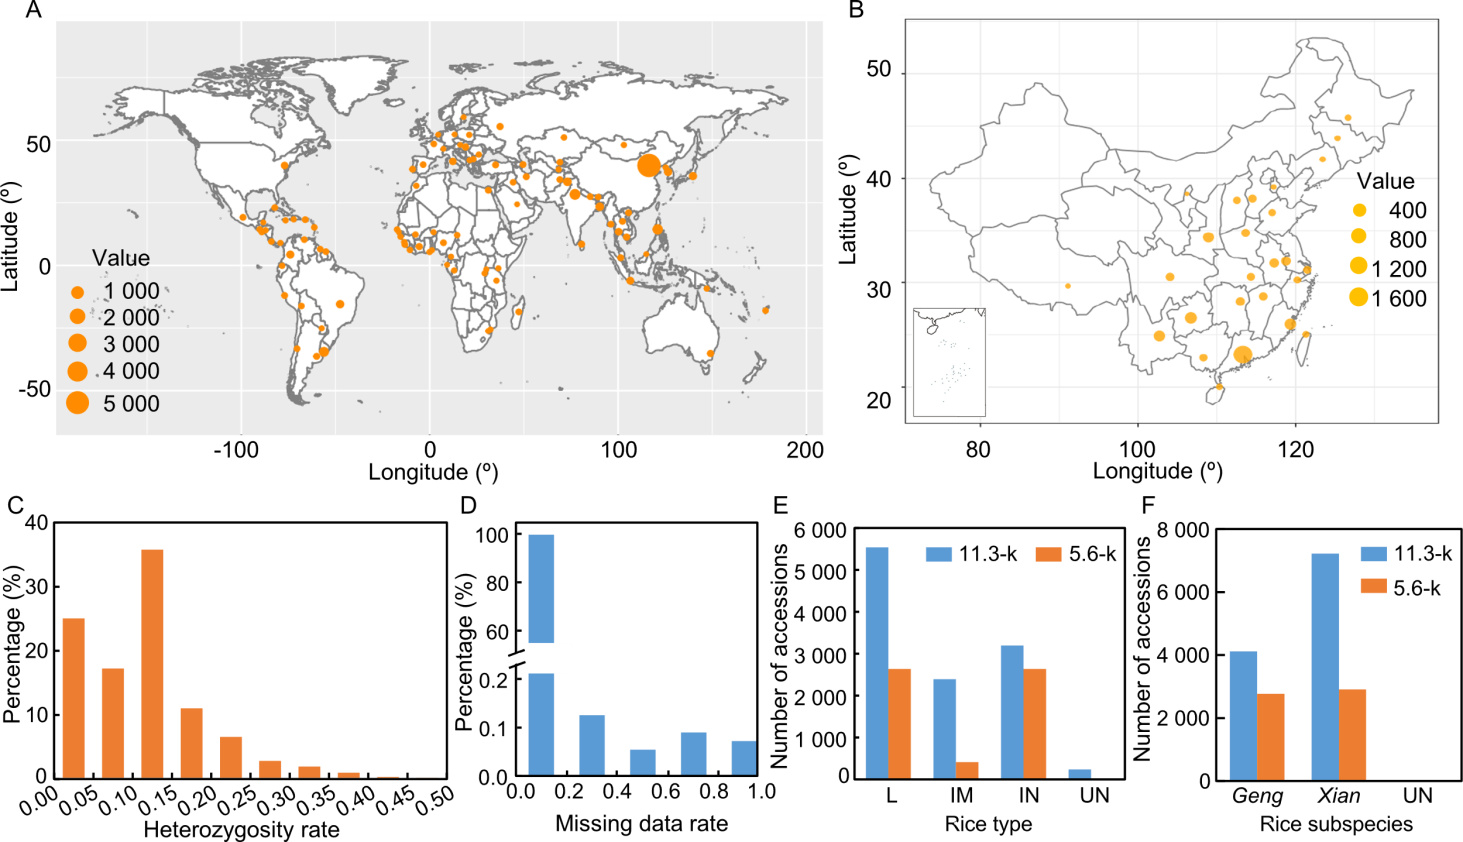
Fig. 1. Comprehensive characteristics of 11 366 (11.3-k) accessions in this study. A, Global geographical distribution of 11.3-k accessions. The size of the solid circles represents the number of varieties. B, Geographical distribution of 7 932 accessions from China. The size of the solid circles represents the number of varieties. C and D, Frequency distribution of 11.3-k accession heterozygosity (C) and missing data rate (D). E and F, Distribution of three rice types (L, IM, and IN) (E) and two rice subspecies (geng/japonica and xian/indica) (F) across 11.3-k and 5.6-k collections. UN, Uncertain type; L, Domestic landraces; IM, Improved domestic varieties; IN, Introduced varieties.
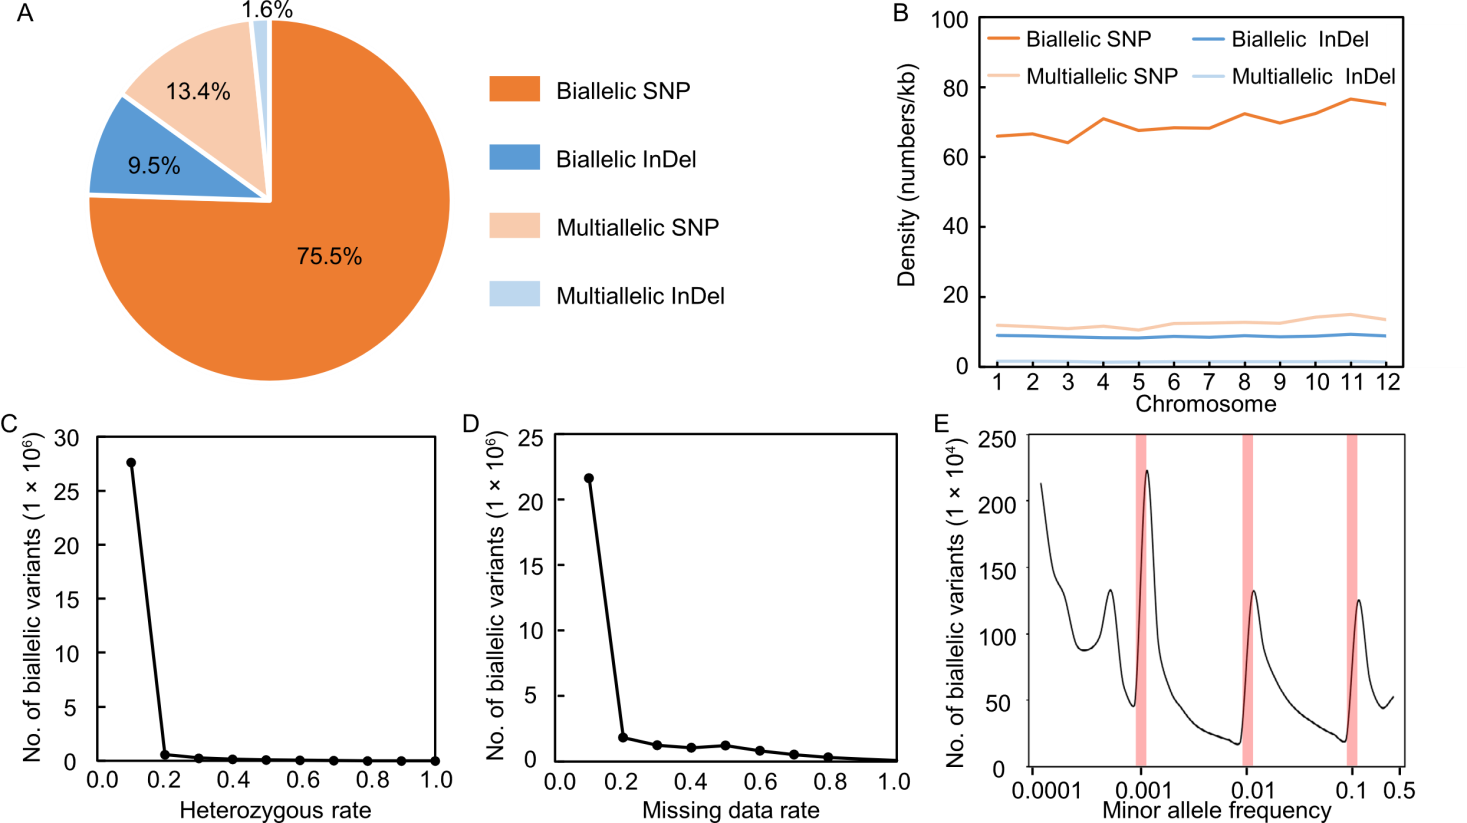
Fig. 2. Identification and evaluation of genomic variants. A, Proportion of single nucleotide polymorphisms (SNPs) and insertions/deletions (InDels) in biallelic and multiallelic variants, respectively. B, Distribution of SNPs and InDels on different chromosomes in both biallelic and multiallelic variants. C-E, Heterozygous rate (C), missing data rate (D), and minor allele frequency (E) distribution of the biallelic variants.
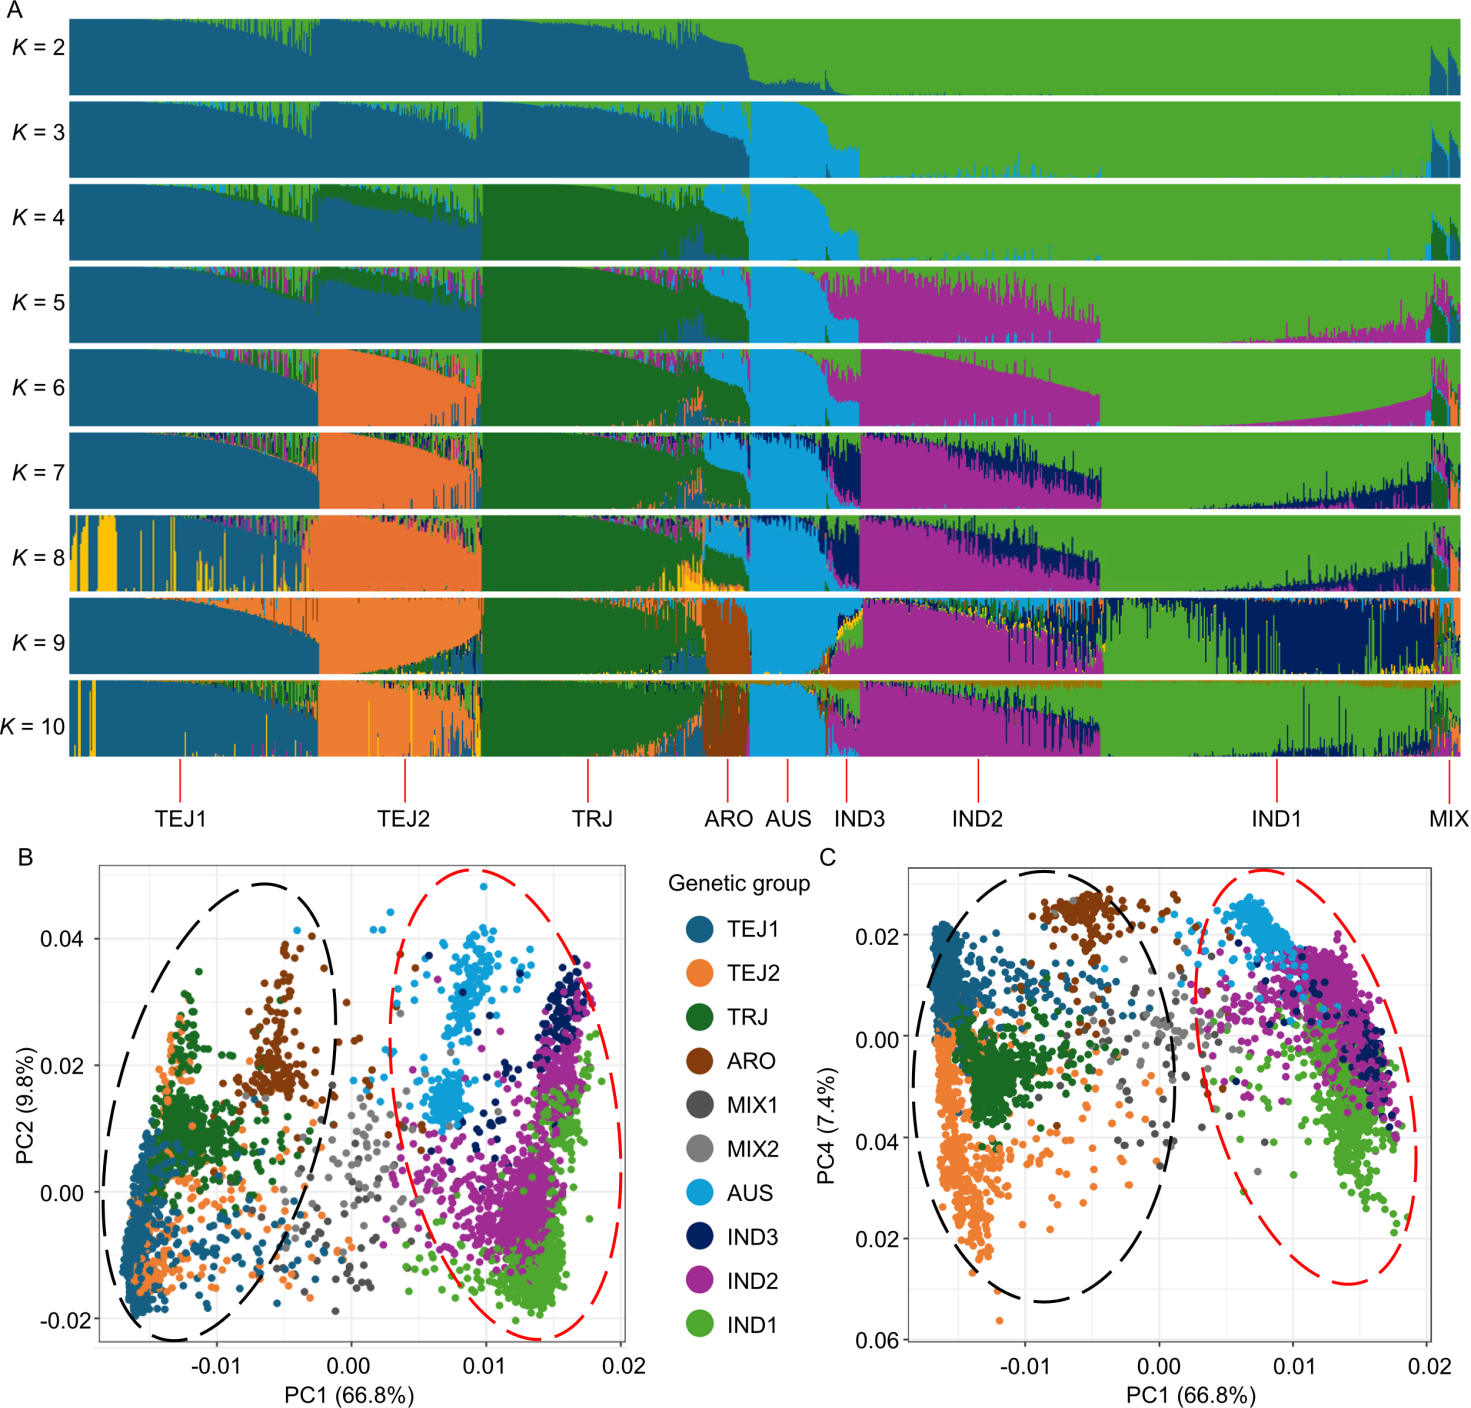
Fig. 3. Population structure analysis based on 5.6-k rice accessions. A, Admixture plot of 5.6-k rice accessions. The columns in ADMIXTURE represent accessions. The accession groups are shown below the plot. B, A clear separation of two subspecies (xian and geng) and eight groups was achieved using the first and second principal components (PC1: 66.8%; PC2: 9.8%). C, Group TEJ2 was clearly distinguished using PC1 and PC4 (7.4%). MIX1 and MIX2 represent mixed groups from China and non-China, respectively. TEJ, Temperate japonica; TRJ, Tropical japonica; ARO, Aromatic; AUS, Aus; IND, Indica.
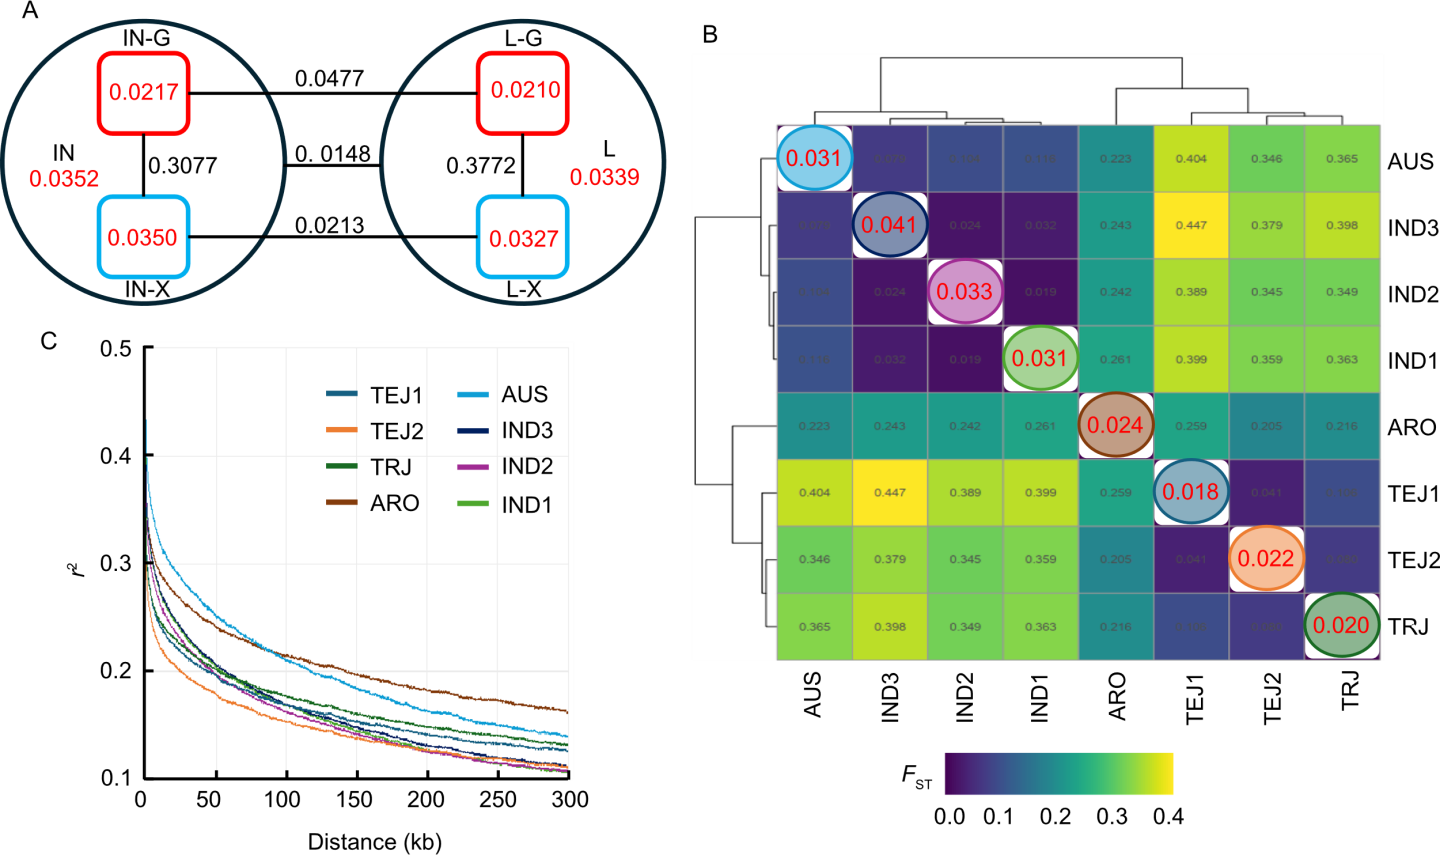
Fig. 4. Population diversity of 5.6 k rice accessions. A, Nucleotide diversity (π) and differentiation coefficient (FST) between introduced varieties (IN) and domestic landraces (L) accessions in different subspecies. G represent geng/japonica subspecies; X represent xian/indica subspecies. IN-G and IN-X represent geng/japonica and xian/indica subspecies in introduced varieties, respectively, and the same for L-G and L-X. The red numbers represent π values, while the black numbers represent the FST values between the two populations connected by the black lines. B, Nucleotide diversity and population divergence among eight major groups. Circles represent π values, and squares represent the heatmap of FST between all pairs of the eight groups. C, Decay of linkage disequilibrium in the whole genome of eight groups. TEJ, Temperate japonica; TRJ, Tropical japonica; ARO, Aromatic; AUS, Aus; IND, Indica.
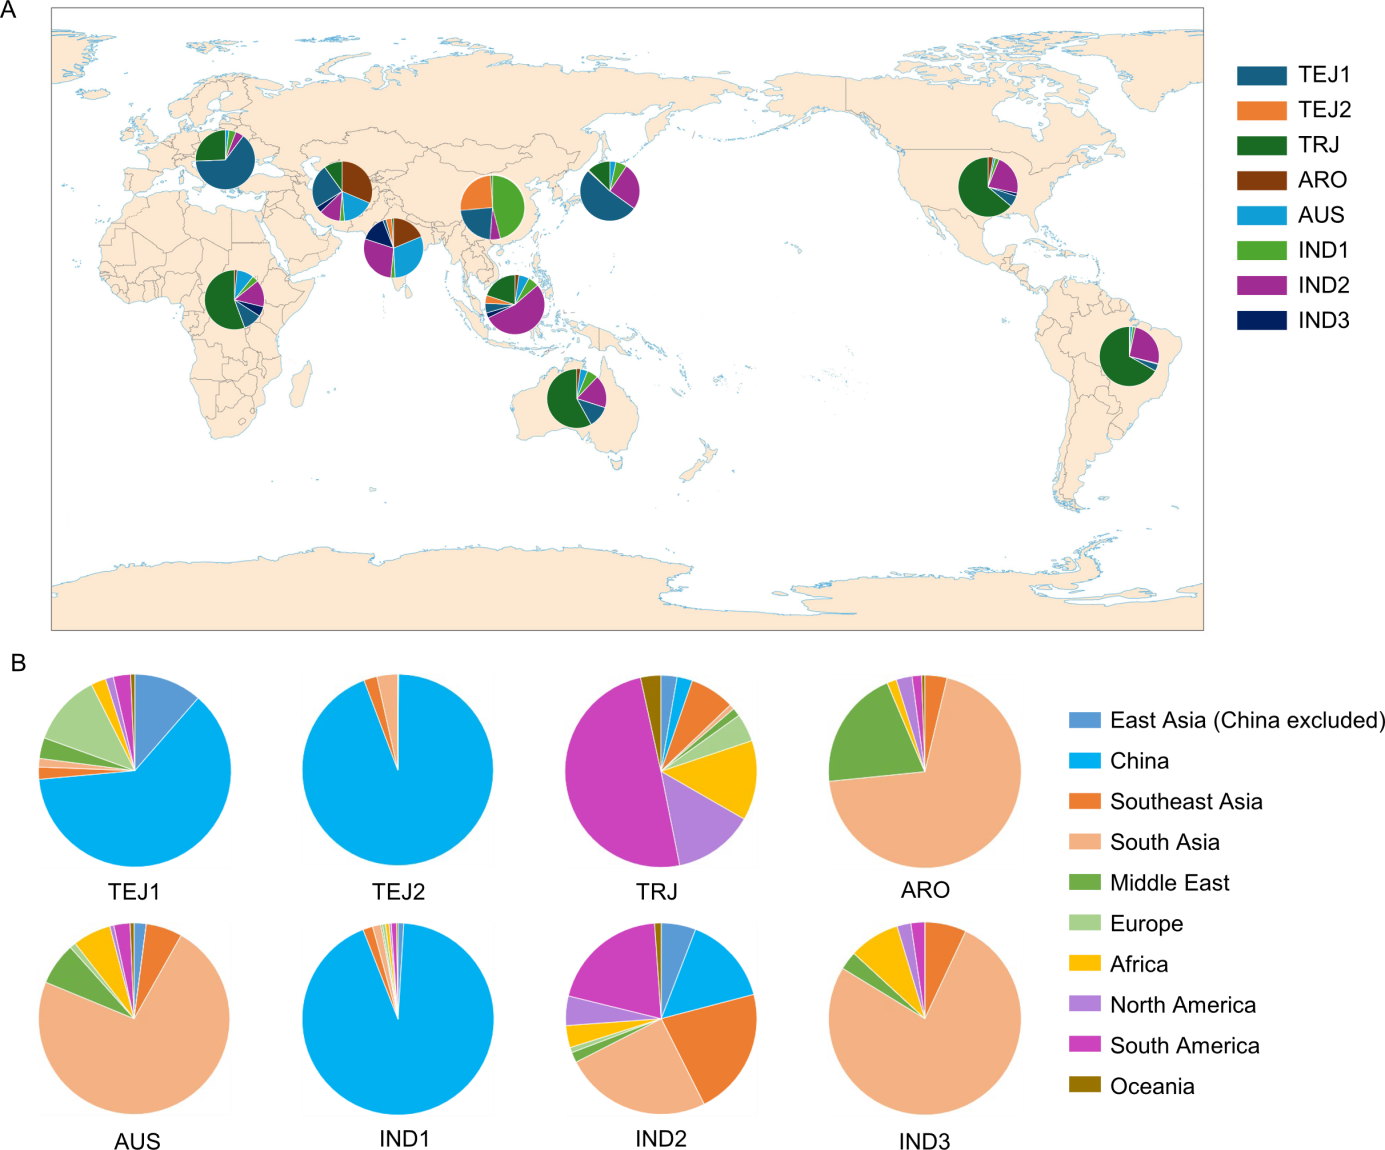
Fig. 5. Global distribution patterns of eight major groups. A, Geographical distribution of eight major groups. B, Distribution frequency of eight major groups across different regions. TEJ, Temperate japonica; TRJ, Tropical japonica; ARO, Aromatic; AUS, Aus; IND, Indica.
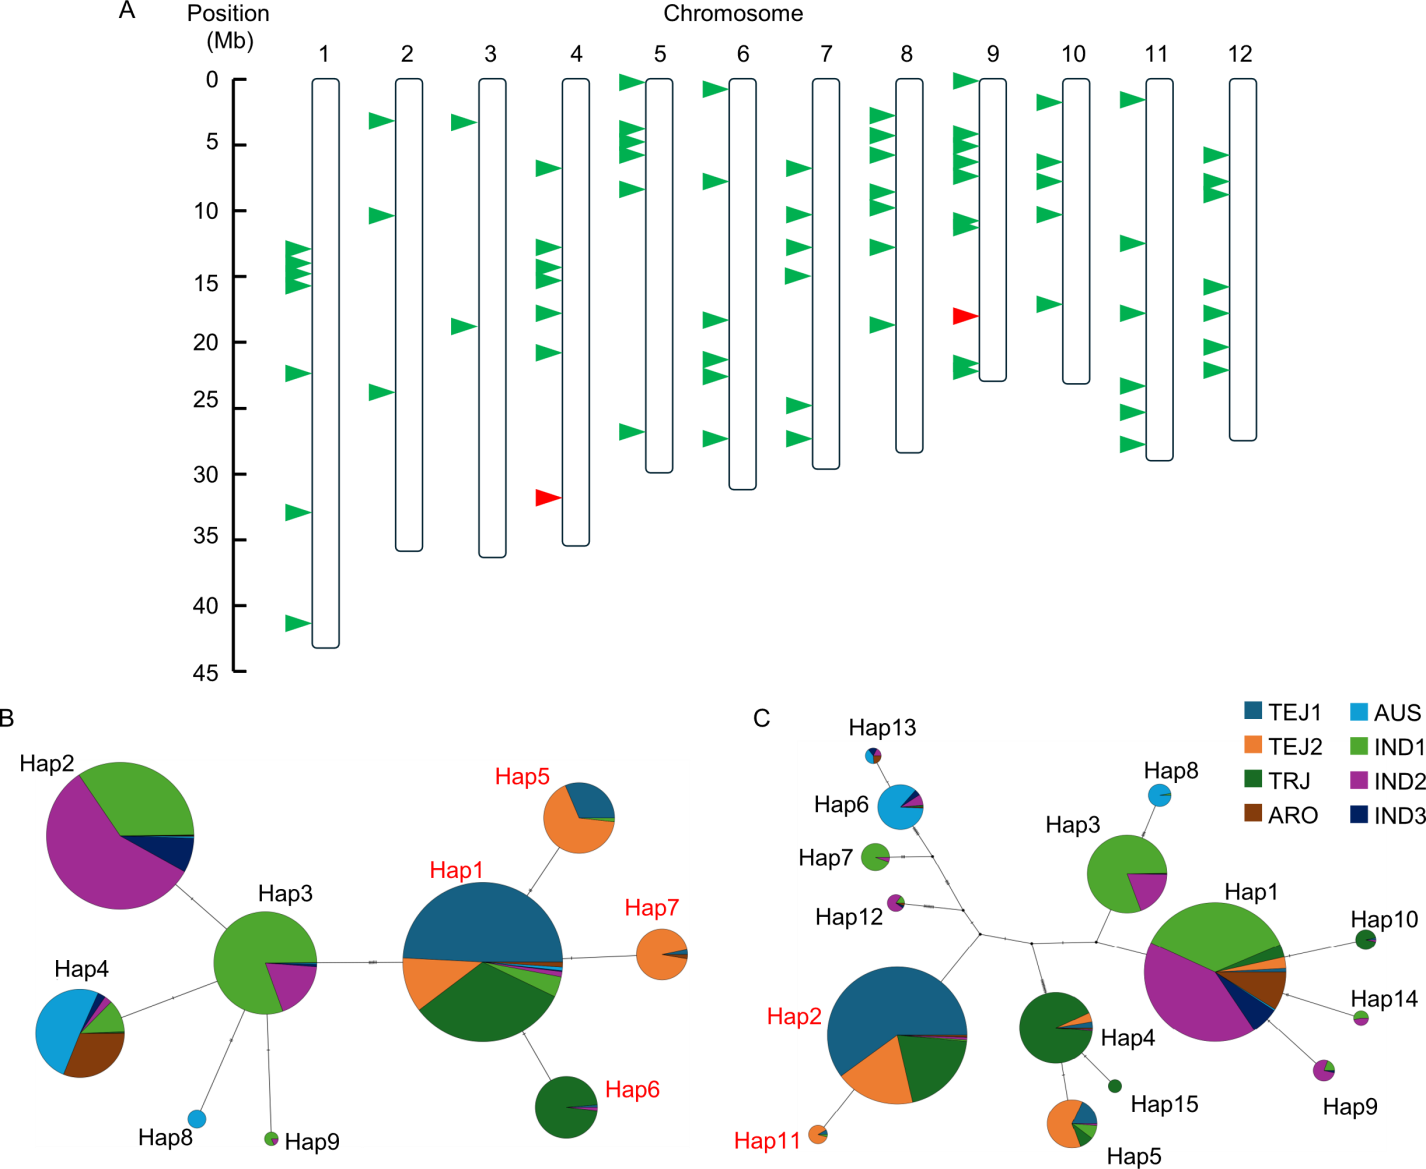
Fig. 6. Genetic differentiation among eight groups in Asian cultivated rice. A, Genetic differentiation regions were obtained by calculating the FST value between each pair of the eight groups using a 100-kb sliding window with a 50-kb step. The regions with the top 1% differentiation coefficient (FST) value were determined as the significant genetic differentiation regions. The green arrows indicate the genetic differentiation regions. The red arrows indicate the regions where bZIP73 (Chr. 9) and COLD1 (Chr. 4) are located. B and C, Haplotype (Hap) network analysis of bZIP73 (B) and COLD1 (C). Different colors represent different groups of accessions. TEJ, Temperate japonica; TRJ, Tropical japonica; ARO, Aromatic; AUS, Aus; IND, Indica.
| [1] | Alexander D H, Novembre J, Lange K. 2009. Fast model-based estimation of ancestry in unrelated individuals. Genome Res, 19(9): 1655-1664. |
| [2] | Chen S F, Zhou Y Q, Chen Y R, et al. 2018. Fastp: An ultra-fast all-in-one FASTQ preprocessor. Bioinformatics, 34(17): i884-i890. |
| [3] | Chen S H, Yang Y, Shi W W, et al. 2008. Badh2, encoding betaine aldehyde dehydrogenase, inhibits the biosynthesis of 2-acetyl-1-pyrroline, a major component in rice fragrance. Plant Cell, 20(7): 1850-1861. |
| [4] | Clement M, Posada D, Crandall K A. 2000. TCS: A computer program to estimate gene genealogies. Mol Ecol, 9(10): 1657-1659. |
| [5] | Danecek P, Auton A, Abecasis G, et al. 2011. The variant call format and VCFtools. Bioinformatics, 27(15): 2156-2158. |
| [6] | Fornasiero A, Feng T, Al-Bader N, et al. 2025. Oryza genome evolution through a tetraploid lens. Nat Genet, 57(5): 1287-1297. |
| [7] | Garris A J, Tai T H, Coburn J, et al. 2005. Genetic structure and diversity in Oryza sativa L. Genetics, 169(3): 1631-1638. |
| [8] | Huang X H, Kurata N, Wei X H, et al. 2012. A map of rice genome variation reveals the origin of cultivated rice. Nature, 490: 497-501. |
| [9] | Irfan M, Zhang T T, Wang Y, et al. 2013. Modification of CTAB protocol for maize genomic DNA extraction. Res J Biotechnol, 8(1): 41-45. |
| [10] | Ishikawa S, Ishimaru Y, Igura M, et al. 2012. Ion-beam irradiation, gene identification, and marker-assisted breeding in the development of low-cadmium rice. Proc Natl Acad Sci USA, 109: 19166-19171. |
| [11] | Jamora N, Ramaiah V. 2022. Global demand for rice genetic resources. CABI Agric Biosci, 3(1): 26. |
| [12] | Jing C Y, Zhang F M, Wang X H, et al. 2023. Multiple domestications of Asian rice. Nat Plants, 9(8): 1221-1235. |
| [13] | Leigh J W, Bryant D. 2015. POPART: Full-feature software for haplotype network construction. Methods Ecol Evol, 6(9): 1110-1116. |
| [14] | Li H, Durbin R. 2009. Fast and accurate short read alignment with Burrows-Wheeler transform. Bioinformatics, 25(14): 1754-1760. |
| [15] | Li H, Handsaker B, Wysoker A, et al. 2009. The sequence alignment/ ap format and SAMtools. Bioinformatics, 25(16): 2078-2079. |
| [16] | Li W, Zhang M C, Yang Y L, et al. 2024. Molecular evolution of rice blast resistance gene bsr-d1. Rice Sci, 31(6): 700-711. |
| [17] | Liu C T, Ou S J, Mao B G, et al. 2018. Early selection of bZIP73 facilitated adaptation of japonica rice to cold climates. Nat Commun, 9(1): 3302. |
| [18] | Liu Y C, Du H L, Li P C, et al. 2020. Pan-genome of wild and cultivated soybeans. Cell, 182(1): 162-176.e13. |
| [19] | Ma X D, Wang H, Yan S, et al. 2025. Large-scale genomic and phenomic analyses of modern cultivars empower future rice breeding design. Mol Plant, 18(4): 651-668. |
| [20] | Ma Y, Dai X Y, Xu Y Y, et al. 2015. COLD1 confers chilling tolerance in rice. Cell, 160(6): 1209-1221. |
| [21] | McKenna A, Hanna M, Banks E, et al. 2010. The Genome Analysis Toolkit: A MapReduce framework for analyzing next-generation DNA sequencing data. Genome Res, 20(9): 1297-1303. |
| [22] | Ni J, Colowit P M, Mackill D J. 2002. Evaluation of genetic diversity in rice subspecies using microsatellite markers. Crop Sci, 42(2): 601-607. |
| [23] | Purcell S, Neale B, Todd-Brown K, et al. 2007. PLINK: A tool set for whole-genome association and population-based linkage analyses. Am J Hum Genet, 81(3): 559-575. |
| [24] | Sang T, Ge S. 2007. Genetics and phylogenetics of rice domestication. Curr Opin Genet Dev, 17(6): 533-538. |
| [25] | Shang L G, Li X X, He H Y, et al. 2022. A super pan-genomic landscape of rice. Cell Res, 32(10): 878-896. |
| [26] | Villanueva R A M, Chen Z J. 2019. ggplot2: Elegant graphics for data analysis, 2nd edition. Meas Interdiscip Res Perspect, 17(3): 160-167. |
| [27] | Wang C H, Zheng X M, Xu Q, et al. 2014. Genetic diversity and classification of Oryza sativa with emphasis on Chinese rice germplasm. Heredity, 112(5): 489-496. |
| [28] | Wang K, Li M Y, Hakonarson H. 2010. ANNOVAR: Functional annotation of genetic variants from high-throughput sequencing data. Nucleic Acids Res, 38(16): e164. |
| [29] | Wang T Y, He W C, Li X X, et al. 2023. A rice variation map derived from 10 548 rice accessions reveals the importance of rare variants. Nucleic Acids Res, 51(20): 10924-10933. |
| [30] | Wang W S, Mauleon R, Hu Z Q, et al. 2018. Genomic variation in 3,010 diverse accessions of Asian cultivated rice. Nature, 557: 43-49. |
| [31] | Wei X, Chen M J, Zhang Q, et al. 2024. Genomic investigation of 18,421 lines reveals the genetic architecture of rice. Science, 385: eadm8762. |
| [32] | Xie L J, Wu D Y, Fang Y, et al. 2024. Population genomic analysis unravels the evolutionary roadmap of pericarp color in rice. Plant Commun, 5(3): 100778. |
| [33] | Xie L J, Huang Y J, Huang W, et al. 2025. Genetic diversity and evolution of rice centromeres. Nat Genet, 57(11): 2808-2818. |
| [34] | Xu S B, Li L, Luo X, et al. 2022. Ggtree: A serialized data object for visualization of a phylogenetic tree and annotation data. iMeta, 1(4): e56. |
| [35] | Yang J, Lee S H, Goddard M E, et al. 2011. GCTA: A tool for genome-wide complex trait analysis. Am J Hum Genet, 88(1): 76-82. |
| [36] | Ye J H, Zhang M C, Yuan X P, et al. 2022. Genomic insight into genetic changes and shaping of major inbred rice cultivars in China. New Phytol, 236(6): 2311-2326. |
| [37] | Yoshida H, Okada S, Wang F M, et al. 2023. Integrated genome-wide differentiation and association analyses identify causal genes underlying breeding-selected grain quality traits in japonica rice. Mol Plant, 16(9): 1460-1477. |
| [38] | Zhang C, Dong S S, Xu J Y, et al. 2019. PopLDdecay: A fast and effective tool for linkage disequilibrium decay analysis based on variant call format files. Bioinformatics, 35(10): 1786-1788. |
| [39] | Zhang C Q, Zhu J H, Chen S J, et al. 2019. Wxlv, the ancestral allele of rice Waxy gene. Mol Plant, 12(8): 1157-1166. |
| [40] | Zhang R L, Jia G Q, Diao X M. 2023. geneHapR: An R package for gene haplotypic statistics and visualization. BMC Bioinformatics, 24(1): 199. |
| [41] | Zheng X H, Ye J H, Cheng C P, et al. 2022. Xian-Geng identification by SNP markers in Oryza sativa L. Acta Agron Sin, 48(2): 342-352. (in Chinese with English abstract) |
| [1] | Mukherjee Mitadru, Padhy Barada, Srinivasan Bharathkumar, Mahadani Pradosh, Yasin Baksh Sk, Donde Ravindra, Nath Singh Onkar, Behera Lambodar, Swain Padmini, Kumar Dash Sushanta. Revealing Genetic Relationship and Prospecting of Novel Donors Among Upland Rice Genotypes Using qDTY-Linked SSR Markers [J]. Rice Science, 2018, 25(6): 308-319. |
| [2] | Haritha G., P. M. Swamy B., L. Naik M., Jyothi B., Divya B., Malathi S., Sarla N.. Yield Traits and Associated Marker Segregation in Elite Introgression Lines Derived from O. sativa × O. nivara [J]. Rice Science, 2018, 25(1): 19-31. |
| [3] | Rekha Talukdar Preeti, Rathi Sunayana, Pathak Khanin, Kumar Chetia Sanjay, Nath Sarma Ramendra. Population Structure and Marker-Trait Association in Indigenous Aromatic Rice [J]. Rice Science, 2017, 24(3): 145-154. |
| [4] | Haritha G., Sudhakar T., Chandra D., Ram T., Divya B., Sarla N.. Informative ISSR Markers Help Identify Genetically Distinct Accessions of Oryza rufipogon in Yield Improvement [J]. Rice Science, 2016, 23(5): 225-241. |
| [5] | Mao-bai Li, Hui Wang, Li-ming Cao. Evaluation of Population Structure, Genetic Diversity and Origin of Northeast Asia Weedy Rice Based on Simple Sequence Repeat Markers [J]. Rice Science, 2015, 22(4): 180-188. |
| [6] | D. Kumbhar Shailesh, L. Kulwal Pawan, V. Patil Jagannath, D. Sarawate Chandrakant, P. Gaikwad Anil, S. Jadhav Ashok. Genetic Diversity and Population Structure in Landraces and Improved Rice Varieties from India [J]. Rice Science, 2015, 22(3): 99-107. |
| [7] | Ming Huang, Ya-hui Wu, Xing-xing Tao, Yong-zhu Liu, Gui-li Yang, Zhi-qiang Chen. Genetic Diversity of Main Inbred Indica Rice Varieties Applied in Guangdong Province as Revealed by Molecular Marker [J]. Rice Science, 2015, 22(1): 1-8. |
| Viewed | ||||||
|
Full text |
|
|||||
|
Abstract |
|
|||||