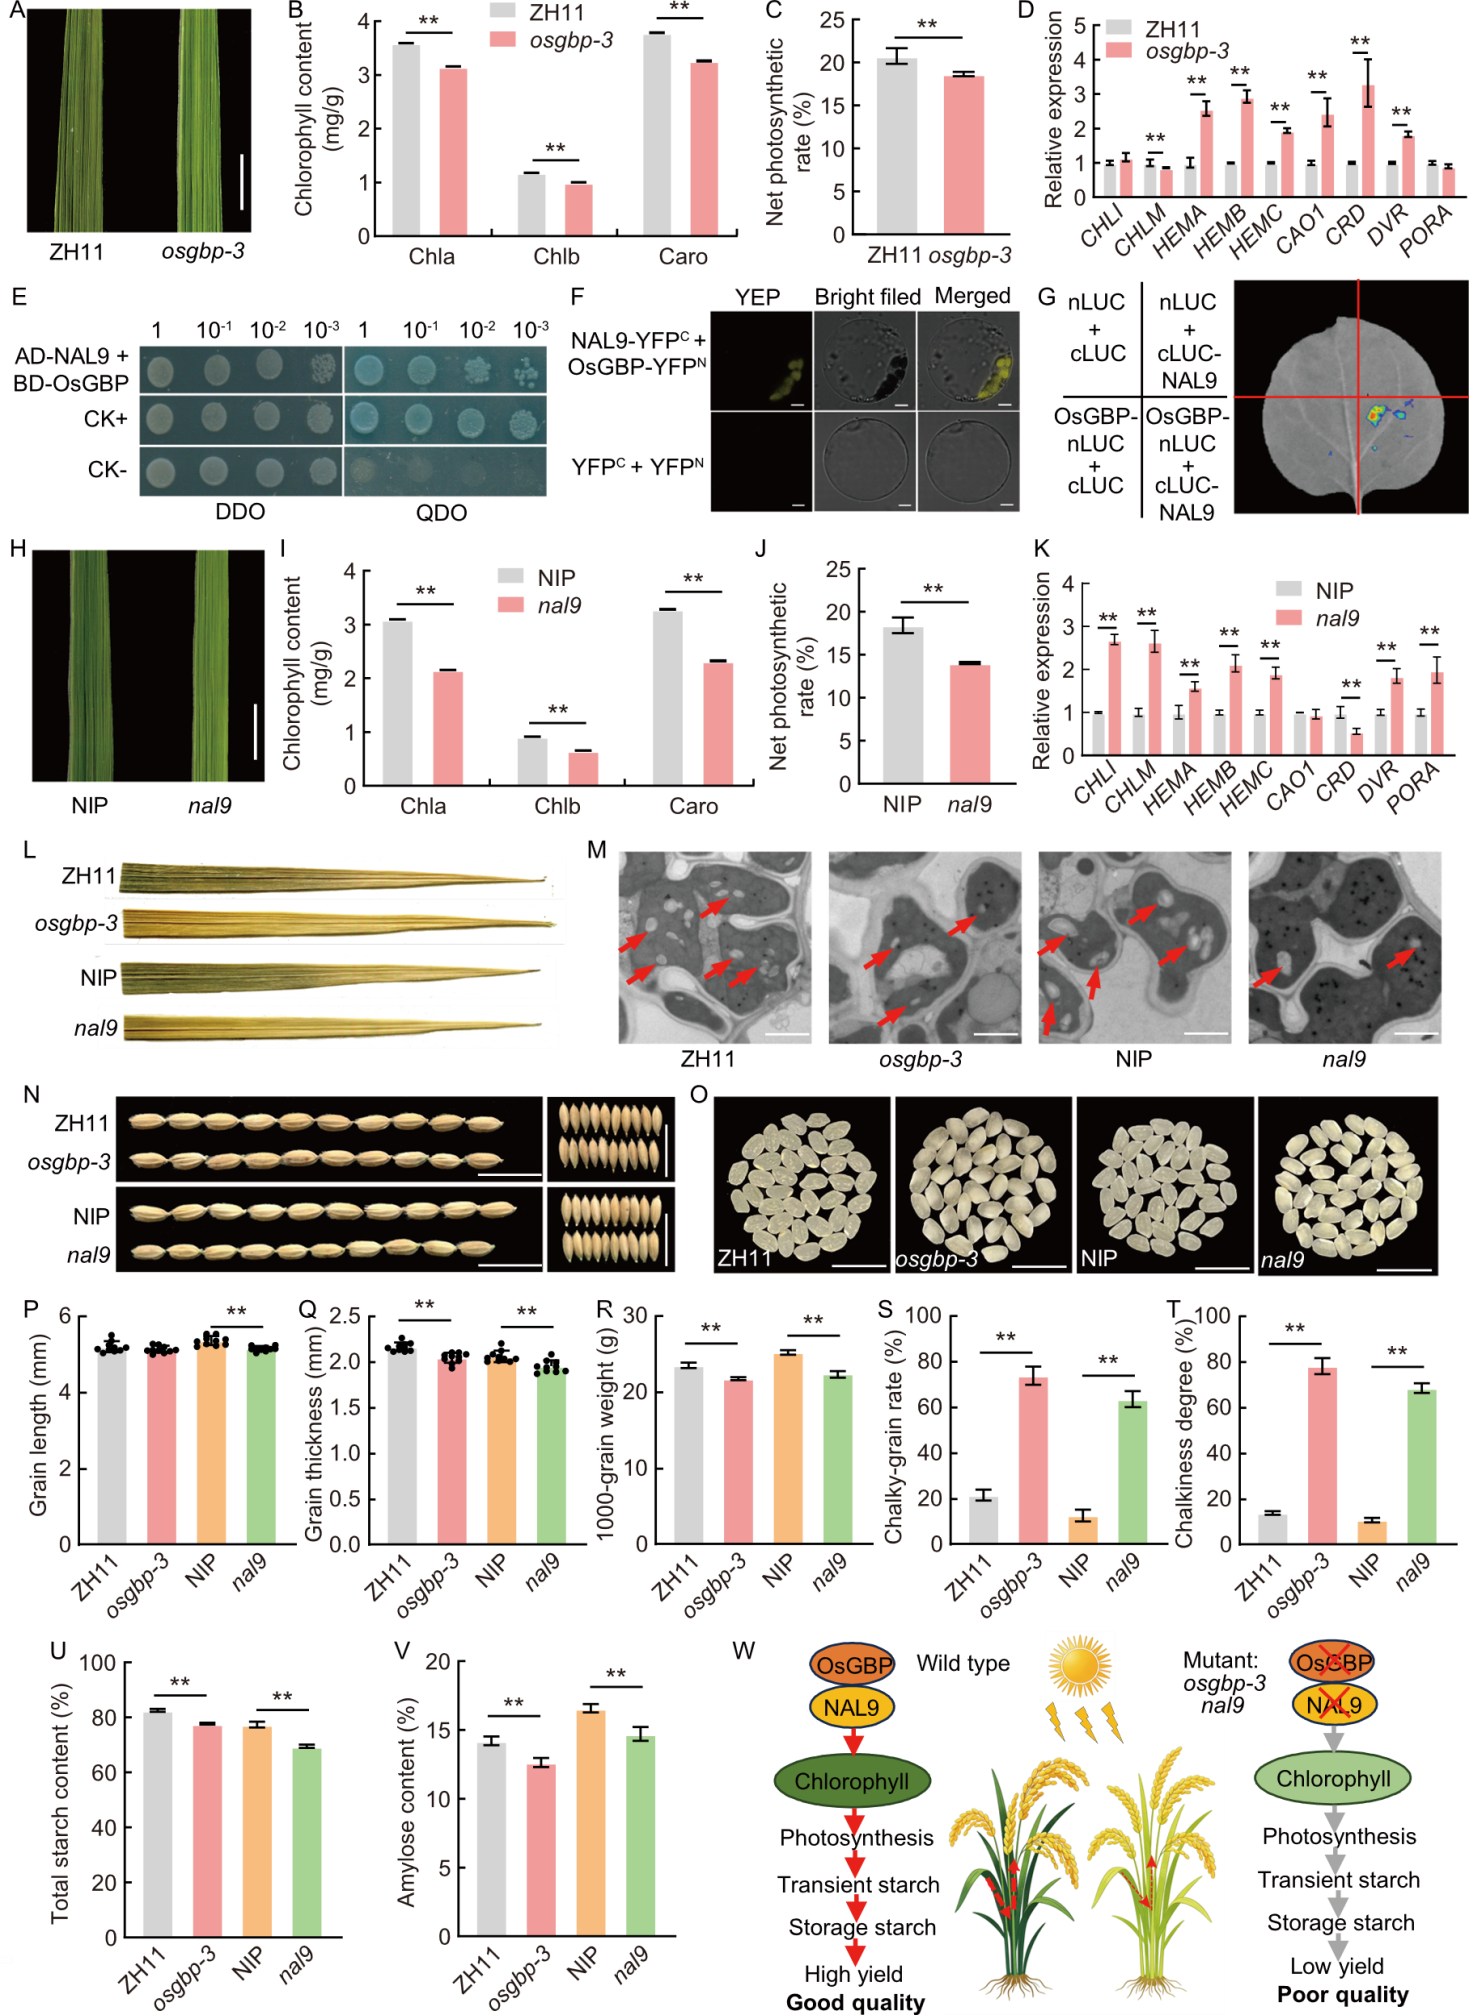
Fig. 1. OsGBP interacts with NAL9 to regulate leaf chlorophyll content, photosynthesis, and transient starch synthesis, thereby affecting grain yield and quality. A, Leaf appearance of wild type (Zhonghua 11, ZH11) and OsGBP gene editing mutant (osgbp-3). Scale bar, 1 cm. B, Chlorophyll contents of ZH11 and osgbp-3. Chla, Chlorophyll a; Chlb, Chlorophyll b; Caro, Carotene. C, Net photosynthetic rate of ZH11 and osgbp-3. D, Relative expression levels of chlorophyll biosynthesis-related genes in ZH11 and osgbp-3. Flag leaves from the two materials at approximately 10 d after heading were selected for RNA extraction, with the Actin gene used as the internal reference. E, Interaction between OsGBP and NAL9 detected by yeast two-hybrid (Y2H) assay. The interactions between pGADT7-T and pGBKT7-53 (CK+) and between pGADT7 and pGBKT7 (CK-) were used as positive and negative controls, respectively. Yeast transformants were spotted onto control medium (SD/-Leu/-Trp, double dropout medium, DDO) and selective medium (SD/-Leu/-Trp/-His/-Ade, quadruple dropout medium, QDO). F, Interaction between OsGBP and NAL9 detected by bimolecular fluorescence complementation (BiFC) assay in rice protoplasts. YFP, Yellow fluorescent protein. Scale bars, 5 μm. G, Split-luciferase (LCI) assays between OsGBP and NAL9 and controls. cLUC, C-terminal LUC; nLUC, N-terminal LUC. H, Leaf appearance of wild type (Nipponbare, NIP) and mutant (nal9). Scale bar, 1 cm. I, Chlorophyll contents of NIP and nal9. J, Net photosynthesis rate in NIP and nal9 plants. K, Relative expression levels of chlorophyll biosynthesis-related genes in NIP and nal9. L, Iodine staining of flag leaves at 15 d after heading of ZH11, osgbp-3, NIP, and nal9 at the end of the day (6:00 pm). M, Ultrastructure of chloroplasts in flag leaves of ZH11, osgbp-3, NIP, and nal9 at the end of the day (6:00 pm). Starch granules (SGs) are indicated by red arrows. Scale bars, 10 μm. N, Grain morphology of ZH11, osgbp-3, NIP, and nal9. Scale bars, 1 cm. O, Brown rice appearance of ZH11, osgbp-3, NIP, and nal9. Scale bars, 1 cm. P‒V, Grain length (P), grain thickness (Q), 1000-grain weight (R), chalky-grain rate (S), chalkiness degree (T), total starch content (U), and amylose content (V) of ZH11, osgbp-3, NIP, and nal9. W, A mechanistic model of OsGBP and NAL9 synergistically regulating rice leaf photosynthetic efficiency and transient starch synthesis, thereby influencing grain yield and quality. Red cross indicates protein absence; red arrow represents positive regulation; gray arrow represents weakened positive regulation; thick dashed red arrow indicates transport of photosynthetic products; thin dashed red arrow indicates reduced transport of photosynthetic products; dark green represents normal chlorophyll content; light green represents reduced chlorophyll content. Values in B, C, D, I, J, K, R, S, T, U, and V represent mean ± SD (n = 3), and values in P and Q represent mean ± SD (n = 10). Statistically significant differences between mutants and wild type were determined using Student’s t-test (**, P < 0.01).
Fig. 1. OsGBP interacts with NAL9 to regulate leaf chlorophyll content, photosynthesis, and transient starch synthesis, thereby affecting grain yield and quality. A, Leaf appearance of wild type (Zhonghua 11, ZH11) and OsGBP gene editing mutant (osgbp-3). Scale bar, 1 cm. B, Chlorophyll contents of ZH11 and osgbp-3. Chla, Chlorophyll a; Chlb, Chlorophyll b; Caro, Carotene. C, Net photosynthetic rate of ZH11 and osgbp-3. D, Relative expression levels of chlorophyll biosynthesis-related genes in ZH11 and osgbp-3. Flag leaves from the two materials at approximately 10 d after heading were selected for RNA extraction, with the Actin gene used as the internal reference. E, Interaction between OsGBP and NAL9 detected by yeast two-hybrid (Y2H) assay. The interactions between pGADT7-T and pGBKT7-53 (CK+) and between pGADT7 and pGBKT7 (CK-) were used as positive and negative controls, respectively. Yeast transformants were spotted onto control medium (SD/-Leu/-Trp, double dropout medium, DDO) and selective medium (SD/-Leu/-Trp/-His/-Ade, quadruple dropout medium, QDO). F, Interaction between OsGBP and NAL9 detected by bimolecular fluorescence complementation (BiFC) assay in rice protoplasts. YFP, Yellow fluorescent protein. Scale bars, 5 μm. G, Split-luciferase (LCI) assays between OsGBP and NAL9 and controls. cLUC, C-terminal LUC; nLUC, N-terminal LUC. H, Leaf appearance of wild type (Nipponbare, NIP) and mutant (nal9). Scale bar, 1 cm. I, Chlorophyll contents of NIP and nal9. J, Net photosynthesis rate in NIP and nal9 plants. K, Relative expression levels of chlorophyll biosynthesis-related genes in NIP and nal9. L, Iodine staining of flag leaves at 15 d after heading of ZH11, osgbp-3, NIP, and nal9 at the end of the day (6:00 pm). M, Ultrastructure of chloroplasts in flag leaves of ZH11, osgbp-3, NIP, and nal9 at the end of the day (6:00 pm). Starch granules (SGs) are indicated by red arrows. Scale bars, 10 μm. N, Grain morphology of ZH11, osgbp-3, NIP, and nal9. Scale bars, 1 cm. O, Brown rice appearance of ZH11, osgbp-3, NIP, and nal9. Scale bars, 1 cm. P‒V, Grain length (P), grain thickness (Q), 1000-grain weight (R), chalky-grain rate (S), chalkiness degree (T), total starch content (U), and amylose content (V) of ZH11, osgbp-3, NIP, and nal9. W, A mechanistic model of OsGBP and NAL9 synergistically regulating rice leaf photosynthetic efficiency and transient starch synthesis, thereby influencing grain yield and quality. Red cross indicates protein absence; red arrow represents positive regulation; gray arrow represents weakened positive regulation; thick dashed red arrow indicates transport of photosynthetic products; thin dashed red arrow indicates reduced transport of photosynthetic products; dark green represents normal chlorophyll content; light green represents reduced chlorophyll content. Values in B, C, D, I, J, K, R, S, T, U, and V represent mean ± SD (n = 3), and values in P and Q represent mean ± SD (n = 10). Statistically significant differences between mutants and wild type were determined using Student’s t-test (**, P < 0.01).

 )
