Rice Science ›› 2019, Vol. 26 ›› Issue (4): 207-219.DOI: 10.1016/j.rsci.2019.05.001
• Orginal Article • Previous Articles Next Articles
Elisa B. Gerona Maria1,2( ), P. Deocampo Marjorie3, A. Egdane James3, M. Ismail Abdelbagi3(), L. Dionisio-Sese Maribel2
Received:2018-05-11
Accepted:2018-10-29
Online:2019-07-28
Published:2019-04-04
Elisa B. Gerona Maria, P. Deocampo Marjorie, A. Egdane James, M. Ismail Abdelbagi, L. Dionisio-Sese Maribel. Physiological Responses of Contrasting Rice Genotypes to Salt Stress at Reproductive Stage[J]. Rice Science, 2019, 26(4): 207-219.
Add to citation manager EndNote|Ris|BibTeX
| Genotype | Shoot dry weight (g) | Pollen viability (%) | Grain yield per plant (g) | Panicle length (cm) | No. of panicles per plant | Percentage of filled grains (%) | Percentage of unfilled grains (%) | |||||||||||||
| Control | EC10 | Control | EC10 | Control | EC10 | Control | EC10 | Control | EC10 | Control | EC10 | Control | EC10 | |||||||
| Rc222 | 26.15 | 7.99 | 93.85 | 19.07 | 7.03 | 2.64 | 33.70 | 29.50 | 5.8 | 4.1 | 92.78 | 14.83 | 7.22 | 85.17 | ||||||
| IR686 | 26.07 | 5.55 | 87.79 | 23.50 | 6.17 | 1.66 | 22.80 | 16.90 | 6.7 | 3.1 | 90.77 | 13.82 | 9.23 | 86.18 | ||||||
| Sadri | 27.12 | 5.92 | 91.31 | 44.44 | 6.03 | 1.02 | 28.40 | 17.00 | 5.3 | 2.3 | 89.42 | 11.56 | 10.58 | 88.44 | ||||||
| CSR28 | 28.74 | 21.36 | 91.74 | 82.64 | 7.14 | 2.36 | 27.90 | 17.30 | 4.1 | 3.9 | 90.23 | 70.90 | 9.77 | 29.10 | ||||||
| IR670 | 32.29 | 27.21 | 92.96 | 84.61 | 8.07 | 6.88 | 23.80 | 18.50 | 6.2 | 5.1 | 91.12 | 84.86 | 8.88 | 15.14 | ||||||
| Pokkali | 30.08 | 25.93 | 96.06 | 94.20 | 7.55 | 5.48 | 29.50 | 20.20 | 7.8 | 6.5 | 90.63 | 68.77 | 9.37 | 31.23 | ||||||
| Mean | 28.41 | 15.66 | 92.28 | 58.08 | 7.00 | 3.34 | 27.68 | 19.90 | 6.0 | 4.2 | 90.82 | 44.13 | 9.18 | 55.87 | ||||||
| Salinity (S) | 2.49*** | 5.57*** | 1.66*** | 1.30*** | 0.16*** | 1.97*** | 2.48*** | |||||||||||||
| Genotype (G) | 4.70*** | 9.89*** | 1.27*** | 2.49** | 0.12** | 1.72** | 0.83* | |||||||||||||
| S × G | 3.84*** | 1.69*** | 0.79*** | 2.46*** | 0.35*** | 2.94*** | 1.74** | |||||||||||||
| EC10, Salt stress condition with electrical conductivity of 10 dS/m. Data are means of three replications; *, ** and ***, Significance at the 0.05, 0.01 and 0.001 levels by the Fisher’s least significant difference, respectively. | ||||||||||||||||||||
Table 1 Shoot dry weight, pollen viability, grain yield and yield components of six rice genotypes under control and salt stress conditions.
| Genotype | Shoot dry weight (g) | Pollen viability (%) | Grain yield per plant (g) | Panicle length (cm) | No. of panicles per plant | Percentage of filled grains (%) | Percentage of unfilled grains (%) | |||||||||||||
| Control | EC10 | Control | EC10 | Control | EC10 | Control | EC10 | Control | EC10 | Control | EC10 | Control | EC10 | |||||||
| Rc222 | 26.15 | 7.99 | 93.85 | 19.07 | 7.03 | 2.64 | 33.70 | 29.50 | 5.8 | 4.1 | 92.78 | 14.83 | 7.22 | 85.17 | ||||||
| IR686 | 26.07 | 5.55 | 87.79 | 23.50 | 6.17 | 1.66 | 22.80 | 16.90 | 6.7 | 3.1 | 90.77 | 13.82 | 9.23 | 86.18 | ||||||
| Sadri | 27.12 | 5.92 | 91.31 | 44.44 | 6.03 | 1.02 | 28.40 | 17.00 | 5.3 | 2.3 | 89.42 | 11.56 | 10.58 | 88.44 | ||||||
| CSR28 | 28.74 | 21.36 | 91.74 | 82.64 | 7.14 | 2.36 | 27.90 | 17.30 | 4.1 | 3.9 | 90.23 | 70.90 | 9.77 | 29.10 | ||||||
| IR670 | 32.29 | 27.21 | 92.96 | 84.61 | 8.07 | 6.88 | 23.80 | 18.50 | 6.2 | 5.1 | 91.12 | 84.86 | 8.88 | 15.14 | ||||||
| Pokkali | 30.08 | 25.93 | 96.06 | 94.20 | 7.55 | 5.48 | 29.50 | 20.20 | 7.8 | 6.5 | 90.63 | 68.77 | 9.37 | 31.23 | ||||||
| Mean | 28.41 | 15.66 | 92.28 | 58.08 | 7.00 | 3.34 | 27.68 | 19.90 | 6.0 | 4.2 | 90.82 | 44.13 | 9.18 | 55.87 | ||||||
| Salinity (S) | 2.49*** | 5.57*** | 1.66*** | 1.30*** | 0.16*** | 1.97*** | 2.48*** | |||||||||||||
| Genotype (G) | 4.70*** | 9.89*** | 1.27*** | 2.49** | 0.12** | 1.72** | 0.83* | |||||||||||||
| S × G | 3.84*** | 1.69*** | 0.79*** | 2.46*** | 0.35*** | 2.94*** | 1.74** | |||||||||||||
| EC10, Salt stress condition with electrical conductivity of 10 dS/m. Data are means of three replications; *, ** and ***, Significance at the 0.05, 0.01 and 0.001 levels by the Fisher’s least significant difference, respectively. | ||||||||||||||||||||
| Genotype | First leaf from the top | Second leaf from the top | Third leaf from the top | First leaf sheath from the top | Second leaf sheath from the top | Third leaf sheath from the top | Panicle main stalk | Branches with spikelets | |||||||||||||||
| Control | EC10 | Control | EC10 | Control | EC10 | Control | EC10 | Control | EC10 | Control | EC10 | Control | EC10 | Control | EC10 | ||||||||
| Rc222 | 52.1 | 490.9 | 79.6 | 540.4 | 86.8 | 899.1 | 78.5 | 544.2 | 76.1 | 848.3 | 107.1 | 990.8 | 31.9 | 450.8 | 34.6 | 415.9 | |||||||
| IR686 | 52.6 | 579.0 | 77.0 | 884.6 | 92.4 | 927.9 | 69.3 | 649.0 | 72.1 | 921.6 | 100.9 | 1507.5 | 34.5 | 461.4 | 39.2 | 428.9 | |||||||
| Sadri | 35.8 | 619.2 | 69.9 | 711.2 | 45.9 | 883.7 | 51.5 | 689.3 | 55.9 | 865.5 | 64.8 | 1031.0 | 48.4 | 459.9 | 45.2 | 457.2 | |||||||
| CSR28 | 51.3 | 459.1 | 78.8 | 487.4 | 67.8 | 547.7 | 80.2 | 481.0 | 80.6 | 583.3 | 92.7 | 669.8 | 26.1 | 382.0 | 18.5 | 319.6 | |||||||
| IR670 | 22.6 | 335.4 | 41.2 | 400.8 | 59.6 | 554.9 | 41.6 | 526.2 | 47.0 | 557.9 | 57.3 | 563.8 | 24.0 | 217.1 | 17.9 | 207.7 | |||||||
| Pokkali | 35.2 | 400.8 | 50.3 | 474.4 | 51.1 | 490.9 | 56.2 | 460.7 | 53.7 | 477.9 | 71.0 | 480.2 | 15.6 | 141.0 | 14.1 | 103.8 | |||||||
| Mean | 41.6 | 480.7 | 66.1 | 583.1 | 67.3 | 717.4 | 62.9 | 558.4 | 64.2 | 709.1 | 82.3 | 873.9 | 31.3 | 352.0 | 27.0 | 322.2 | |||||||
| Salinity (S) | 70.84*** | 137.52*** | 90.17*** | 75.69*** | 89.67*** | 207.71*** | 64.46*** | 86.37*** | |||||||||||||||
| Genotype (G) | 122.28* | 192.79** | 206.21** | 138.43** | 244.91* | 264.09* | 101.54** | 104.62** | |||||||||||||||
| S × G | 117.37*** | 127.19*** | 90.53*** | 156.41*** | 111.45*** | 297.64*** | 12.01*** | 46.87*** | |||||||||||||||
| EC10, Salt stress condition with electrical conductivity of 10 dS/m.==Data are means of three replications; *, ** and ***, Significance at the 0.05, 0.01 and 0.001 levels by the Fisher’s least significant difference, respectively. | |||||||||||||||||||||||
Table 2 Na+ concentrations of six rice genotypes at the flowering stage. mmol/kg
| Genotype | First leaf from the top | Second leaf from the top | Third leaf from the top | First leaf sheath from the top | Second leaf sheath from the top | Third leaf sheath from the top | Panicle main stalk | Branches with spikelets | |||||||||||||||
| Control | EC10 | Control | EC10 | Control | EC10 | Control | EC10 | Control | EC10 | Control | EC10 | Control | EC10 | Control | EC10 | ||||||||
| Rc222 | 52.1 | 490.9 | 79.6 | 540.4 | 86.8 | 899.1 | 78.5 | 544.2 | 76.1 | 848.3 | 107.1 | 990.8 | 31.9 | 450.8 | 34.6 | 415.9 | |||||||
| IR686 | 52.6 | 579.0 | 77.0 | 884.6 | 92.4 | 927.9 | 69.3 | 649.0 | 72.1 | 921.6 | 100.9 | 1507.5 | 34.5 | 461.4 | 39.2 | 428.9 | |||||||
| Sadri | 35.8 | 619.2 | 69.9 | 711.2 | 45.9 | 883.7 | 51.5 | 689.3 | 55.9 | 865.5 | 64.8 | 1031.0 | 48.4 | 459.9 | 45.2 | 457.2 | |||||||
| CSR28 | 51.3 | 459.1 | 78.8 | 487.4 | 67.8 | 547.7 | 80.2 | 481.0 | 80.6 | 583.3 | 92.7 | 669.8 | 26.1 | 382.0 | 18.5 | 319.6 | |||||||
| IR670 | 22.6 | 335.4 | 41.2 | 400.8 | 59.6 | 554.9 | 41.6 | 526.2 | 47.0 | 557.9 | 57.3 | 563.8 | 24.0 | 217.1 | 17.9 | 207.7 | |||||||
| Pokkali | 35.2 | 400.8 | 50.3 | 474.4 | 51.1 | 490.9 | 56.2 | 460.7 | 53.7 | 477.9 | 71.0 | 480.2 | 15.6 | 141.0 | 14.1 | 103.8 | |||||||
| Mean | 41.6 | 480.7 | 66.1 | 583.1 | 67.3 | 717.4 | 62.9 | 558.4 | 64.2 | 709.1 | 82.3 | 873.9 | 31.3 | 352.0 | 27.0 | 322.2 | |||||||
| Salinity (S) | 70.84*** | 137.52*** | 90.17*** | 75.69*** | 89.67*** | 207.71*** | 64.46*** | 86.37*** | |||||||||||||||
| Genotype (G) | 122.28* | 192.79** | 206.21** | 138.43** | 244.91* | 264.09* | 101.54** | 104.62** | |||||||||||||||
| S × G | 117.37*** | 127.19*** | 90.53*** | 156.41*** | 111.45*** | 297.64*** | 12.01*** | 46.87*** | |||||||||||||||
| EC10, Salt stress condition with electrical conductivity of 10 dS/m.==Data are means of three replications; *, ** and ***, Significance at the 0.05, 0.01 and 0.001 levels by the Fisher’s least significant difference, respectively. | |||||||||||||||||||||||
| Genotype | First leaf from the top | Second leaf from the top | Third leaf from the top | First leaf sheath from the top | Second leaf sheath from the top | Third leaf sheath from the top | Panicle main stalk | Branch with spikelets | |||||||||||||||
| Control | EC10 | Control | EC10 | Control | EC10 | Control | EC10 | Control | EC10 | Control | EC10 | Control | EC10 | Control | EC10 | ||||||||
| Rc222 | 0.11 | 1.69 | 0.11 | 1.84 | 0.11 | 2.18 | 0.12 | 1.82 | 0.11 | 2.00 | 0.12 | 2.28 | 0.10 | 1.64 | 0.11 | 1.51 | |||||||
| IR686 | 0.10 | 2.30 | 0.11 | 2.57 | 0.11 | 2.88 | 0.10 | 2.49 | 0.11 | 2.73 | 0.11 | 3.21 | 0.10 | 1.72 | 0.14 | 1.65 | |||||||
| Sadri | 0.10 | 2.38 | 0.11 | 2.48 | 0.10 | 3.92 | 0.10 | 2.81 | 0.11 | 3.49 | 0.10 | 4.09 | 0.15 | 2.02 | 0.19 | 2.02 | |||||||
| CSR28 | 0.10 | 1.02 | 0.11 | 1.03 | 0.10 | 1.14 | 0.10 | 1.14 | 0.11 | 1.17 | 0.10 | 1.71 | 0.09 | 1.01 | 0.11 | 0.88 | |||||||
| IR670 | 0.05 | 0.69 | 0.05 | 0.76 | 0.05 | 0.82 | 0.05 | 0.72 | 0.05 | 0.81 | 0.06 | 0.86 | 0.07 | 0.68 | 0.07 | 0.65 | |||||||
| Pokkali | 0.06 | 0.66 | 0.06 | 0.67 | 0.06 | 0.72 | 0.07 | 0.66 | 0.06 | 0.69 | 0.07 | 0.79 | 0.06 | 0.64 | 0.08 | 0.43 | |||||||
| Mean | 0.09 | 1.46 | 0.09 | 1.56 | 0.09 | 1.94 | 0.09 | 1.61 | 0.09 | 1.81 | 0.09 | 2.16 | 0.09 | 1.28 | 0.12 | 1.19 | |||||||
| Salinity (S) | 0.28*** | 0.58*** | 0.39*** | 0.63*** | 0.57*** | 0.61*** | 0.56*** | 0.28*** | |||||||||||||||
| Genotype (G) | 0.34* | 0.33* | 0.06** | 0.39** | 0.33** | 0.40** | 0.19* | 0.32* | |||||||||||||||
| S × G | 0.38*** | 0.30*** | 0.22*** | 0.76*** | 0.20*** | 0.25*** | 0.10*** | 0.22*** | |||||||||||||||
| EC10, Salt stress condition with electrical conductivity of 10 dS/m. Data are means of three replications; *, ** and ***, Significance at the 0.05, 0.01 and 0.001 levels by the Fisher’s least significant difference, respectively. | |||||||||||||||||||||||
Table 3 Na+/K+ ratio of six rice genotypes at the flowering stage. mmol/kg
| Genotype | First leaf from the top | Second leaf from the top | Third leaf from the top | First leaf sheath from the top | Second leaf sheath from the top | Third leaf sheath from the top | Panicle main stalk | Branch with spikelets | |||||||||||||||
| Control | EC10 | Control | EC10 | Control | EC10 | Control | EC10 | Control | EC10 | Control | EC10 | Control | EC10 | Control | EC10 | ||||||||
| Rc222 | 0.11 | 1.69 | 0.11 | 1.84 | 0.11 | 2.18 | 0.12 | 1.82 | 0.11 | 2.00 | 0.12 | 2.28 | 0.10 | 1.64 | 0.11 | 1.51 | |||||||
| IR686 | 0.10 | 2.30 | 0.11 | 2.57 | 0.11 | 2.88 | 0.10 | 2.49 | 0.11 | 2.73 | 0.11 | 3.21 | 0.10 | 1.72 | 0.14 | 1.65 | |||||||
| Sadri | 0.10 | 2.38 | 0.11 | 2.48 | 0.10 | 3.92 | 0.10 | 2.81 | 0.11 | 3.49 | 0.10 | 4.09 | 0.15 | 2.02 | 0.19 | 2.02 | |||||||
| CSR28 | 0.10 | 1.02 | 0.11 | 1.03 | 0.10 | 1.14 | 0.10 | 1.14 | 0.11 | 1.17 | 0.10 | 1.71 | 0.09 | 1.01 | 0.11 | 0.88 | |||||||
| IR670 | 0.05 | 0.69 | 0.05 | 0.76 | 0.05 | 0.82 | 0.05 | 0.72 | 0.05 | 0.81 | 0.06 | 0.86 | 0.07 | 0.68 | 0.07 | 0.65 | |||||||
| Pokkali | 0.06 | 0.66 | 0.06 | 0.67 | 0.06 | 0.72 | 0.07 | 0.66 | 0.06 | 0.69 | 0.07 | 0.79 | 0.06 | 0.64 | 0.08 | 0.43 | |||||||
| Mean | 0.09 | 1.46 | 0.09 | 1.56 | 0.09 | 1.94 | 0.09 | 1.61 | 0.09 | 1.81 | 0.09 | 2.16 | 0.09 | 1.28 | 0.12 | 1.19 | |||||||
| Salinity (S) | 0.28*** | 0.58*** | 0.39*** | 0.63*** | 0.57*** | 0.61*** | 0.56*** | 0.28*** | |||||||||||||||
| Genotype (G) | 0.34* | 0.33* | 0.06** | 0.39** | 0.33** | 0.40** | 0.19* | 0.32* | |||||||||||||||
| S × G | 0.38*** | 0.30*** | 0.22*** | 0.76*** | 0.20*** | 0.25*** | 0.10*** | 0.22*** | |||||||||||||||
| EC10, Salt stress condition with electrical conductivity of 10 dS/m. Data are means of three replications; *, ** and ***, Significance at the 0.05, 0.01 and 0.001 levels by the Fisher’s least significant difference, respectively. | |||||||||||||||||||||||
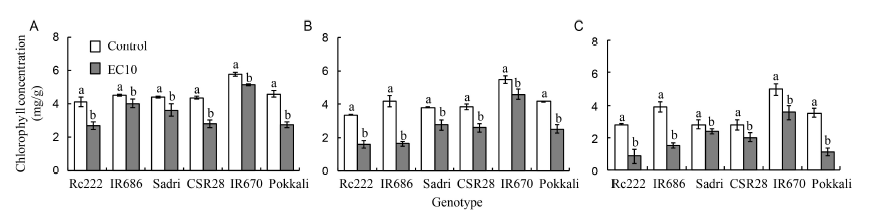
Fig. 1. Chlorophyll concentrations of the first (A), second (B) and third leaves (C) from the top in six rice genotypes at the flowering stage. EC10, Salt stress condition with electrical conductivity of 10 dS/m.Data are Mean ± SE (n = 3). Within groups, the same lowercase letter(s) indicate no significant difference at P < 0.05 by the Fisher’s least significant difference.
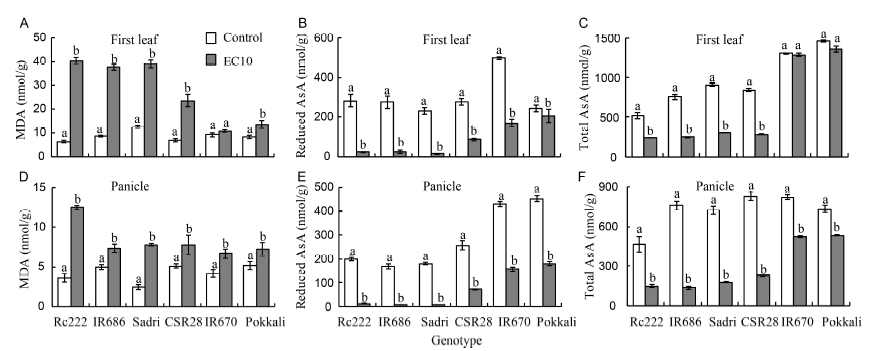
Fig. 2. Malondiadehyde (MDA) and ascorbate (AsA) concentrations in six rice genotypes at the flowering stage. A, MDA in the first leaf. B, Reduced AsA in the first leaf. C, Total AsA in the first leaf. D, MDA in the developing panicle. E, Reduced AsA in the developing panicle. F, Total AsA in the developing panicle.EC10, Salt stress condition with electrical conductivity of 10 dS/m.Data are Mean ± SE (n = 3). Within groups, the same lowercase letter(s) indicate no significant difference at P < 0.05 by the Fisher’s least significant difference.
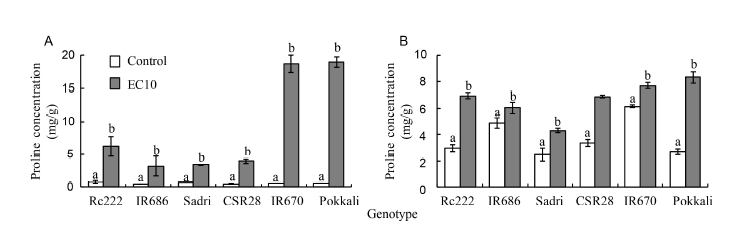
Fig. 3. Proline concentration in the first leaves (A) and panicles (B) of six rice genotypes at the flowering stage. Data are Mean ± SE (n = 3). Within groups, the same different letter(s) indicate significant difference at P < 0.05 by the Fisher’s least significant difference.
| [1] | Abdullah Z, Khan M A, Flowers T J.2001. Causes of sterility in seed set of rice under salinity stress.J Agron Crop Sci, 187(1): 25-32. |
| [2] | Abogadallah G M.2010. Insights into the significance of antioxidative defense under salt stress.Plant Signal Behav, 5(4): 369-374. |
| [3] | Adem G D, Roy S J, Zhou M, Bowman J P, Shabala S.2014. Evaluating contribution of ionic, osmotic and oxidative stress components towards salinity tolerance in barley.BMC Plant Biol, 14: 113. |
| [4] | Ansari R, Shereen A, Flowers T J.2001. Identifying rice lines for improved salt tolerance from a mapping population: In: Peng S, Hardy B. Rice Research for Food Security and Poverty Alleviation. Los Baños, the Philippines:International Rice Research Institute. |
| [5] | Asch F, Dingkuhn M, Wittstock C, Doerffling K.1999. Sodium and potassium uptake of rice panicles as affected by salinity and season in relation to yield and yield components.Plant Soil, 207: 133-145. |
| [6] | Bates L S, Waldren R P, Teare I D.1973. Rapid determination of free proline for water-stress studies.Plant Soil, 39(1): 205-207. |
| [7] | Bhusan D, Das D K, Hossain M, Murata Y, Hoque M A.2016. Improvement of salt tolerance in rice (Oryza sativa L.) by increasing antioxidant defense systems using exogenous application of proline. Aust J Crop Sci, 10(1): 50-56. |
| [8] | Biancucci M, Mattioli R, Forlani G, Funck D, Costantino P, Trovato M.2015. Role of proline and GABA in sexual reproduction of angiosperms.Front Plant Sci, 6: 680. |
| [9] | Bielen A, Remans T, Vangronsveld J, Cuypers A.2013. The influence of metal stress on the availability and redox state of ascorbate, and possible interference with its cellular functions.Int J Mol Sci, 14(3): 6382-6413. |
| [10] | Bozorgmehr M R, Monhemi H.2015. How can a free amino acid stabilize a protein? Insights from molecular dynamics simulation.J Solution Chem, 44(1): 45-53. |
| [11] | Cha-um S, Chuencharoen S, Mongkolsiriwatana C, Ashraf M, Kirdmanee C.2012. Screening sugarcane (Saccharum sp.) genotypes for salt tolerance using multivariate cluster analysis. Plant Cell Tiss Org, 110(1): 23-33. |
| [12] | Chunthaburee S, Dongsansuk A, Sanitchon J, Pattanagul W, Theerakulpisut P.2016. Physiological and biochemical parameters for evaluation and clustering of rice cultivars differing in salt tolerance at seedling stage.Saudi J Biol Sci, 23(4): 467-477. |
| [13] | Davenport R, James R A, Zakrisson-Plogander A, Tester M, Munns R.2005. Control of sodium transport in durum wheat.Plant Physiol, 137(3): 807-818. |
| [14] | Dionisio-Sese M L, Tobita S.1998. Antioxidant responses of rice seedlings to salinity stress.Plant Sci, 135(1): 1-9. |
| [15] | Dionisio-Sese M L, Tobita S.2000. Effects of salinity on sodium content and photosynthetic responses of rice seedlings differing in salt tolerance.J Plant Physiol, 157(1): 54-58. |
| [16] | Evans M J, Choi W G, Gilroy S, Morris R J.2016. A ROS-assisted calcium wave dependent on the AtRBOHD NADPH oxidase and TPC1 cation channel propagates the systemic response to salt stress.Plant Physiol, 171(3): 1771-1784. |
| [17] | Genc Y, McDonald G K, Tester M.2007. Reassessment of tissue Na+ concentration as a criterion for salinity tolerance in bread wheat.Plant Cell Environ, 30(11): 1486-1498. |
| [18] | Ghosh N, Adak M K, Ghosh P D, Gupta S, Sen Gupta D N, Mandal C.2011. Differential responses of two rice varieties to salt stress.Plant Biotechnol Rep, 5(1): 89-103. |
| [19] | Gupta B, Huang B.2014. Mechanism of salinity tolerance in plants: Physiological, biochemical, and molecular characterization.Int J Genomics, 2014(1): 701596. |
| [20] | Hakim M A, Juraimi A S, Begum M, Hanafi M M, Ismail M R, Selamat A.2010. Effect of salt stress on germination and early seedling growth of rice (Oryza sativa L.). Afr J Biotechnol, 9(13): 1911-1918. |
| [21] | Hasanuzzaman M, Hossain M A, da Silva J A T, Fujita M.2012. Plant response and tolerance to abiotic oxidative stress: Antioxidant defense is a key factor. In: Asif M, Kamran A. Crop Stress and Its Management: Perspectives and Strategies. Springer Netherlands: 261-315. |
| [22] | Hasegawa P M, Bressan R A, Zhu J K, Bohnert H J.2000. Plant cellular and molecular responses to high salinity.Annu Rev Plant Physiol Plant Mol Biol, 51(1): 463-499. |
| [23] | Hauser F, Horie T.2010. A conserved primary salt tolerance mechanism mediated by HKT transporters: A mechanism for sodium exclusion and maintenance of high K+/Na+ ratio in leaves during salinity stress.Plant Cell Environ, 33(4): 552-565. |
| [24] | Hodges D M, DeLong J M, Forney C F, Prange R K.1999. Improving the thiobarbituric acid-reactive-substances assay for estimating lipid peroxidation in plant tissues containing anthocyanin and other interfering compounds.Planta, 207(4): 604-611. |
| [25] | Höller S, Ueda Y, Wu L, Wang Y, Hajirezaei M R, Ghaffari M R, von Wirèn N, Frei M.2015. Ascorbate biosynthesis and its involvement in stress tolerance and plant development in rice (Oryza sativa L.). Plant Mol Biol, 88(6): 545-560. |
| [26] | Hoque M A, Banu M N A, Nakamura Y, Shimoishi Y, Murata Y.2008. Proline and glycinebetaine enhance antioxidant defense and methylglyoxal detoxification systems and reduce NaCl-induced damage in cultured tobacco cells.J Plant Physiol, 165(8): 813-824. |
| [27] | Ismail A M, Heuer S, Thomson M J, Wissuwa M.2007. Genetic and genomic approaches to develop rice germplasm for problem soils.Plant Mol Biol, 65(4): 547-570. |
| [28] | Ismail A M, Horie T.2017. Genomics, physiology, and molecular breeding approaches for improving salt tolerance.Annu Rev Plant Biol, 68(1): 405-434. |
| [29] | James R A, Rivelli A R, Munns R, von Caemmerer S.2002. Factors affecting CO2 assimilation, leaf injury and growth in salt-stressed durum wheat.Funct Plant Biol, 29(12): 1393-1403. |
| [30] | James R A, Blake C, Byrt C S, Munns R.2011. Major genes for Na+ exclusion,Nax1 and Nax2(wheat HKT1;4 and HKT1;5), decrease Na+ accumulation in bread wheat leaves under saline and waterlogged conditions. J Exp Bot, 62(8): 2939-2947. |
| [31] | Kanawapee N, Sanitchon J, Srihaban P, Theerakulpisut P.2013. Physiological changes during development of rice (Oryza sativa L.) varieties differing in salt tolerance under saline field condition. Plant Soil, 370: 89-101. |
| [32] | Kibria M G, Hossain M, Murata Y, Hoque M A.2017. Antioxidant defense mechanisms of salinity tolerance in rice genotype.Rice Sci, 24(3): 155-162. |
| [33] | Khatun S, Rizzo C A, Flowers T J.1995. Genotypic variation in the effect of salinity on fertility in rice.Plant Soil, 173(2): 239-250. |
| [34] | Krishnamurthy S L, Sharma S K, Kumar V, Tiwari S, Singh N K.2015. Analysis of genomic region spanning Saltol using SSR markers in rice genotypes showing differential seedlings stage salt tolerance.J Plant Biochem Biotl, 25(3): 331-336. |
| [35] | Kumari P, Arya S, Pahuja S K, Joshi U N, Sharma S K.2016. Evaluation of forage sorghum genotypes for chlorophyll content under salt stress.Int J Sci Environ Technol, 5(3): 1200-1207. |
| [36] | Lichtenthaler H K, Buschmann C.2001. Chlorophylls and carotenoids: Measurement and characterization by UV-VIS spectroscopy. In: Cornforth D P. Current Protocols in Food Analytical Chemistry. New York,USA: John Wiley & Sons: 431-438. |
| [37] | Mariani C, Beuckeleer M D, Truettner J, Leemans J, Goldberg R B.1990. Induction of male sterility in plants by a chimaeric ribonuclease gene.Nature, 347: 737-741. |
| [38] | Mattioli R, Biancucci M, Lonoce C, Costantino P, Trovato M.2012. Proline is required for male gametophyte development inArabidopsis. BMC Plant Biol, 12: 236. |
| [39] | Mitsuya S, Yano K, Kawasaki M, Taniguchi M, Miyak H.2002. Relationship between the distribution of Na+ and the damages caused by salinity in the leaves of rice seedlings grown under a saline condition.Plant Prod Sci, 5(4): 269-274. |
| [40] | Mittal S, Kumari N, Sharma V.2012. Differential response of salt stress onBrassica juncea: Photosynthetic performance, pigment, proline, D1 and antioxidant enzymes. Plant Physiol Biochem, 54: 17-26. |
| [41] | Miyaji T, Kuromori T, Takeuchi Y, Yamaji N, Yokosho K, Shimazawa A, Sugimoto E, Omote H, Ma J F, Shinozaki K, Moriyama Y.2015. AtPHT4;4 is a chloroplast-localized ascorbate transporter in Arabidopsis. Nat Commun, 6: 5928. |
| [42] | Mohammadi-Nejad G, Arzani A, Rezai A M, Singh R K, Gregorio G B.2008. Assessment of rice genotypes for salt tolerance using microsatellite markers associated with the saltol QTL.Afr J Biotechnol, 7(6): 730-736. |
| [43] | Moradi F, Ismail A M, Gregorio G B, Egdane J A.2003. Salinity tolerance of rice during reproductive development and association with tolerance at the seedling stage.Ind J Plant Physiol, 8: 105-116. |
| [44] | Moradi F, Ismail A M.2007. Responses of photosynthesis, chlorophyll fluorescence and ROS-scavenging systems to salt stress during seedling and reproductive stages in rice.Ann Bot, 99(6): 1161-1173. |
| [45] | Morales S G, Trejo-Téllez L I, Gómez Merino F C, Caldana C, Espinosa-Victoria D, Herrera Cabrera B E.2012. Growth, photosynthetic activity, and potassium and sodium concentration in rice plants under salt stress.Acta Sci Agron, 34(3): 317-324. |
| [46] | Munns R, Fisher D B, Tonnet M L.1986. Na+ and Cl- transport in the phloem from leaves of NaCl-treated barley.Aust J Plant Physiol, 13(6): 757-766. |
| [47] | Munns R, James R A, Lauchli A.2006. Approaches to increasing the salt tolerance of wheat and other cereals.J Exp Bot, 57(5): 1025-1043. |
| [48] | Munns R, Rawson H M.1999. Effect of salinity on salt accumulation and reproductive development in the apical meristem of wheat and barley.Aust J Plant Physiol, 26(5): 459-464. |
| [49] | Munns R, Tester M.2008. Mechanisms of salinity tolerance.Ann Rev Plant Biol, 59: 651-681. |
| [50] | Oyiga B C, Sharma R C, Shen J, Baum M, Ogbonnaya F C, Léon J, Ballvora A.2016. Identification and characterization of salt tolerance of wheat germplasm using a multivariable screening approach.J Agron Crop Sci, 202(6): 472-485. |
| [51] | Oyiga B C, Sharma R C, Baum M, Ogbonnaya F C, Léon J, Ballvora A.2017. Allelic variations and differential expressions detected at quantitative trait loci for salt stress tolerance in wheat: GWAS reveals gene loci for salt tolerance in wheat.Plant Cell Environ, 41(1): 1-17. |
| [52] | Palao C D C, de La Viña C B, Gregorio G B, Singh R K.2013. A new phenotyping technique for salinity tolerance at the reproductive stage in rice.Oryza, 50(3): 199-207. |
| [53] | Parida A K, Das A B.2005. Salt tolerance and salinity effects on plants: A review.Ecotox Environ Safe, 60(3): 324-349. |
| [54] | Paupière M J, van Heusden A W, Bovy A G.2014. The metabolic basis of pollen thermo-tolerance: Perspectives for breeding.Metabolites, 4(4): 889-920. |
| [55] | Platten J D, Egdane J A, Ismail A M.2013. Salinity tolerance, Na+ exclusion and allele mining of HKT1;5 inOryza sativa and O. glaberrima; many sources, many genes, one mechanism? BMC Plant Biol, 13: 32. |
| [56] | Qureshi A S, Al-Falahi A A.2015. Extent, characterization and causes of soil salinity in central and southern Iraq and possible reclamation strategies.Int J Eng Res Appl, 5(1): 84-94. |
| [57] | Rao P S, Mishra B, Gupta S R, Rathore A.2008. Reproductive stage tolerance to salinity and alkalinity stresses in rice genotypes.Plant Breeding, 127(3): 256-261. |
| [58] | Rao P S, Mishra B, Gupta S R.2013. Effects of soil salinity and alkalinity on grain quality of tolerant, semi-tolerant and sensitive rice genotypes.Rice Sci, 20(4): 284-291. |
| [59] | Ravikiran K T, Krishnamurthy S L, Warraich A S, Sharma P C.2018. Diversity and haplotypes of genotypes for seedling stage tolerance analyzed through morpho-physiological and SSR markers.Field Crops Res, 220: 10-18. |
| [60] | Roy S J, Negrão S, Tester M.2014. Salt resistant crop plants.Curr Opin Biotechnol, 26: 115-124. |
| [61] | Saddiq M S, Afzal I, Basra S M A, Ali Z, Ibrahim A M H.2017. Sodium exclusion is a reliable trait for the improvement of salinity tolerance in bread wheat.Arch Agron Soil Sci, 64(2): 272-284. |
| [62] | Saeedipour S.2014a. Effects of salinity stress on growth, chlorophyll content and ion accumulation in twoindica rice(Oryza sativa L.) cultivars differing in salinity tolerance. Int J Biosci, 4(4): 33-40. |
| [63] | Saeedipour S.2014b. The effect of salinity stress on ions distribution in panicle, flag leaf and leaf sheaths of two rice (Oryza sativa L.) genotypes differing in salt tolerance. Int J Biosci, 4(10): 269-275. |
| [64] | Sanoubar R, Cellini A, Veroni A M, Spinelli F, Masia A, Vittori Antisari L, Orsini F, Gianquinto G.2016. Salinity thresholds and genotypic variability of cabbage (Brassica oleracea L.) grown under saline stress. J Sci Food Agric, 96(1): 319-330. |
| [65] | Sarhadi E, Bazargani M M, Sajise A G, Abdolahi S, Vispo N A, Arceta M, Nejad G M, Singh R K, Salekdeh G H.2012. Proteomic analysis of rice anthers under salt stress.Plant Physiol Bioc, 58: 280-287. |
| [66] | Schmidt T, Situ A J, Ulmer T S.2016. Structural and thermodynamic basis of proline-induced transmembrane complex stabilization.Sci Rep, 6: 29809. |
| [67] | Shabala S, Cuin T A.2008. Potassium transport and plant salt tolerance.Physiol Plant, 133(4): 651-669. |
| [68] | Shigeoka S, Yokota A, Nakano Y, Kitaoka S.1979. The effect of illumination on theL-ascorbic acid content in Euglena gracilis z. Agric Biol Chem, 43(10): 2053-2058. |
| [69] | Singh R K, Flowers T J.2010. The physiology and molecular biology of the effects of salinity on rice. In: Pessarakli M. Handbook of Plant and Crop Stress. Florida: Taylor & Francis: 899-939. |
| [70] | Suzuki K, Yamaji N, Costa A, Okuma E, Kobayashi N I, Kashiwagi T, Katsuhara M, Wang C, Tanoi K, Murata Y, Schroeder J I, Ma J F, Horie T.2016. OsHKT1;4-mediated Na+ transport in stems contributes to Na+ exclusion from leaf blades of rice at the reproductive growth stage upon salt stress.BMC Plant Biol, 16: 22. |
| [71] | Szabados L, Savouré A.2010. Proline: A multifunctional amino acid.Trends Plant Sci, 15(2): 89-97. |
| [72] | Taïbi K, Taïbi F, Abderrahim L A, Ennajah A, Belkhodja M, Mulet J M.2016. Effect of salt stress on growth, chlorophyll content, lipid peroxidation and antioxidant defence systems inPhaseolus vulgaris L. S Afr J Bot, 105: 306-312. |
| [73] | Wankhade S D, Sanz A.2013. Chronic mild salinity affects source leaves physiology and productivity parameters of rice plants (Oryza sativa L., cv. Taipei 309). Plant Soil, 367: 663-672. |
| [74] | Wassmann R, Hien N X, Hoanh C T, Tuong T P.2004. Sea level rise affecting theVietnamese Mekong Delta: Water elevation in the flood season and implications for rice production. Clim Change, 66: 89-107. |
| [75] | Wu H H, Shabala L, Zhou M X, Shabala S.2014. Durum and bread wheat differ in their ability to retain potassium in leaf mesophyll: Implications for salinity stress tolerance.Plant Cell Physiol, 55(10): 1749-1762. |
| [76] | Wu H H, Zhu M, Shabala L, Zhou M X, Shabala S.2015. K+ retention in leaf mesophyll, an overlooked component of salinity tolerance mechanism: A case study for barley.J Integr Plant Biol, 57(2): 171-185. |
| [77] | Yang J C, Peng S B, Visperas R M, Sanico A L, Zhu Q S, Gu S L.2000. Grain filling pattern and cytokinin content in the grains and roots of rice plants.Plant Growth Regul, 30(3): 261-270. |
| [78] | Zahra J, Nazim H, Cai S G, Han Y, Wu D Z, Zhang B L, Haider S I, Zhang G P.2014. The influence of salinity on cell ultrastructures and photosynthetic apparatus of barley genotypes differing in salt stress tolerance.Acta Physiol Plant, 36(5): 1261-1269. |
| [79] | Zeng L, Shannon M C.2000. Salinity effects on seedling growth and yield components of rice.Crop Sci, 40(4): 996-1003. |
| [80] | Zhu M, Shabala S, Shabala L, Fan Y, Zhou M X.2016. Evaluating predictive values of various physiological indices for salinity stress tolerance in wheat.J Agron Crop Sci, 202(2): 115-124. |
| [1] | Prathap V, Suresh KUMAR, Nand Lal MEENA, Chirag MAHESHWARI, Monika DALAL, Aruna TYAGI. Phosphorus Starvation Tolerance in Rice Through a Combined Physiological, Biochemical and Proteome Analysis [J]. Rice Science, 2023, 30(6): 8-. |
| [2] | Serena REGGI, Elisabetta ONELLI, Alessandra MOSCATELLI, Nadia STROPPA, Matteo Dell’ANNO, Kiril PERFANOV, Luciana ROSSI. Seed-Specific Expression of Apolipoprotein A-IMilano Dimer in Rice Engineered Lines [J]. Rice Science, 2023, 30(6): 6-. |
| [3] | Sundus ZAFAR, XU Jianlong. Recent Advances to Enhance Nutritional Quality of Rice [J]. Rice Science, 2023, 30(6): 4-. |
| [4] | Kankunlanach KHAMPUANG, Nanthana CHAIWONG, Atilla YAZICI, Baris DEMIRER, Ismail CAKMAK, Chanakan PROM-U-THAI. Effect of Sulfur Fertilization on Productivity and Grain Zinc Yield of Rice Grown under Low and Adequate Soil Zinc Applications [J]. Rice Science, 2023, 30(6): 9-. |
| [5] | FAN Fengfeng, CAI Meng, LUO Xiong, LIU Manman, YUAN Huanran, CHENG Mingxing, Ayaz AHMAD, LI Nengwu, LI Shaoqing. Novel QTLs from Wild Rice Oryza longistaminata Confer Rice Strong Tolerance to High Temperature at Seedling Stage [J]. Rice Science, 2023, 30(6): 14-. |
| [6] | LIN Shaodan, YAO Yue, LI Jiayi, LI Xiaobin, MA Jie, WENG Haiyong, CHENG Zuxin, YE Dapeng. Application of UAV-Based Imaging and Deep Learning in Assessment of Rice Blast Resistance [J]. Rice Science, 2023, 30(6): 10-. |
| [7] | Md. Forshed DEWAN, Md. AHIDUZZAMAN, Md. Nahidul ISLAM, Habibul Bari SHOZIB. Potential Benefits of Bioactive Compounds of Traditional Rice Grown in South and South-East Asia: A Review [J]. Rice Science, 2023, 30(6): 5-. |
| [8] | Raja CHAKRABORTY, Pratap KALITA, Saikat SEN. Phenolic Profile, Antioxidant, Antihyperlipidemic and Cardiac Risk Preventive Effect of Chakhao Poireiton (A Pigmented Black Rice) in High-Fat High-Sugar induced Rats [J]. Rice Science, 2023, 30(6): 11-. |
| [9] | LI Qianlong, FENG Qi, WANG Heqin, KANG Yunhai, ZHANG Conghe, DU Ming, ZHANG Yunhu, WANG Hui, CHEN Jinjie, HAN Bin, FANG Yu, WANG Ahong. Genome-Wide Dissection of Quan 9311A Breeding Process and Application Advantages [J]. Rice Science, 2023, 30(6): 7-. |
| [10] | JI Dongling, XIAO Wenhui, SUN Zhiwei, LIU Lijun, GU Junfei, ZHANG Hao, Tom Matthew HARRISON, LIU Ke, WANG Zhiqin, WANG Weilu, YANG Jianchang. Translocation and Distribution of Carbon-Nitrogen in Relation to Rice Yield and Grain Quality as Affected by High Temperature at Early Panicle Initiation Stage [J]. Rice Science, 2023, 30(6): 12-. |
| [11] | Nazaratul Ashifa Abdullah Salim, Norlida Mat Daud, Julieta Griboff, Abdul Rahim Harun. Elemental Assessments in Paddy Soil for Geographical Traceability of Rice from Peninsular Malaysia [J]. Rice Science, 2023, 30(5): 486-498. |
| [12] | Ammara Latif, Sun Ying, Pu Cuixia, Noman Ali. Rice Curled Its Leaves Either Adaxially or Abaxially to Combat Drought Stress [J]. Rice Science, 2023, 30(5): 405-416. |
| [13] | Liu Qiao, Qiu Linlin, Hua Yangguang, Li Jing, Pang Bo, Zhai Yufeng, Wang Dekai. LHD3 Encoding a J-Domain Protein Controls Heading Date in Rice [J]. Rice Science, 2023, 30(5): 437-448. |
| [14] | Lu Xuedan, Li Fan, Xiao Yunhua, Wang Feng, Zhang Guilian, Deng Huabing, Tang Wenbang. Grain Shape Genes: Shaping the Future of Rice Breeding [J]. Rice Science, 2023, 30(5): 379-404. |
| [15] | Zhang Guomei, Li Han, Liu Shanshan, Zhou Xuming, Lu Mingyang, Tang Liang, Sun Lihua. Water Extract of Rice False Smut Balls Activates Nrf2/HO-1 and Apoptosis Pathways, Causing Liver Injury [J]. Rice Science, 2023, 30(5): 473-485. |
| Viewed | ||||||
|
Full text |
|
|||||
|
Abstract |
|
|||||