Rice Science ›› 2019, Vol. 26 ›› Issue (5): 319-330.DOI: 10.1016/j.rsci.2019.08.006
• Research Papers • Previous Articles Next Articles
B. Pedroso Giovanni, R. Philippsen Michael, F. Saldanha Loisleini, B. Araujo Raiara, F. Martins Ayrton( )
)
Received:2018-08-15
Accepted:2018-10-29
Online:2019-09-28
Published:2019-05-24
B. Pedroso Giovanni, R. Philippsen Michael, F. Saldanha Loisleini, B. Araujo Raiara, F. Martins Ayrton. Strategies for Fermentable Sugar Production by Using Pressurized Acid Hydrolysis for Rice Husks[J]. Rice Science, 2019, 26(5): 319-330.
Add to citation manager EndNote|Ris|BibTeX
| Acid | Factor | Level | ||||
|---|---|---|---|---|---|---|
| -1.68 | -1 | 0 | 1 | 1.68 | ||
| HCl | Concentration (%) | 0.8 | 1.5 | 2.5 | 3.5 | 4.2 |
| Time (min) | 28 | 35 | 45 | 55 | 62 | |
| Temperature (ºC) | 128 | 135 | 145 | 155 | 162 | |
| H2SO4 | Concentration (%) | 0.8 | 1.5 | 2.5 | 3.5 | 4.2 |
| Time (min) | 28 | 35 | 45 | 55 | 62 | |
| Temperature (ºC) | 128 | 135 | 145 | 155 | 162 | |
| H3PO4 | Concentration (%) | 0.9 | 1.9 | 3.4 | 4.9 | 6 |
| Time (min) | 28 | 35 | 45 | 55 | 62 | |
| Temperature (ºC) | 128 | 135 | 145 | 155 | 162 | |
| HNO3 | Concentration (%) | 0.6 | 1.4 | 2.6 | 3.8 | 4.5 |
| Time (min) | 28 | 35 | 45 | 55 | 62 | |
| Temperature (ºC) | 128 | 135 | 145 | 155 | 162 | |
Table 1 Central composite rotational design values for yield determination of glucose, xylose and arabinose through acid hydrolysis of rice husks.
| Acid | Factor | Level | ||||
|---|---|---|---|---|---|---|
| -1.68 | -1 | 0 | 1 | 1.68 | ||
| HCl | Concentration (%) | 0.8 | 1.5 | 2.5 | 3.5 | 4.2 |
| Time (min) | 28 | 35 | 45 | 55 | 62 | |
| Temperature (ºC) | 128 | 135 | 145 | 155 | 162 | |
| H2SO4 | Concentration (%) | 0.8 | 1.5 | 2.5 | 3.5 | 4.2 |
| Time (min) | 28 | 35 | 45 | 55 | 62 | |
| Temperature (ºC) | 128 | 135 | 145 | 155 | 162 | |
| H3PO4 | Concentration (%) | 0.9 | 1.9 | 3.4 | 4.9 | 6 |
| Time (min) | 28 | 35 | 45 | 55 | 62 | |
| Temperature (ºC) | 128 | 135 | 145 | 155 | 162 | |
| HNO3 | Concentration (%) | 0.6 | 1.4 | 2.6 | 3.8 | 4.5 |
| Time (min) | 28 | 35 | 45 | 55 | 62 | |
| Temperature (ºC) | 128 | 135 | 145 | 155 | 162 | |
| Factor | Level | ||
|---|---|---|---|
| -1 | 0 | 1 | |
| Concentration (%) | 1 | 2.5 | 4 |
| Temperature (ºC) | 40 | 60 | 80 |
Table 2 Factorial design for the best detoxification conditions of rice husk hydrolysates.
| Factor | Level | ||
|---|---|---|---|
| -1 | 0 | 1 | |
| Concentration (%) | 1 | 2.5 | 4 |
| Temperature (ºC) | 40 | 60 | 80 |
| Analyst | Time (min) a | Regression equation | Linear range (g/L) | r2 | LOD | LOQ |
|---|---|---|---|---|---|---|
| Glucose | 11.3 | y = 322.15x + 1646.41 | 0.25-2.00 | 0.999 | 7 | 23 |
| Xylose | 12.2 | y = 312.35x - 152.25 | 0.25-2.00 | 0.999 | 7.5 | 25 |
| Arabinose | 13.4 | y = 324.30x - 704.10 | 0.25-2.00 | 0.998 | 7 | 23 |
| Fructose | 12.6 | y = 334.87x - 2345.60 | 0.25-2.00 | 0.999 | 7.5 | 25 |
| Rhamnose | 12.8 | y = 302.34x - 2976.68 | 0.25-2.00 | 0.999 | 7.5 | 25 |
| Formic acid | 16.8 | y = 99.79x - 1707.91 | 0.50-1.00 | 0.999 | 16.5 | 55 |
| Acetic acid | 18.2 | y = 128.54x - 1642.79 | 0.50-1.00 | 0.999 | 16.5 | 55 |
Table 3 Analytical figure-of-merit for the high performance liquid chromatography coupled to a refractive index detector (HPLC-RID) determinations.
| Analyst | Time (min) a | Regression equation | Linear range (g/L) | r2 | LOD | LOQ |
|---|---|---|---|---|---|---|
| Glucose | 11.3 | y = 322.15x + 1646.41 | 0.25-2.00 | 0.999 | 7 | 23 |
| Xylose | 12.2 | y = 312.35x - 152.25 | 0.25-2.00 | 0.999 | 7.5 | 25 |
| Arabinose | 13.4 | y = 324.30x - 704.10 | 0.25-2.00 | 0.998 | 7 | 23 |
| Fructose | 12.6 | y = 334.87x - 2345.60 | 0.25-2.00 | 0.999 | 7.5 | 25 |
| Rhamnose | 12.8 | y = 302.34x - 2976.68 | 0.25-2.00 | 0.999 | 7.5 | 25 |
| Formic acid | 16.8 | y = 99.79x - 1707.91 | 0.50-1.00 | 0.999 | 16.5 | 55 |
| Acetic acid | 18.2 | y = 128.54x - 1642.79 | 0.50-1.00 | 0.999 | 16.5 | 55 |
| Component | Hydrolysis products and subproducts (%) | |||
|---|---|---|---|---|
| Natural RH | Heat block | Stove | Microwave | |
| Glucose | 35.7 | 17.2 | 22.7 | 27.3 |
| Xylose | 14.8 | 2.3 | 13.6 | 14.3 |
| Arabinose | 3.6 | 0.7 | 3.3 | 2.9 |
| Soluble lignin | 4.2 | 0.1 | 0.2 | 0.1 |
| Insoluble lignin | 23.7 | 49.7 | 31.7 | 26.2 |
| Extractive | 1 | 0 | 0 | 0 |
| Ash | 17.2 | 30.5 | 28.8 | 29.6 |
| Total | 100.2 | 100.5 | 100.3 | 100.4 |
Table 4 Characterization of rice husk (RH) and resulting hydrolysis products and sub-products.
| Component | Hydrolysis products and subproducts (%) | |||
|---|---|---|---|---|
| Natural RH | Heat block | Stove | Microwave | |
| Glucose | 35.7 | 17.2 | 22.7 | 27.3 |
| Xylose | 14.8 | 2.3 | 13.6 | 14.3 |
| Arabinose | 3.6 | 0.7 | 3.3 | 2.9 |
| Soluble lignin | 4.2 | 0.1 | 0.2 | 0.1 |
| Insoluble lignin | 23.7 | 49.7 | 31.7 | 26.2 |
| Extractive | 1 | 0 | 0 | 0 |
| Ash | 17.2 | 30.5 | 28.8 | 29.6 |
| Total | 100.2 | 100.5 | 100.3 | 100.4 |
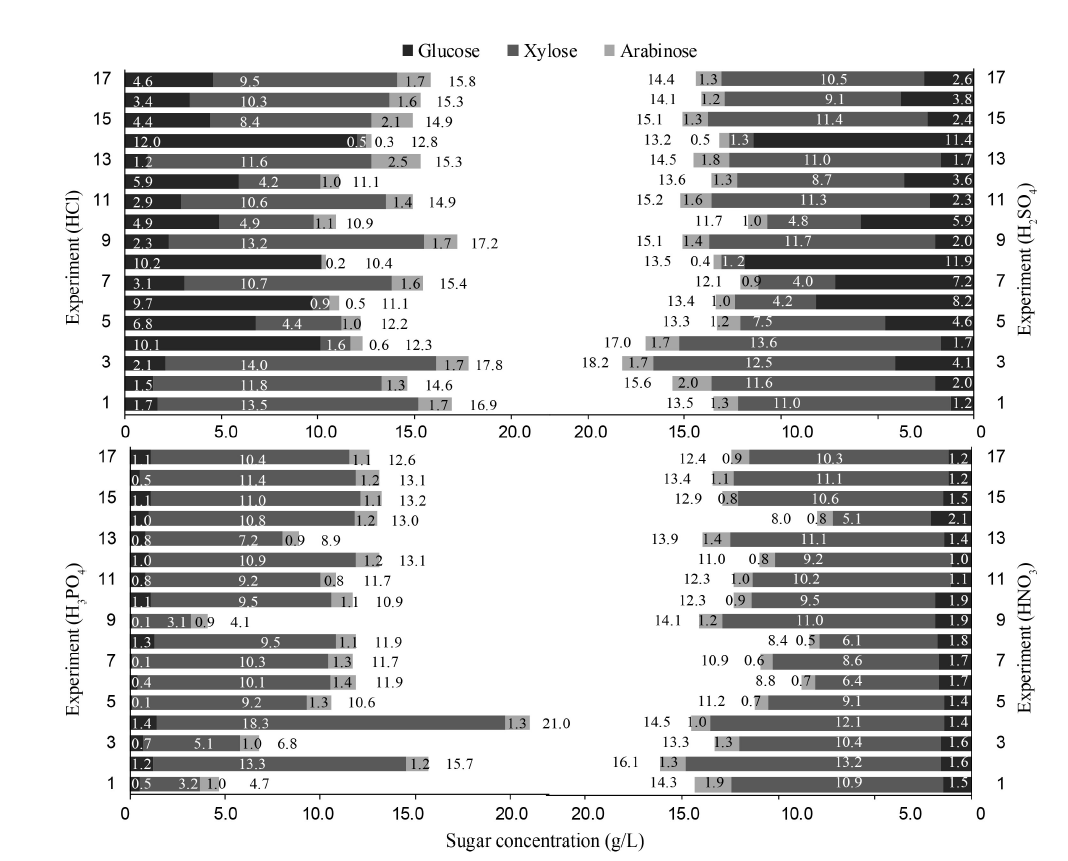
Fig. 1. Experimental design for pressurized hydrolysis strategies.
| Acid | Sugar | P value | R² | Adjusted R² | Mean | P- | Polynomial equation a |
|---|---|---|---|---|---|---|---|
| SE | value | ||||||
| Phosphoric | Glucose | < 0.005 | 0.83 | 0.774 | 0.128 | 0.956 | y = 0.992 + 0.419x1 - 0.092x12 + 0.133x1x3 - 0.075x2x3 |
| Xylose | < 0.005 | 0.902 | 0.827 | 0.246 | 0.082 | y = 10.890 + 2.502x1 - 1.314x12 + 0.749x2 + 0.387x3 - 0.349x32 - 2.901x1x3 - 0.805x2x3 | |
| Arabinose | > 0.005 | 0.445 | 0.256 | 0.003 | 0.009 | y = 1.120 + 0.052x1 - 0.038x2 + 0.088x3 - 0.070x1x3 | |
| Nitric | Glucose | < 0.005 | 0.894 | 0.812 | 0.035 | 0.903 | y = 1.327 + 0.191x12 - 0.091x22 + 0.127x3 + 0.152x32 - 0.062x1x2 + 0.066x1x3 + 0.057x2x3 |
| Xylose | < 0.005 | 0.977 | 0.963 | 0.188 | 0.656 | y = 10.56 - 0.269x1 - 0.305x2 - 0.264x22 - 1.894x3 - 0.782x32 - 1.159x1x3 | |
| Arabinose | < 0.005 | 0.854 | 0.788 | 0.031 | 0.666 | y = 1.003 - 0.114x1 - 0.113x2 - 0.304x3 + 0.074x32 - 0.782x1x3 + 0.087x2x3 | |
| Hydrochloric | Glucose | < 0.005 | 0.898 | 0.838 | 0.422 | 0.162 | y = 4.310 + 1.628x1 + 0.788x2 + 2.395x3 + 0.991x32 + 1.544x1x2 - 1.520x2x3 |
| Xylose | < 0.005 | 0.964 | 0.936 | 0.935 | 0.394 | y = 9.158 - 3.117x1 - 1.111x2 - 0.705x22 - 3.205x3 - 1.183x32 - 2.256x1x2 - 1.874x2x3 | |
| Arabinose | < 0.005 | 0.808 | 0.692 | 0.069 | 0.378 | y = 1.804 - 0.330x1 - 0.186x12 - 0.248x22 - 0.420x3 - 0.193x32 - 0.212x1x2 | |
| Sulfuric | Glucose | < 0.005 | 0.976 | 0.963 | 0.587 | 0.716 | y = 3.373 + 1.176x1 + 0.598x2 + 3.075x3 + 1.232x32 + 0.900x1x3 - 0.795x2x3 |
| Xylose | < 0.005 | 0.926 | 0.882 | 1.383 | 0.473 | y = 10.218 - 1.811x1 - 0.665x12 - 3.523x3 - 1.407x32 - 0.991x1x3 - 1.262x2x3 | |
| Arabinose | < 0.005 | 0.948 | 0.918 | 0.009 | 0.428 | y = 1.209 - 0.097x2 - 0.080x22 - 0.384x3 - 0.095x1x2 - 0.174x1x3 - 0.115x2x3 |
Table 5 Polynomial equations and model adjustment values for the pressurized acid hydrolysis of rice husks by ANOVA analysis.
| Acid | Sugar | P value | R² | Adjusted R² | Mean | P- | Polynomial equation a |
|---|---|---|---|---|---|---|---|
| SE | value | ||||||
| Phosphoric | Glucose | < 0.005 | 0.83 | 0.774 | 0.128 | 0.956 | y = 0.992 + 0.419x1 - 0.092x12 + 0.133x1x3 - 0.075x2x3 |
| Xylose | < 0.005 | 0.902 | 0.827 | 0.246 | 0.082 | y = 10.890 + 2.502x1 - 1.314x12 + 0.749x2 + 0.387x3 - 0.349x32 - 2.901x1x3 - 0.805x2x3 | |
| Arabinose | > 0.005 | 0.445 | 0.256 | 0.003 | 0.009 | y = 1.120 + 0.052x1 - 0.038x2 + 0.088x3 - 0.070x1x3 | |
| Nitric | Glucose | < 0.005 | 0.894 | 0.812 | 0.035 | 0.903 | y = 1.327 + 0.191x12 - 0.091x22 + 0.127x3 + 0.152x32 - 0.062x1x2 + 0.066x1x3 + 0.057x2x3 |
| Xylose | < 0.005 | 0.977 | 0.963 | 0.188 | 0.656 | y = 10.56 - 0.269x1 - 0.305x2 - 0.264x22 - 1.894x3 - 0.782x32 - 1.159x1x3 | |
| Arabinose | < 0.005 | 0.854 | 0.788 | 0.031 | 0.666 | y = 1.003 - 0.114x1 - 0.113x2 - 0.304x3 + 0.074x32 - 0.782x1x3 + 0.087x2x3 | |
| Hydrochloric | Glucose | < 0.005 | 0.898 | 0.838 | 0.422 | 0.162 | y = 4.310 + 1.628x1 + 0.788x2 + 2.395x3 + 0.991x32 + 1.544x1x2 - 1.520x2x3 |
| Xylose | < 0.005 | 0.964 | 0.936 | 0.935 | 0.394 | y = 9.158 - 3.117x1 - 1.111x2 - 0.705x22 - 3.205x3 - 1.183x32 - 2.256x1x2 - 1.874x2x3 | |
| Arabinose | < 0.005 | 0.808 | 0.692 | 0.069 | 0.378 | y = 1.804 - 0.330x1 - 0.186x12 - 0.248x22 - 0.420x3 - 0.193x32 - 0.212x1x2 | |
| Sulfuric | Glucose | < 0.005 | 0.976 | 0.963 | 0.587 | 0.716 | y = 3.373 + 1.176x1 + 0.598x2 + 3.075x3 + 1.232x32 + 0.900x1x3 - 0.795x2x3 |
| Xylose | < 0.005 | 0.926 | 0.882 | 1.383 | 0.473 | y = 10.218 - 1.811x1 - 0.665x12 - 3.523x3 - 1.407x32 - 0.991x1x3 - 1.262x2x3 | |
| Arabinose | < 0.005 | 0.948 | 0.918 | 0.009 | 0.428 | y = 1.209 - 0.097x2 - 0.080x22 - 0.384x3 - 0.095x1x2 - 0.174x1x3 - 0.115x2x3 |
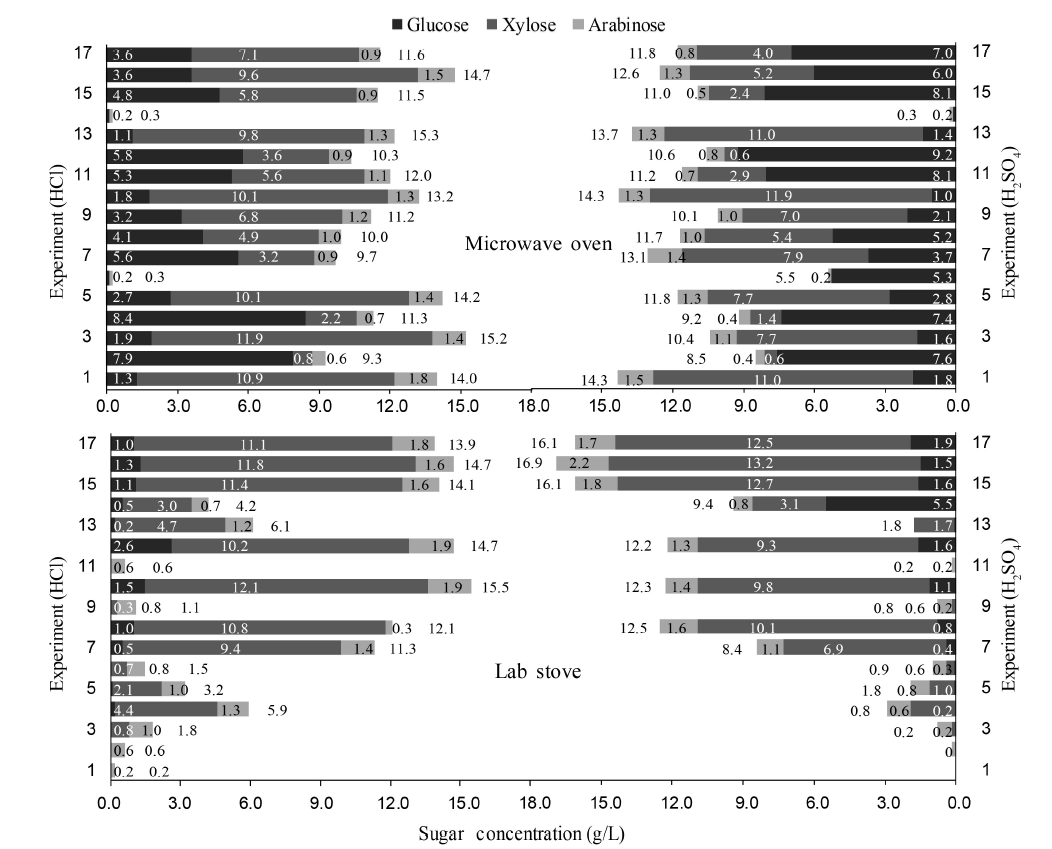
Fig. 2. Total 17 experimental designs for the hydrolysis strategies using microwave oven and the laboratory (lab) stove.
| Acid | Sugar | P-value | R² | Adjusted R² | Mean SE | P- | Polynomial equation a |
|---|---|---|---|---|---|---|---|
| value | |||||||
| Hydrochloric (Lab stove) | Glucose | < 0.005 | 0.62 | 0.504 | 0.022 | 0.069 | y = 1.092 + 0.221x1 - 0.247x12 + 0.427x2 - 0.391x32 |
| Xylose | < 0.005 | 0.83 | 0.698 | 0.123 | 0.013 | y = 11.516 + 1.705x1 - 2.093x12 + 2.914x2 - 2.512x22 + 1.086x3 - 2.940x32 - 1.517x2x3 | |
| Arabinose | < 0.005 | 0.781 | 0.65 | 0.025 | 0.202 | y = 1.637 + 0.173x1 - 0.159x12 + 0.342x - 0.171x22 - 0.293x32 - 0.120x1x3 | |
| Sulfuric | Glucose | < 0.005 | 0.591 | 0.405 | 0.044 | 0.032 | y = 1.905 + 0.172x1 - 0.691x12 + 0.279x2 - 0.611x22 + 0.761x3 |
| (Lab stove) | Xylose | < 0.005 | 0.919 | 0.857 | 0.129 | 0.026 | y = 12.86 + 1.484x1 - 2.962x12 + 2.459x2 - 3.086x22 + 1.348x3 - 3.886x32 + 1.687x2x3 |
| Arabinose | < 0.005 | 0.951 | 0.922 | 0.065 | 0.864 | y = 1.913 + 0.158x1 - 0.289x12 + 0.325x2 - 0.386x22 + 0.265x3 + 0.518x32 | |
| Hydrochloric (MW oven) | Glucose | < 0.005 | 0.739 | 0.621 | 0.569 | 0.185 | y = 3.562 + 0.636x2 + 0.895x22 - 0.642x3 - 0.856x32 - 2.149x1x3 |
| Xylose | > 0.005 | 0.564 | 0.303 | 3.73 | 0.004 | y = 7.835 - 1.662x1 - 1.178x22 - 1.795x3 - 1.101x32 - 1.546x1x2 - 1.408x1x3 | |
| Arabinose | < 0.005 | 0.634 | 0.468 | 0.136 | 0.686 | y = 1.127 - 0.218x1 - 0.222x3 - 0.137x32 + 0.235x1x2 + 0.089x1x3 | |
| Sulfuric | Glucose | < 0.005 | 0.829 | 0.752 | 1.091 | 0.349 | y = 6.971 + 1.002x1 - 1.720x12 + 0.790x22 + 2.003x32 + 0.941x1x3 |
| (MW oven) | Xylose | > 0.005 | 0.504 | 0.206 | 2.07 | 0.002 | y = 4.461 - 1.377x1 - 1.749x12 - 0.992x2 - 1.347x3 - 1.184x1x2 - 1.035x2x3 |
| Arabinose | > 0.005 | 0.438 | 0.181 | 0.17 | 0.001 | y = 0.786 - 0.205x1 + 0.137x12 - 0.111x3 + 0.146x1x + 0.181x2x3 |
Table 6 Polynomial equations and model adjustment values for the acid hydrolysis of rice husks by ANOVA analysis in the microwave (MW) oven and laboratory (lab) stove.
| Acid | Sugar | P-value | R² | Adjusted R² | Mean SE | P- | Polynomial equation a |
|---|---|---|---|---|---|---|---|
| value | |||||||
| Hydrochloric (Lab stove) | Glucose | < 0.005 | 0.62 | 0.504 | 0.022 | 0.069 | y = 1.092 + 0.221x1 - 0.247x12 + 0.427x2 - 0.391x32 |
| Xylose | < 0.005 | 0.83 | 0.698 | 0.123 | 0.013 | y = 11.516 + 1.705x1 - 2.093x12 + 2.914x2 - 2.512x22 + 1.086x3 - 2.940x32 - 1.517x2x3 | |
| Arabinose | < 0.005 | 0.781 | 0.65 | 0.025 | 0.202 | y = 1.637 + 0.173x1 - 0.159x12 + 0.342x - 0.171x22 - 0.293x32 - 0.120x1x3 | |
| Sulfuric | Glucose | < 0.005 | 0.591 | 0.405 | 0.044 | 0.032 | y = 1.905 + 0.172x1 - 0.691x12 + 0.279x2 - 0.611x22 + 0.761x3 |
| (Lab stove) | Xylose | < 0.005 | 0.919 | 0.857 | 0.129 | 0.026 | y = 12.86 + 1.484x1 - 2.962x12 + 2.459x2 - 3.086x22 + 1.348x3 - 3.886x32 + 1.687x2x3 |
| Arabinose | < 0.005 | 0.951 | 0.922 | 0.065 | 0.864 | y = 1.913 + 0.158x1 - 0.289x12 + 0.325x2 - 0.386x22 + 0.265x3 + 0.518x32 | |
| Hydrochloric (MW oven) | Glucose | < 0.005 | 0.739 | 0.621 | 0.569 | 0.185 | y = 3.562 + 0.636x2 + 0.895x22 - 0.642x3 - 0.856x32 - 2.149x1x3 |
| Xylose | > 0.005 | 0.564 | 0.303 | 3.73 | 0.004 | y = 7.835 - 1.662x1 - 1.178x22 - 1.795x3 - 1.101x32 - 1.546x1x2 - 1.408x1x3 | |
| Arabinose | < 0.005 | 0.634 | 0.468 | 0.136 | 0.686 | y = 1.127 - 0.218x1 - 0.222x3 - 0.137x32 + 0.235x1x2 + 0.089x1x3 | |
| Sulfuric | Glucose | < 0.005 | 0.829 | 0.752 | 1.091 | 0.349 | y = 6.971 + 1.002x1 - 1.720x12 + 0.790x22 + 2.003x32 + 0.941x1x3 |
| (MW oven) | Xylose | > 0.005 | 0.504 | 0.206 | 2.07 | 0.002 | y = 4.461 - 1.377x1 - 1.749x12 - 0.992x2 - 1.347x3 - 1.184x1x2 - 1.035x2x3 |
| Arabinose | > 0.005 | 0.438 | 0.181 | 0.17 | 0.001 | y = 0.786 - 0.205x1 + 0.137x12 - 0.111x3 + 0.146x1x + 0.181x2x3 |
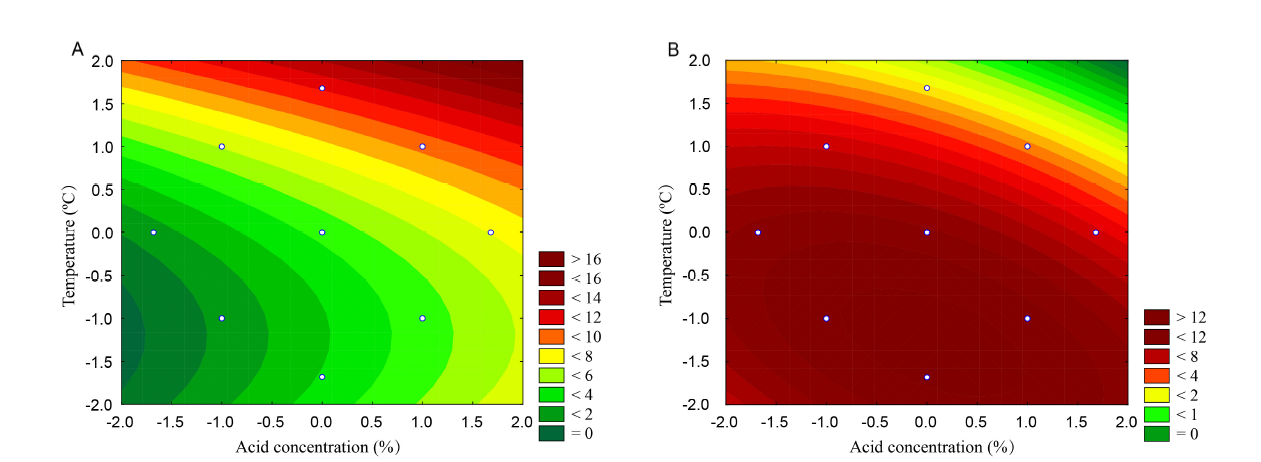
Fig. 3. Example of contour surfaces showing the optimal region of glucose production. A, Hydrolysis at a higher temperature and HCl concentration. B, Hydrolysis aiming for xylose production in a less severe optimal region.

Fig. 4. Scanning electron microscopy images for rice husks.A and B are natural and residual rice husks treated by pressurized acid hydrolysis with 1.5% H2SO4 (65 min, 135 ºC), respectively.
| Compound (g/L) | Untreated hydrolysate | Treated by active carbon | Treated by CaO | Treated by Ca(OH)2 |
|---|---|---|---|---|
| Glucose | 11.6 ± 0.4 | 10.7 ± 0.4 | 8.9 ± 0.4 | 10.4 ± 0.4 |
| Xylose | 2.3 ± 0.1 | 1.7 ± 0.1 | 1.2 ± 0.1 | 1.5 ± 0.1 |
| Arabinose | 0.7 ± 0.1 | 0.6 ± 0.1 | 0.5 ± 0.1 | 0.4 ± 0.1 |
| Fructose | - | - | - | - |
| Rhamnose | - | - | - | - |
| Formic acid | 1.9 ± 0.4 | 1.5 ± 0.4 | 1.5 ± 0.4 | 1.5 ± 0.4 |
| Acetic acid | 2.6 ± 0.3 | 1.8 ± 0.3 | 2.0 ± 0.3 | 1.9 ± 0.3 |
Table 7 Characterization of hydrolysates submitted to different detoxification processes.
| Compound (g/L) | Untreated hydrolysate | Treated by active carbon | Treated by CaO | Treated by Ca(OH)2 |
|---|---|---|---|---|
| Glucose | 11.6 ± 0.4 | 10.7 ± 0.4 | 8.9 ± 0.4 | 10.4 ± 0.4 |
| Xylose | 2.3 ± 0.1 | 1.7 ± 0.1 | 1.2 ± 0.1 | 1.5 ± 0.1 |
| Arabinose | 0.7 ± 0.1 | 0.6 ± 0.1 | 0.5 ± 0.1 | 0.4 ± 0.1 |
| Fructose | - | - | - | - |
| Rhamnose | - | - | - | - |
| Formic acid | 1.9 ± 0.4 | 1.5 ± 0.4 | 1.5 ± 0.4 | 1.5 ± 0.4 |
| Acetic acid | 2.6 ± 0.3 | 1.8 ± 0.3 | 2.0 ± 0.3 | 1.9 ± 0.3 |
| Agent | P-value | R² | Adjusted R² | Mean-square error | P value (lack of fit) | Polynomial equation a |
|---|---|---|---|---|---|---|
| Active carbon | < 0.005 | 0.999 | 0.996 | 0.2 | > 0.005 | y = 86.60 + 7.00x1 + 2.00x2 + 0.50x1x2 |
| CaO | < 0.005 | 0.83 | 0.698 | 4.05 | > 0.005 | y = 67.80 - 1.75x1 + 13.25x2 + 1.25x1x2 |
| Ca(OH)2 | < 0.005 | 0.781 | 0.65 | 0.45 | > 0.005 | y = 66.40 - 3.25x1 - 10.75x2 - 0.25x1x2 |
Table 8 Polynomial equations and model adjustment values for the rice husk hydrolysate detoxification by ANOVA analysis.
| Agent | P-value | R² | Adjusted R² | Mean-square error | P value (lack of fit) | Polynomial equation a |
|---|---|---|---|---|---|---|
| Active carbon | < 0.005 | 0.999 | 0.996 | 0.2 | > 0.005 | y = 86.60 + 7.00x1 + 2.00x2 + 0.50x1x2 |
| CaO | < 0.005 | 0.83 | 0.698 | 4.05 | > 0.005 | y = 67.80 - 1.75x1 + 13.25x2 + 1.25x1x2 |
| Ca(OH)2 | < 0.005 | 0.781 | 0.65 | 0.45 | > 0.005 | y = 66.40 - 3.25x1 - 10.75x2 - 0.25x1x2 |
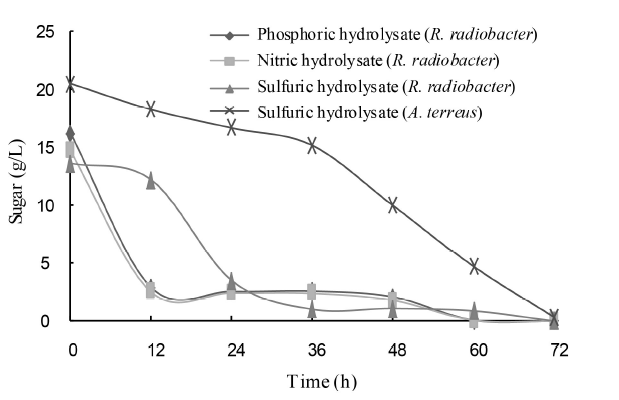
Fig. 5. Kinetics of sugar consumption (g/L) during A. terreus and R. radiobacter fermentation of the rice husk hydrolysates.
| [1] | Ang T N, Ngoh G C, Chua A S M.2013. Comparative study of various pretreatment reagents on rice husk and structural changes assessment of the optimized pretreated rice husk.Bioresource Technol, 135: 116-119. |
| [2] | Arefieva O D, Zemnukhova L A, Kovshun A A, Kovekhova A V.2017. Processing methods of alkaline hydrolysate from rice husk.Rice Sci, 24(4): 235-240. |
| [3] | Bakhtyiari M, Moosavi-Nasab M, Askari H.2015. Optimization of succinoglycan hydrocolloid production by Agrobacterium radiobacter grown in sugar beet molasses and investigation of its physicochemical characteristics. Food Hydrocolloid, 45: 18-29. |
| [4] | Balagurumurthy B, Singh R, Oza T S, Shiva Kumar K L N, Saran S, Bahuguna G M, Chauhan R K, Bhaskar T.2014. Effect of pressure and temperature on the hydropyrolysis of cotton residue.J Mater Cycles Waste Manag, 16: 442-448. |
| [5] | Bevilaqua D B, Rambo M K D, Rizzetti T M, Cardoso A L, Martins A F.2013. Cleaner production: Levulinic acid from rice husks.J Clean Prod, 47: 96-101. |
| [6] | Bevilaqua D B, Montipó S, Pedroso G B, Martins A F.2015. Sustainable succinic acid production from rice husks.Sustain Chem Pharm, 1: 9-13. |
| [7] | Boonterm M, Sunyadeth S, Dedpakdee S, Athichalinthorn P, Patcharaphun S, Mungkung R, Techapiesancharoenkij R.2016. Characterization and comparison of cellulose fiber extraction from rice straw by chemical treatment and thermal steam explosion.J Clean Prod, 134: 592-599. |
| [8] | Cheali P, Posada J A, Gernaey K Y, Sin G.2015. Upgrading of lignocellulosic biorefinery to value-added chemicals: Sustainability and economics of bioethanol-derivatives.Biomass Bioenerg, 75: 282-300. |
| [9] | Chen J Y, Zhang C, Li M L, Chen J M, Wang Y D, Zhou F F.2018. Microwave-enhanced sub-critical hydrolysis of rice straw to produce reducing sugar catalyzed by ionic liquid.J Mater Cycles Waste Manag, 20(2): 1364-1370. |
| [10] | Choi S, Song C W, Shin J H, Lee S Y.2015. Biorefineries for the production of top building block chemicals and their derivatives.Metab Eng, 28: 223-239. |
| [11] | CONAB (National Supply Company of Brazil). 2018. Crop Report 2017/2018. Brasilia: Brazil Agriculture Ministry. |
| [12] | Dagnino E P, Chamorro E R, Romano S D, Felissia F E, Area M C.2013. Optimization of the acid pretreatment of rice hulls to obtain fermentable sugars for bioethanol production.Ind Crop Prod, 42: 363-368. |
| [13] | de Vasconcelos S M, Santos A M P, Rocha G J M, Souto-Maior A M.2013. Diluted phosphoric acid pretreatment for production of fermentable sugars in a sugarcane-based biorefinery.Bioresource Technol, 135: 46-52. |
| [14] | Demirel F, Germeç M, Coban H B, Turhan I.2018. Optimization of dilute acid pretreatment of barley husk and oat husk and determination of their chemical composition.Cellulose, 25(11): 6377-6393. |
| [15] | Germeç M, Demirel F, Tas N, Ozcan A, Yilmazer C, Onuk Z, Turhan I.2017. Microwave-assisted dilute acid pretreatment of different agricultural bioresources for fermentable sugar production.Cellulose, 24(10): 4337-4353. |
| [16] | Heredia-Olea E, Pérez-Carrilho E, Serna-Saldívar S O.2012. Effects of different acid hydrolyses on the conversion of sweet sorghum bagasse into C5 and C6 sugars and yeast inhibitors using response surface methodology.Bioresour Technol, 119: 216-223. |
| [17] | INCQS (National Institute for Quality Assurance in Health). 2015. Reactivation guide for microorganisms as fungus and yeasts. São Paulo, Brazil. |
| [18] | INMETRO (National Institute of Metrology, Quality and Technology). 2017. Guidelines for calibration and other parameters. Brasilia: INMETRO. |
| [19] | Karimi K, Taherzadeh M J.2016. A critical review of analytical methods in pretreatment of lignocelluloses: Composition, imaging, and crystallinity.Bioresour Technol, 200: 1008-1018. |
| [20] | Kuenz A, Gallenmüller Y, Willke V, Vorlop K D.2012. Microbial production of itaconic acid: Developing a stable platform for high product concentrations.Appl Microbiol Biotechnol, 96(5): 1209-1216. |
| [21] | Kumari M, Asthir B.2016. Transformation of sucrose to starch and protein in rice leaves and grains under two establishment methods.Rice Sci, 23(5): 255-265. |
| [22] | Kundu C, Trinh L T P, Lee H J, Lee J W.2015. Bioethanol production from oxalic acid-pretreated biomass and hemicellulose- rich hydrolysates via a combined detoxification process.Fuel, 161: 129-136. |
| [23] | Lenihan P, Orozco A, O’Neill E, Ahmad M N M, Rooney D W, Walker G M.2010. Dilute acid hydrolysis of lignocellulosic biomass.Chem Eng J, 156(2): 395-403. |
| [24] | Loow Y L, Wu T Y, Jahim J M, Mohammad A W, Teoh W H.2016. Typical conversion of lignocellulosic biomass into reducing sugars using dilute acid hydrolysis and alkaline treatment.Cellulose, 23(3): 1491-1520. |
| [25] | Menon V, Rao M.2012. Trends in bioconversion of lignocellulose: Biofuels, platform chemicals and biorefinery concept.Prog Energy Comb Sci, 38(4): 522-550. |
| [26] | Ng L Y, Andiappan V, Chemmangattuvalappil N G, Ng D K S.2015. A systematic methodology for optimal mixture design in an integrated biorefinery.Comput Chem Eng, 81: 288-309. |
| [27] | Pedroso G B, Montipó S, Mario D A N, Alves S H, Martins A F.2017. Building block itaconic acid from left-over biomass.Biomass Conv Bioref, 7(1): 23-35. |
| [28] | Rabemanolontsoa H, Saka S.2016. Various pretreatments of lignocellulosics.Bioresour Technol, 199: 83-91. |
| [29] | Rambo M K D, Bevilaqua D B, Brenner C G B, Martins A F, Mario D N, Alves S H, Mallman C A, Martins A F,.2013. Xylitol from rice husks by acid hydrolysis and Candida yeast fermentation.Quim Nova, 36(5): 634-639. |
| [30] | Sluiter A, Hames B, Ruiz R, Scarlata C, Sluiter J, Templeton D.2005a. Determination of ash in biomass: Laboratory analytical procedures. National Renewable Laboratory, Technical Report NREL/TP-510-42622. |
| [31] | Sluiter A, Ruiz R, Scarlata C, Sluiter J, Templeton D.2005b. Determination of extractives in biomass: Laboratory analytical procedures. National Renewable Laboratory, Technical Report NREL/TP-510-42619. |
| [32] | Sluiter A, Hames B, Ruiz R, Scarlata C, Sluiter J, Templeton D, Crocker D.2008. Determination of structural carbohydrates and lignin in biomass: Laboratory analytical procedures. National Renewable Laboratory, Technical Report NREL/TP-510-42618. |
| [33] | Temiz E, Akpinar O.2017. The effect of severity factor on the release of xilose and phenolics from rice husk and rice straw.Waste Biomass Valor, 8: 505-516. |
| [34] | Timung R, Mohan M, Chilukoti B, Sasmal S, Banerjee T, Goud V V.2015. Optimization of dilute acid and hot water pretreatment of different lignocellulosic biomass: A comparative study.Biomass Bioenery, 81: 9-18. |
| [1] | Jiratchaya Wisetkomolmat, Chaiwat Arjin, Surat Hongsibsong, Warintorn Ruksiriwanich, Chutamat Niwat, Pimsiri Tiyayon, Sansanee Jamjod, Supapohn Yamuangmorn, Chanakan Prom-U-Thai, Korawan Sringarm. Antioxidant Activities and Characterization of Polyphenols from Selected Northern Thai Rice Husks: Relation with Seed Attributes [J]. Rice Science, 2023, 30(2): 148-159. |
| [2] | Asadi Hossein, Ghorbani Mohammad, Rezaei-Rashti Mehran, Abrishamkesh Sepideh, Amirahmadi Elnaz, Chengrong Chen, Gorji Manouchehr. Application of Rice Husk Biochar for Achieving Sustainable Agriculture and Environment [J]. Rice Science, 2021, 28(4): 325-343. |
| [3] | Zhaowei Li, Qian Zhao, Fangmin Cheng. Sugar Starvation Enhances Leaf Senescence and Genes Involved in Sugar Signaling Pathways Regulate Early Leaf Senescence in Mutant Rice [J]. Rice Science, 2020, 27(3): 201-214. |
| [4] | Yaliang Wang, Yikai Zhang, Qinghua Shi, Huizhe Chen, Jing Xiang, Guohui Hu, Yanhua Chen, Xiaodan Wang, Junke Wang, Zihao Yi, Defeng Zhu, Yuping Zhang. Decrement of Sugar Consumption in Rice Young Panicle Under High Temperature Aggravates Spikelet Number Reduction [J]. Rice Science, 2020, 27(1): 44-55. |
| [5] | Kumari Manisha, Asthir Bavita. Transformation of Sucrose to Starch and Protein in Rice Leaves and Grains under Two Establishment Methods [J]. Rice Science, 2016, 23(5): 255-265. |
| [6] | Md. Nasim ALI, Bhaswati GHOSH, Saikat GANTAIT, Somsubhra CHAKRABORTY. Selection of Rice Genotypes for Salinity Tolerance Through Morpho-Biochemical Assessment [J]. RICE SCIENCE, 2014, 21(5): 288-298. |
| Viewed | ||||||
|
Full text |
|
|||||
|
Abstract |
|
|||||