Rice Science ›› 2025, Vol. 32 ›› Issue (6): 857-867.DOI: 10.1016/j.rsci.2025.08.007
• Research Papers • Previous Articles Next Articles
Nairiane dos Santos Bilhalva1, Paulo Carteri Coradi2( ), Rosana Santos de Moraes1, Dthenifer Cordeiro Santana2, Larissa Ribeiro Teodoro2, Paulo Eduardo Teodoro2, Marisa Menezes Leal1
Received:2025-05-15
Accepted:2025-08-13
Online:2025-11-28
Published:2025-12-04
Contact:
Paulo Carteri Coradi (Nairiane dos Santos Bilhalva, Paulo Carteri Coradi, Rosana Santos de Moraes, Dthenifer Cordeiro Santana, Larissa Ribeiro Teodoro, Paulo Eduardo Teodoro, Marisa Menezes Leal. Physical and Physicochemical Classification of Parboiled Rice Using VNIR-SWIR Spectroscopy and Machine Learning[J]. Rice Science, 2025, 32(6): 857-867.
Add to citation manager EndNote|Ris|BibTeX
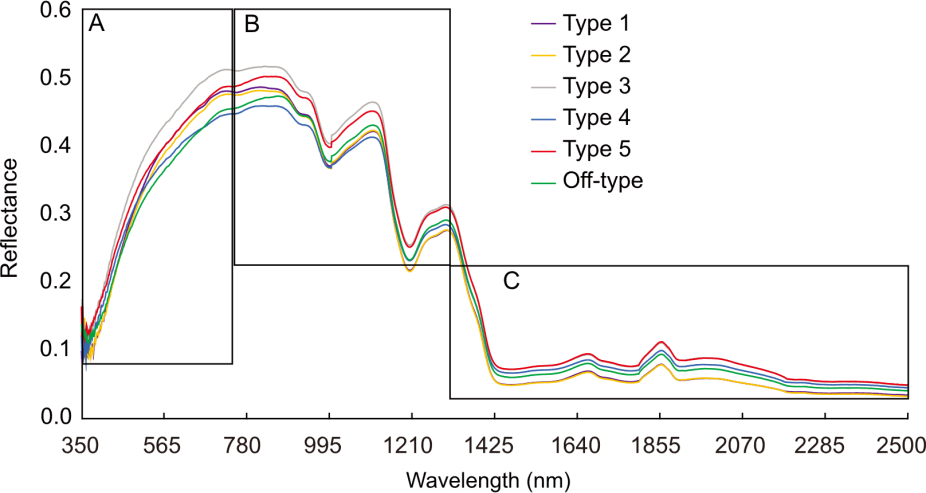
Fig. 1. Hyperspectral curve from Types 1-5 and Off-type of parboiled rice. A, Visible region (350-750 nm). B, Near-infrared region (750-1300 nm). C, Shortwave-infrared region (1300-1500 nm).
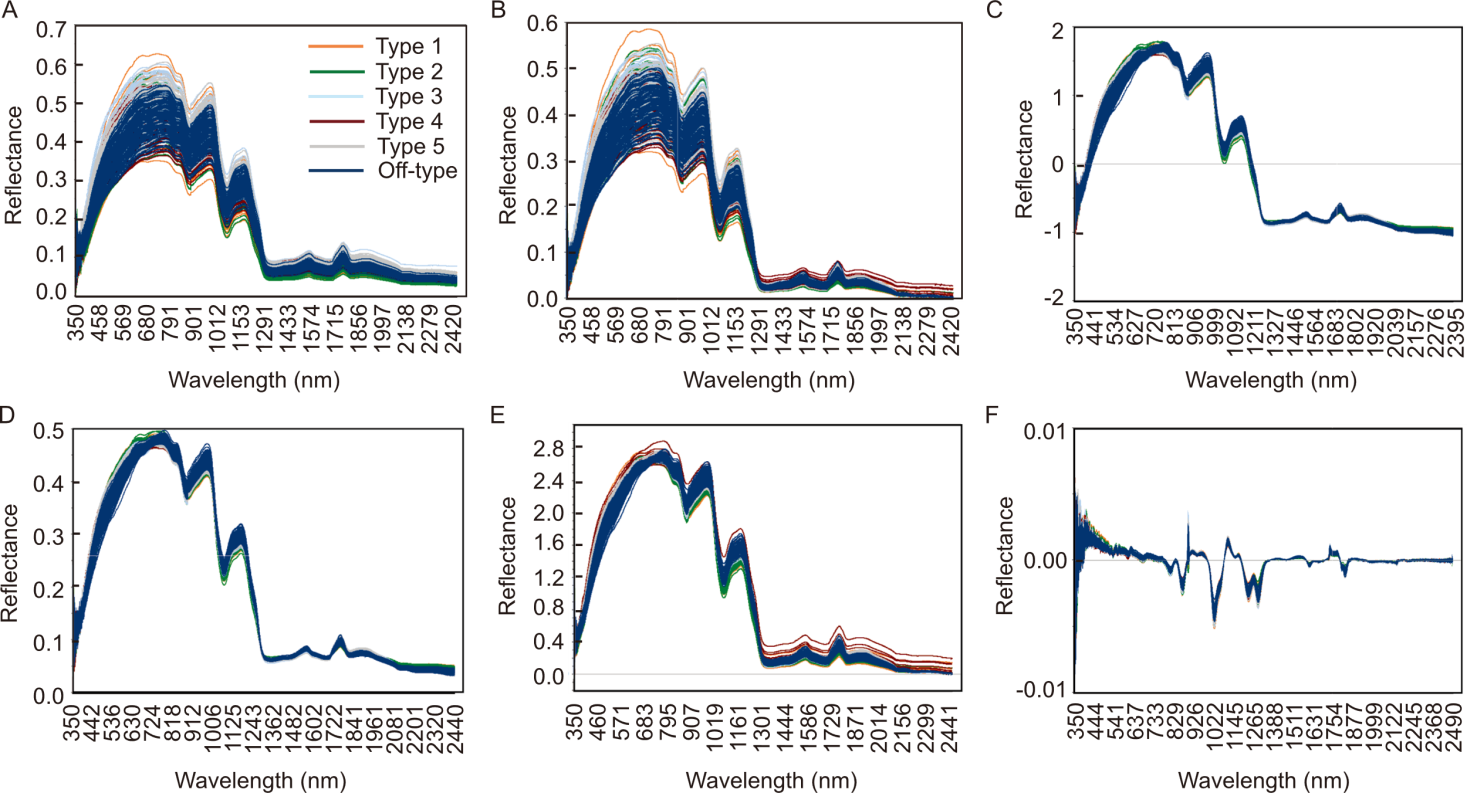
Fig. 2. Reflectance spectra of rice samples after preprocessing steps. A, Raw reflectance spectra; B, Spectra after baseline correction; C, Standard normal variate (SNV) transformation; D, Multiplicative scatter correction (MSC); E, Combined preprocessing (SNV and MSC) using Savitzky-Golay smoothing; F, First derivative spectra after Savitzky-Golay smoothing. These transformations progressively reduce noise and scattering effects, enhancing spectral differences among rice types.
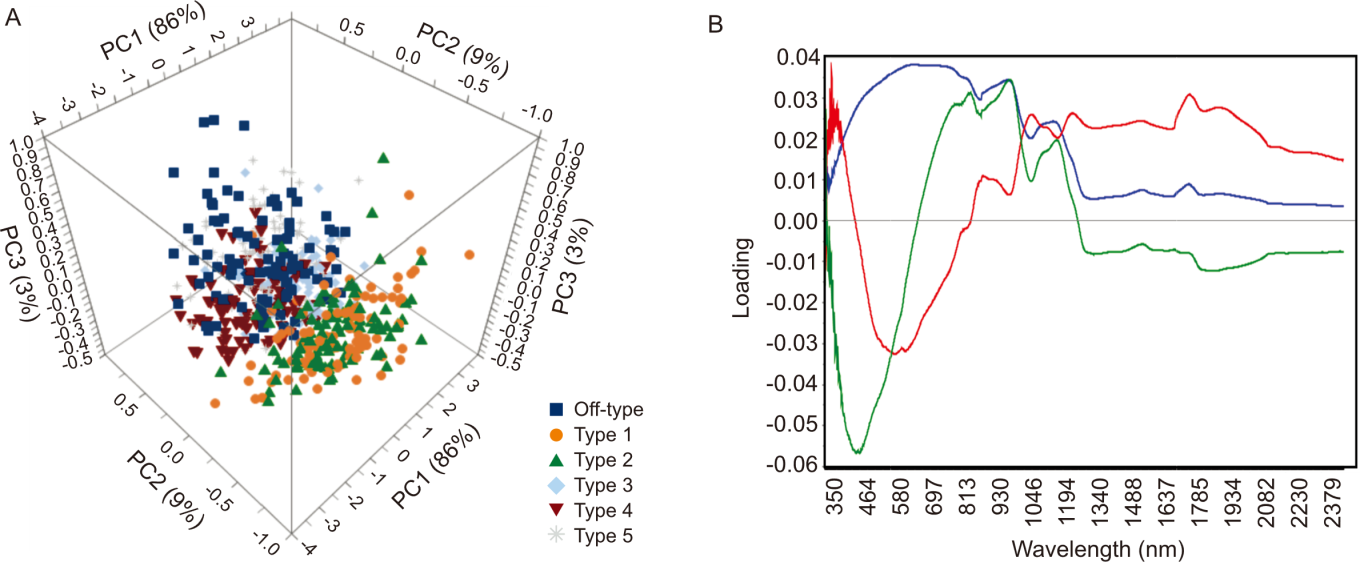
Fig. 3. Principal component analysis (PCA) for parboiled rice samples. A, Score plots for the first three principal components of all parboiled rice sample; B, PCA loading plot of spectral data without preprocessing.
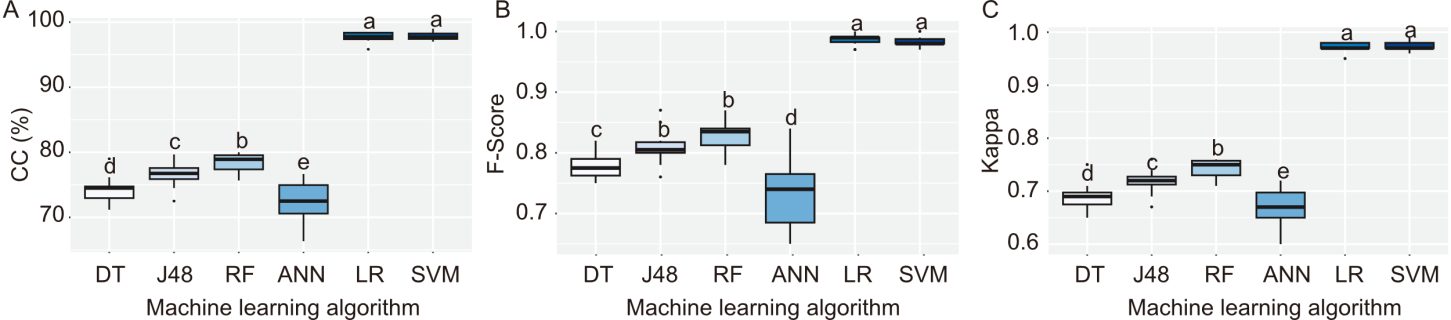
Fig. 4. Boxplots showing distribution of performance metrics across different machine learning algorithms. A, Correlation coefficient (CC). B, F-score. C, Kappa between machine learning algorithms. DT, Decision Tree; J48, J48 Decision Tree algorithm; RF, Random Forest; ANN, Artificial Neural Network; LR, Logistic Regression; SVM, Support Vector Machine. Different lowercase letters above bars represent significant differences at the 0.05 level by the Scott-Knott test.
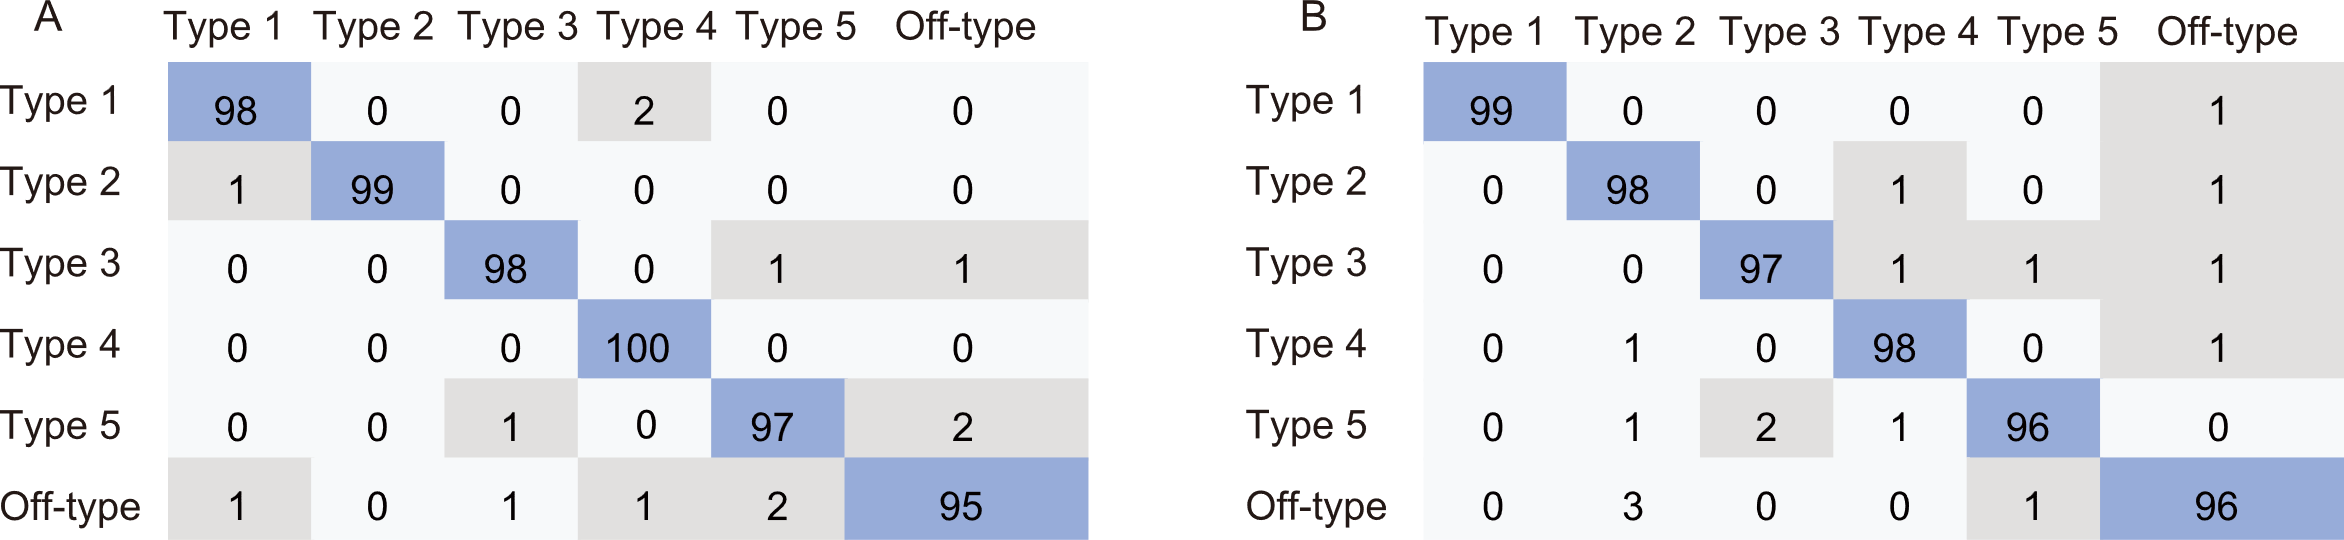
Fig. 5. Confusion matrices showing classification accuracy for parboiled rice types using Support Vector Machine (SVM, A) and Logistic Regression algorithms (B). Data show the percentage (%) of correct classifications obtained for each type.
| Preprocessing | Linear kernel | Radial kernel | Polynomial kernel | |||||
|---|---|---|---|---|---|---|---|---|
| Training | Internal validation | Training | Internal validation | Training | Internal validation | |||
| No preprocessing | 1.000 | 0.971 | 1.000 | 0.895 | 1.000 | 0.964 | ||
| Baseline offset correction (BL) | 1.000 | 0.980 | 1.000 | 0.915 | 0.997 | 0.973 | ||
| Standard normal variate (SNV) | 1.000 | 0.982 | 1.000 | 0.933 | 1.000 | 0.982 | ||
| Multiplicative scatter correction | 1.000 | 0.977 | 1.000 | 0.931 | 1.000 | 0.975 | ||
| SNV + BL + Savitzky-Golay smoothing | 1.000 | 0.975 | 1.000 | 0.928 | 1.000 | 0.977 | ||
| First derivative of Savitzky-Golay | 1.000 | 0.993 | 1.000 | 0.960 | 1.000 | 0.991 | ||
Table 1. Correct classification rates among kernel functions and preprocessing methods obtained for training set (450 samples) and internal validation using Support Vector Machine algorithm.
| Preprocessing | Linear kernel | Radial kernel | Polynomial kernel | |||||
|---|---|---|---|---|---|---|---|---|
| Training | Internal validation | Training | Internal validation | Training | Internal validation | |||
| No preprocessing | 1.000 | 0.971 | 1.000 | 0.895 | 1.000 | 0.964 | ||
| Baseline offset correction (BL) | 1.000 | 0.980 | 1.000 | 0.915 | 0.997 | 0.973 | ||
| Standard normal variate (SNV) | 1.000 | 0.982 | 1.000 | 0.933 | 1.000 | 0.982 | ||
| Multiplicative scatter correction | 1.000 | 0.977 | 1.000 | 0.931 | 1.000 | 0.975 | ||
| SNV + BL + Savitzky-Golay smoothing | 1.000 | 0.975 | 1.000 | 0.928 | 1.000 | 0.977 | ||
| First derivative of Savitzky-Golay | 1.000 | 0.993 | 1.000 | 0.960 | 1.000 | 0.991 | ||
| Preprocessing | Kernel function | ||
|---|---|---|---|
| Linear | Radial | Polynomial | |
| No preprocessing | 0.993 | 0.959 | 0.986 |
| Baseline offset correction (BL) | 0.986 | 0.953 | 0.986 |
| Standard normal variate (SNV) | 0.986 | 0.973 | 0.979 |
| Multiplicative scatter correction | 0.986 | 0.979 | 0.986 |
| SNV + BL + Savitzky-Golay smoothing | 0.986 | 0.986 | 0.979 |
| First derivative of Savitzky-Golay | 0.228 | 0.174 | 0.174 |
Table 2. Correct classification rate among kernel functions and preprocessing methods obtained for external validation set (149 samples) using Support Vector Machine algorithm.
| Preprocessing | Kernel function | ||
|---|---|---|---|
| Linear | Radial | Polynomial | |
| No preprocessing | 0.993 | 0.959 | 0.986 |
| Baseline offset correction (BL) | 0.986 | 0.953 | 0.986 |
| Standard normal variate (SNV) | 0.986 | 0.973 | 0.979 |
| Multiplicative scatter correction | 0.986 | 0.979 | 0.986 |
| SNV + BL + Savitzky-Golay smoothing | 0.986 | 0.986 | 0.979 |
| First derivative of Savitzky-Golay | 0.228 | 0.174 | 0.174 |
| [1] | Al Snousy M B, El-Deeb H M, Badran K, et al. 2011. Suite of decision tree-based classification algorithms on cancer gene expression data. Egypt Inform J, 12(2): 73-82. |
| [2] | Aznan A, Viejo C G, Pang A, et al. 2023. Review of technology advances to assess rice quality traits and consumer perception. Food Res Int, 172: 113105. |
| [3] | Bagchi T B, Das B, Kumar A, et al. 2023. Impact of cooking, parboiling and fermentation on nutritional components, predicted glycemic index and pasting properties of rice. J Cereal Sci, 114: 103763. |
| [4] | Belgiu M, Drăguţ L. 2016. Random forest in remote sensing: A review of applications and future directions. ISPRS J Photogramm Remote Sens, 114: 24-31. |
| [5] | Bouckaert R R, Frank E, Hall M A, et al. 2010. WEKA: Experiences with a Java open-source project. J Mach Learn Res, 11: 2533-2541. |
| [6] | Cañizares L, Meza S, Peres B, et al. 2024. Functional foods from black rice (Oryza sativa L.): An overview of the influence of drying, storage, and processing on bioactive molecules and health-promoting effects. Foods, 13(7): 1088. |
| [7] | Çifci A, Kırbaş İ. 2025. Fusion of machine learning and explainable AI for enhanced rice classification: A case study on Cammeo and Osmancik species. Eur Food Res Technol, 251(1): 69-86. |
| [8] | Coradi P C, Müller A, da Silva André G, et al. 2021. Effects of cultivars and fertilization levels on the quality of brown and polished rice. Cereal Chem, 98(6): 1238-1249. |
| [9] | de Gregori G S, Loureiro E S, Pessoa L G A, et al. 2023. Machine learning in the hyperspectral classification of Glycaspis brimblecombei (Hemiptera: Psyllidae) attack severity in eucalyptus. Remote Sens, 15(24): 5657. |
| [10] | de Moraes R S, Coradi P C, Nunes M T, et al. 2023. Thick layer drying and storage of rice grain cultivars in silo-dryer-aerator: Quality evaluation at low drying temperature. Heliyon, 9(7): e17962. |
| [11] | Deepika S, Sutar P P. 2024. Spectral selective infrared heating of food components based on optical characteristics and penetration depth: A critical review. Crit Rev Food Sci Nutr, 64(29): 10749-10771. |
| [12] | Egmont-Petersen M, de Ridder D, Handels H. 2002. Image processing with neural networks: A review. Pattern Recognit, 35(10): 2279-2301. |
| [13] | Elmas Ş N K, Arslan F N, Akin G, et al. 2019. Synchronous fluorescence spectroscopy combined with chemometrics for rapid assessment of cold-pressed grape seed oil adulteration: Qualitative and quantitative study. Talanta, 196: 22-31. |
| [14] | Fattahi S H, Kazemi A, Khojastehnazhand M, et al. 2024. The classification of Iranian wheat flour varieties using FT-MIR spectroscopy and chemometrics methods. Expert Syst Appl, 239: 122175. |
| [15] | Ferreira D F. 2011. Sisvar: A computer statistical analysis system. Ciênc Agrotec, 35(6): 1039-1042. |
| [16] | Hao Y, Geng P, Wu W H, et al. 2019. Identification of rice varieties and transgenic characteristics based on near-infrared diffuse reflectance spectroscopy and chemometrics. Molecules, 24(24): 4568. |
| [17] | Hosseini S, Sardo S R. 2021. Data mining tool: A case study for network intrusion detection. Multimed Tools Appl, 80: 4999-5019. |
| [18] | Hu N Y, Li W, Du C H, et al. 2021. Predicting micronutrients of wheat using hyperspectral imaging. Food Chem, 343: 128473. |
| [19] | Iqbal S, Zhang P, Wu P, et al. 2021. Evolutions of rheology, microstructure and digestibility of parboiled rice during simulated semi-dynamic gastrointestinal digestion. LWT, 148: 111700. |
| [20] | Jin B, Zhang C, Jia L, et al. 2022. Identification of rice seed varieties based on near-infrared hyperspectral imaging technology combined with deep learning. ACS Omega, 7(6): 4735-4749. |
| [21] | Kumar A, Lal M K, Nayak S, et al. 2022. Effect of parboiling on starch digestibility and mineral bioavailability in rice (Oryza sativa L.). LWT, 156: 113026. |
| [22] | Leal A F, Coradi P C, dos Santos Moraes R, et al. 2023. Tempering time and air temperature relationships for real-scale paddy drying and their effects on the physical, physicochemical, and morphological qualities of polished rice. Dry Technol, 41(11): 1878-1892. |
| [23] | Lutz É, Coradi P C. 2022. Applications of new technologies for monitoring and predicting grains quality stored: Sensors, internet of things, and artificial intelligence. Measurement, 188: 110609. |
| [24] | Maldaner V, Coradi P C, Nunes M T, et al. 2021. Effects of intermittent drying on physicochemical and morphological quality of rice and endosperm of milled brown rice. LWT, 152: 112334. |
| [25] | Miao X X, Miao Y, Tao S H, et al. 2021. Classification of rice based on storage time by using near infrared spectroscopy and chemometric methods. Microchem J, 171: 106841. |
| [26] | Müller A, Nunes M T, Maldaner V, et al. 2022. Rice drying, storage and processing: Effects of post-harvest operations on grain quality. Rice Sci, 29(1): 16-30. |
| [27] | Nalepa J, Kawulok M. 2019. Selecting training sets for support vector machines: A review. Artif Intell Ver, 52(2): 857-900. |
| [28] | Nikzadfar M, Rashvand M, Zhang H W, et al. 2024. Hyperspectral imaging aiding artificial intelligence: A reliable approach for food qualification and safety. Appl Sci: Basel, 14(21): 9821. |
| [29] | Patel D, Bhise S, Kapdi S, et al. 2024. Non-destructive hyperspectral imaging technology to assess the quality and safety of food: A review. Food Prod Process Nutr, 6(1): 69. |
| [30] | Quinlan J R. 1993. C4.5: Programs for Machine Learning. CA, USA: Morgan Kauffmann Publishers Inc: 302. |
| [31] | Rajvanshi N, Chowdhary K R. 2017. Comparison of SVM and naïve Bayes text classification algorithms using WEKA. Int J Eng Res Technol, 6(9): 141-143. |
| [32] | Rodrigues L A, Cañizares L D C C, Meza S L R, et al. 2024. A review of the influence of genotype, environment, and food processing on the bioactive compound profile of red rice (Oryza sativa L.). Agronomy: Basel, 14(3): 616. |
| [33] | Santana D C, Cotrim M F, Flores M S, et al. 2021. UAV-based multispectral sensor to measure variations in corn as a function of nitrogen topdressing. Remote Sens Appl: Soci Environ, 23:100534. |
| [34] | Sarker I H. 2021. Machine learning: Algorithms, real-world applications and research directions. SN Comput Sci, 2(3): 160. |
| [35] | Štepanovský M, Ibrová A, Buk Z, et al. 2017. Novel age estimation model based on development of permanent teeth compared with classical approach and other modern data mining methods. Forensic Sci Int, 279: 72-82. |
| [36] | Taleon V, Gallego S, Orozco J C, et al. 2020. Retention of Zn, Fe and phytic acid in parboiled biofortified and non-biofortified rice. Food Chem X, 8: 100105. |
| [37] | Wang L S, Wang W S, Huang Z L, et al. 2024. Discrimination of internal crack for rice seeds using near infrared spectroscopy. Spectrochim Acta Part A: Mol Biomol Spectrosc, 319: 124578. |
| [38] | Wu K, Zhang Z L, He X H, et al. 2025. Using visible and NIR hyperspectral imaging and machine learning for nondestructive detection of nutrient contents in sorghum. Sci Rep, 15(1): 6067. |
| [39] | Zhang L, Sun H, Li H, et al. 2021. Identification of rice-weevil (Sitophilus oryzae L.) damaged wheat kernels using multi-angle NIR hyperspectral data. J Cereal Sci, 101: 103313. |
| [1] | Sheikh Faruk Ahmed, Hayat Ullah, May Zun Aung, Rujira Tisarum, Suriyan Cha-Um, Avishek Datta. Iron Toxicity Tolerance of Rice Genotypes in Relation to Growth, Yield and Physiochemical Characters [J]. Rice Science, 2023, 30(4): 321-334. |
| [2] | Saleethong Paweena, Roytrakul Sittiruk, Kong-Ngern Kanlaya, Theerakulpisut Piyada. Differential Proteins Expressed in Rice Leaves and Grains in Response to Salinity and Exogenous Spermidine Treatments [J]. Rice Science, 2016, 23(1): 9-21. |
| [3] | Hong-wei Zhang, Yu-yu Chen, Jun-yu Chen, Yu-jun Zhu, De-run Huang, Ye-yang Fan, Jie-yun Zhuang. Mapping of qTGW1.1, a Quantitative Trait Locus for 1000-Grain Weight in Rice (Oryza sativa L.) [J]. Rice Science, 2015, 22(1): 9-15. |
| [4] | Seyyed Ali Noorhosseini Niyaki1, Mohammad Sadegh Allahyari2. Logistic Regression Analysis on Factors Affecting Adoption of Rice-Fish Farming in North Iran [J]. RICE SCIENCE, 2012, 19(2): 153-160. |
| Viewed | ||||||
|
Full text |
|
|||||
|
Abstract |
|
|||||