Rice Science ›› 2021, Vol. 28 ›› Issue (3): 289-300.DOI: 10.1016/j.rsci.2021.04.007
• Research Paper • Previous Articles Next Articles
Panigrahy Madhusmita1,2( ), Das Subhashree1, Poli Yugandhar3, Kumar Sahoo Pratap4,5, Kumari Khushbu6, C. S. Panigrahi Kishore1,5()
Received:2020-04-14
Accepted:2020-08-18
Online:2021-05-28
Published:2021-05-28
Panigrahy Madhusmita, Das Subhashree, Poli Yugandhar, Kumar Sahoo Pratap, Kumari Khushbu, C. S. Panigrahi Kishore. Carbon Nanoparticle Exerts Positive Growth Effects with Increase in Productivity by Down-Regulating Phytochrome B and Enhancing Internal Temperature in Rice[J]. Rice Science, 2021, 28(3): 289-300.
Add to citation manager EndNote|Ris|BibTeX
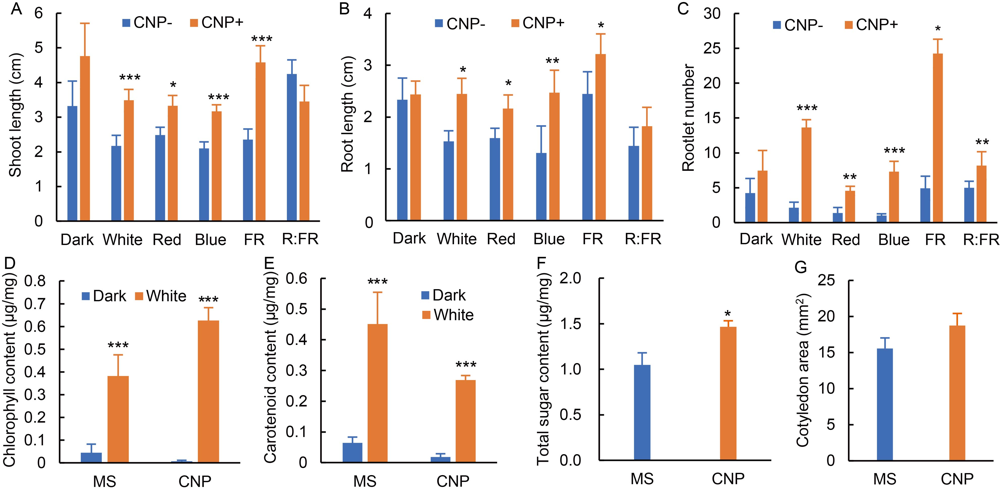
Fig. 1. Effects of carbon nanoparticle (CNP) on seedling growth. Seedlings were grown either in darkness or irradiated with white light or different sources of monochromatic light [red (R), far-red (FR) and blue] or low R:FR on Murashige and Skoog (MS) medium with or without CNP (500 μg/mL) for 7 d. Low R:FR (R:FR = 0.06) was used to observe the effect of shade avoidance response. On the 8th day, seedling growth parameters such as shoot length (A), root length (B), rootlet number (C), total chlorophyll content (D), total carotenoid content (E), total sugar content (F) and cotyledon area (G) were measured. All data presented were from minimum 60 seedlings with 20 seedlings in each experiment. Total sugar content (F) was estimated from 50 mg shoot tissue without or with CNP treatment. Experiments were repeated for at least three independent experiments. Significances of values were obtained from one-way ANOVA using the Turkey’s multiple comparison in the Prism version 7.0 software, and were represented as *, P ≤ 0.05, **, P ≤ 0.01 and ***, P ≤ 0.001.
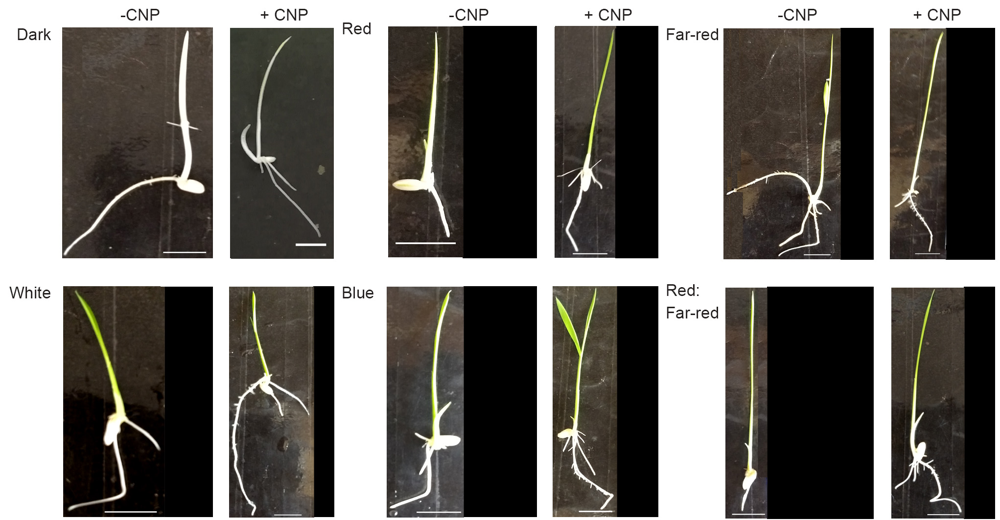
Fig. S1. Seedling phenotype after CNP treatment. Seedlings were grown for 7-day-old seedlings on MS medium with or without CNP (500 μg/mL) in darkness or under white light or under different monochromatic sources of light or low red:far-red. On the 8 d, seedlings were photographed. Scale Bars, 1 cm.
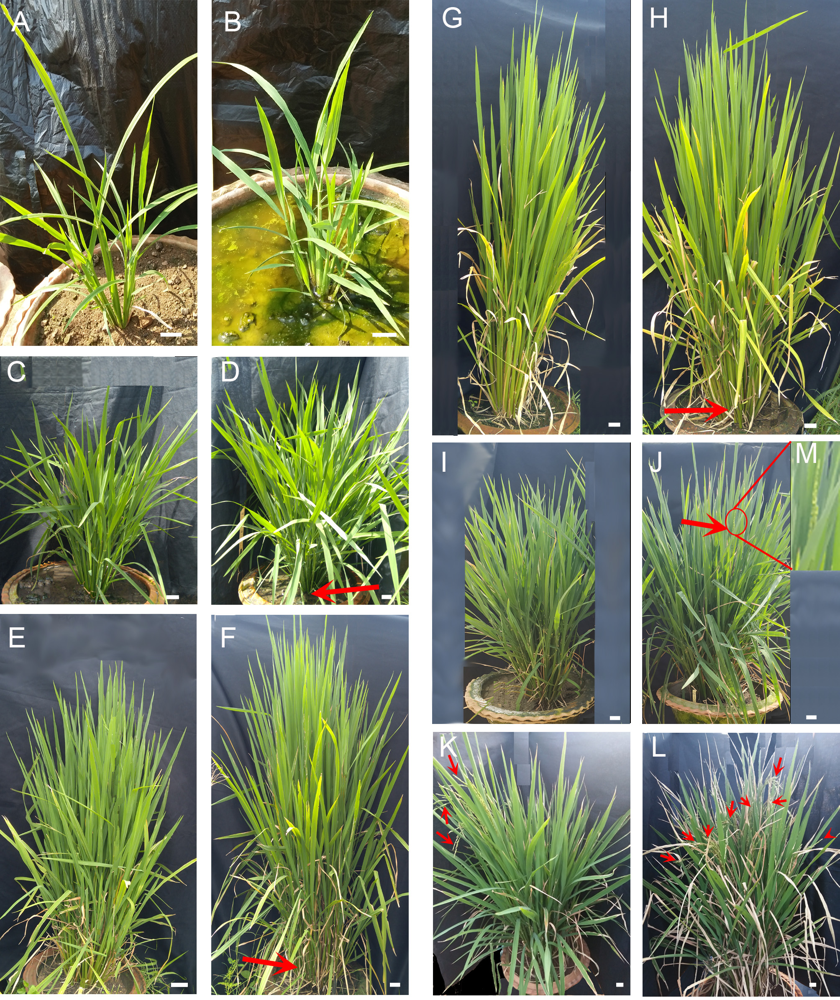
Fig. 2. Effects of carbon nanoparticle (CNP) treatment on rice plant phenotype and flowering.A, C, E, G, I and K represent the control plants, and B, D, F, H, J and L represent the CNP-treated plants. A and B, Plants on the 45 d after sowing (DAS) (1st CNP treatment).C and D, Plants on the 60 DAS (2nd CNP treatment).E and F, Plants on the 75 DAS (3rd CNP treatment).G and H, Plants on the 90 DAS (4th CNP treatment).I and J, Showing early flowering in CNP-treated plants on about 120 DAS (flowering indicated with red arrow, panicle showed in red circle, and panicle portion enlarged in M).K and L, Showing flowering in control plants on 127 DAS (flowering indicated with red arrows). Scale bars, 2.5 cm.
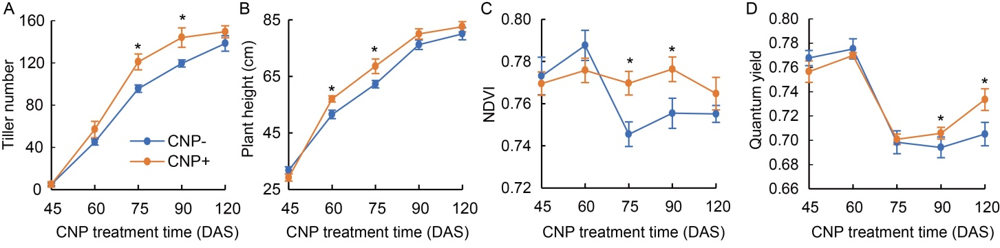
Fig. 3. Effects of carbon nanoparticle (CNP) treatment on plant growth. Plant growth phenotypes such as total tiller number (A), plant height (B), normalized difference vegetation index (NDVI) (C) and quantum yield (D) were recorded on the day of each CNP treatment. DAS, Days after sowing.Data were the mean of 60 plants (15?20 plants from each category in 3 seasons). Significant data points were marked with * at P ≤ 0.05. Test of significance was done using one-way ANOVA with the Turkey’s multiple comparison in the Prism version 7.0 software.
| Trait | Control | CNP-treated |
|---|---|---|
| No. of productive tillers per plant | 39.3 ± 11.4 a | 49.5 ± 11.3 b |
| Days-to-flowering (d) | 127.0 ± 2.0 a | 122.5 ± 2.0 b |
| Panicle length (cm) | 23.3 ± 1.1 a | 24.3 ± 1.1 b |
| Flag leaf length (cm) | 25.8 ± 2.1 a | 29.6 ± 1.9 b |
| 100-grain weight (g) | 1.17 ± 0.02 a | 1.25 ± 0.07 b |
| Filled grain rate (%) | 8.21 ± 4.88 a | 16.15 ± 2.33 b |
| Dry biomass matter (g) | 139.50 ± 6.55 a | 136.31 ± 6.73 b |
| Root dry weight (g) | 36.97 ± 13.03 a | 60.21 ± 0.27 b |
| Yield per plant (g) | 42.11 ± 1.47 a | 52.08 ± 3.93 b |
Table 1 Effects of carbon nanoparticle (CNP) treatment on yield and related attributes.
| Trait | Control | CNP-treated |
|---|---|---|
| No. of productive tillers per plant | 39.3 ± 11.4 a | 49.5 ± 11.3 b |
| Days-to-flowering (d) | 127.0 ± 2.0 a | 122.5 ± 2.0 b |
| Panicle length (cm) | 23.3 ± 1.1 a | 24.3 ± 1.1 b |
| Flag leaf length (cm) | 25.8 ± 2.1 a | 29.6 ± 1.9 b |
| 100-grain weight (g) | 1.17 ± 0.02 a | 1.25 ± 0.07 b |
| Filled grain rate (%) | 8.21 ± 4.88 a | 16.15 ± 2.33 b |
| Dry biomass matter (g) | 139.50 ± 6.55 a | 136.31 ± 6.73 b |
| Root dry weight (g) | 36.97 ± 13.03 a | 60.21 ± 0.27 b |
| Yield per plant (g) | 42.11 ± 1.47 a | 52.08 ± 3.93 b |
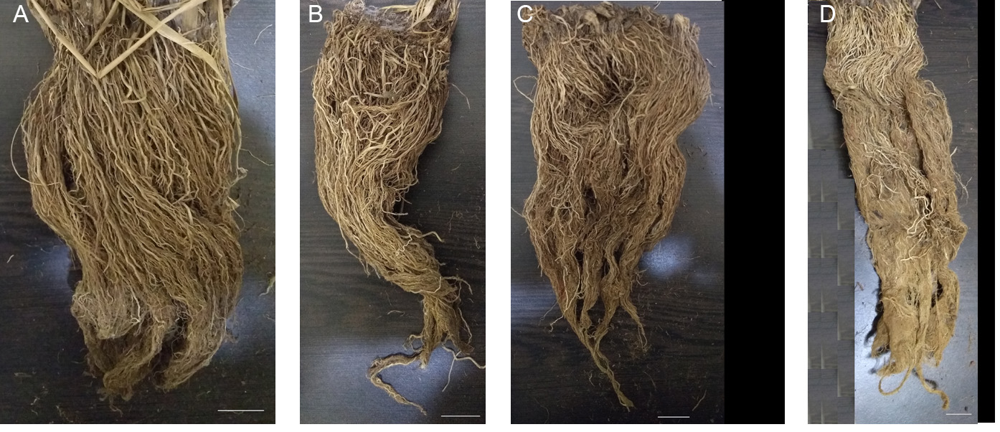
Fig. S2. Effects of CNP treatment on root biomass. Roots of mature plants were recovered from pots after seed harvesting. The soil associated was gently removed by washing with plentiful of water followed by drying at 50 ºC for 3 d.. Roots of control plants without CNP treatment (A and B) or plants with CNP treatment (C and D). Scale Bars, 1 cm.
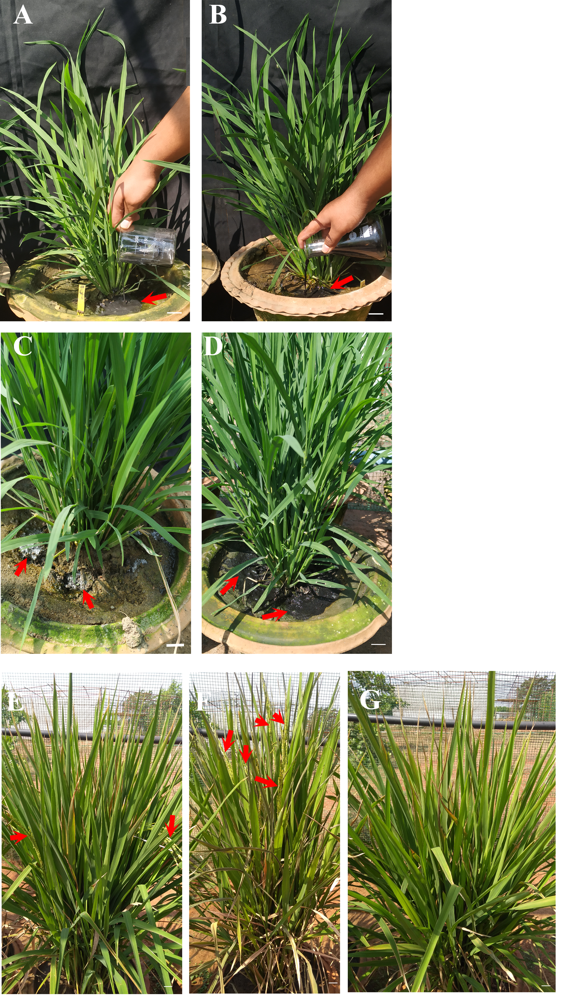
Fig. S3. Demonstration of carbon nanoparticle (CNP) and charcoal treatment. A and C, CNP-treated plants. B and D, Charcoal-treated plant.E?G, Control (E), CNP-treated (F) and charcoal treated plants (G) on 127 d after sowing. CNP- treated plants showing a greater number of panicles (red arrows) indicate early (3?5 d) flowering (F) than control (E) and charcoal- treated plants (G). Scale Bars, 1 cm. CNP or activated charcoal solutions prepared in water at 500 µg/mL were applied near the plant roots by pouring them on small holes made in the pot soil. A and B are photographs taken during the treatment, and C and D are plants just after treatment. Red arrows indicate the holes made in pot soil.
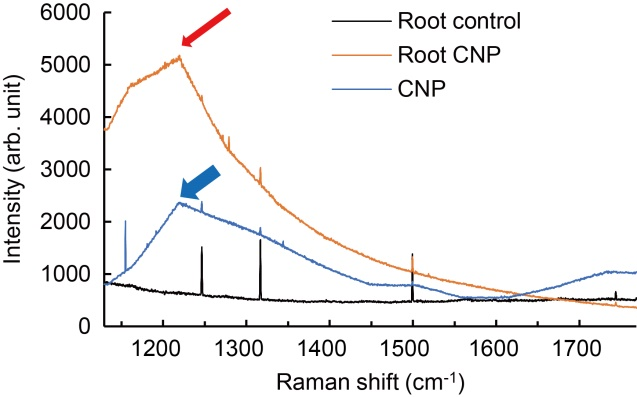
Fig. 4. Raman spectroscopic analysis of carbon nanoparticle (CNP) accumulation. Roots (1 g) of rice plants on 75 d after sowing were processed for Raman spectroscopy. CNP alone in solvent di-methyl formamide (DMF) showed a peak at 1 225 cm-1 (blue arrow). Roots from control plants showed no distinct peak, whereas roots from CNP-treated plants showed Raman spectra which had nearly 2-fold higher intensity with peak at the same wave number (red arrow) as that of the CNP alone. The observation of distinct peak in the root samples of CNP-treated plants was statistically significant at P ≤ 0.05.
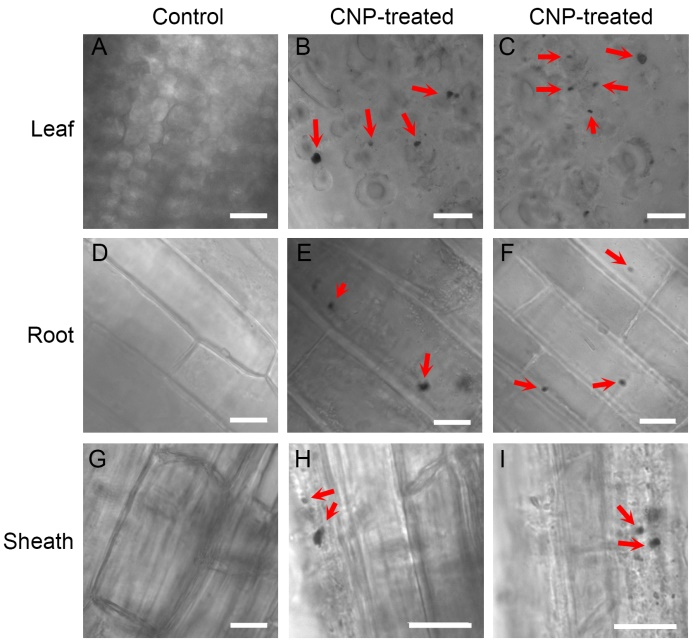
Fig. 5. Visualization of carbon nanoparticle (CNP) aggregated inside plant tissue. A, D and G, Sections of leaf, root and sheath from the control plants after the 3rd CNP treatment, respectively.B, C, E, F, H and I, Sections of leaf (B and C), root (E and F) and sheath (H and I) from the CNP-treated plants after the 3rd CNP treatment, respectively.Red arrows indicate the CNP aggregates. Scale bars, 10 μm.
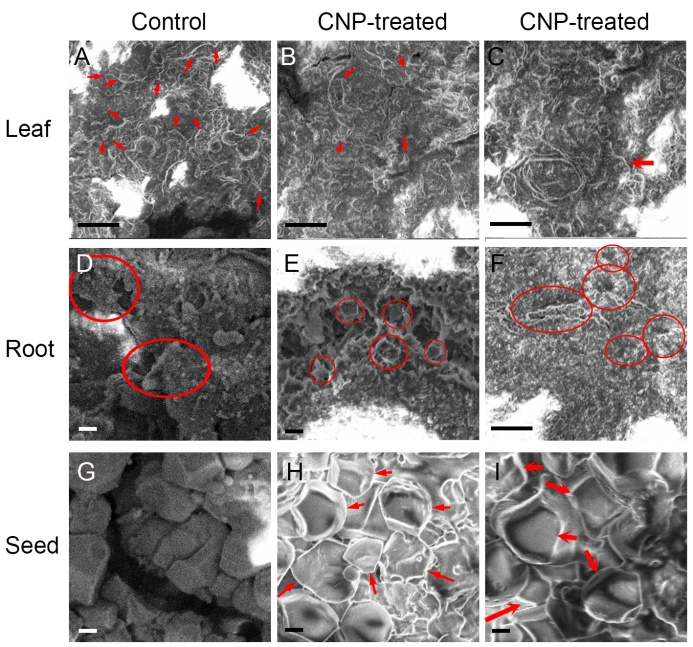
Fig. 6. Visualization of structure of rice plant parts treated with carbon nanoparticle (CNP) using a scanning electron microscopy. A?C, Extracts from rice leaves at 75 d after sowing with or without CNP treatment. Red arrows indicate projection like structures. Scale bars, 10 μm.D?F, Extracts from rice roots at 75 d after sowing with or without CNP treatment. Red circles indicate grooved impressions. Scale bars are 2 μm in D and E, and 10 μm in F.G?I, Extracts from rice seeds at 75 d after sowing with or without CNP treatment. Red arrows indicate more structured shapes. Scale bars, 2 μm.
| Trait | Control | CNP-treated |
|---|---|---|
| Hulling rate (%) | 80.60 ± 0.11 a | 93.31 ± 0.12 b |
| Milling rate (%) | 52.62 ± 0.11 a | 63.95 ± 0.58 b |
| Head rice recovery (%) | 44.05 ± 0.51 a | 52.06 ± 0.43 b |
| Gelatinization temperature (ºC) | 72.00 ± 2.00 a | 72.00 ± 2.00 a |
| Gel consistency (mm) | 75.33 ± 1.11 a | 52.50 ± 0.83 b |
| Amylose content (%) | 20.49 ± 2.19 a | 29.69 ± 0.03 b |
| Total phosphate content (mg/g) | 34.62 ± 0.77 a | 45.07 ± 0.94 b |
| Total soluble sugar content (mg/g) | 58.28 ± 0.34 a | 65.32 ± 0.35 b |
| Starch content (mg/g) | 75.66 ± 0.58 a | 80.47 ± 0.58 b |
| Grain area (mm2) | 0.10 ± 0.00 a | 0.10 ± 0.01 a |
| Grain length/width | 2.15 ± 0.06 a | 2.28 ± 0.09 b |
Table 2 Effects of carbon nanoparticle (CNP) on grain quality.
| Trait | Control | CNP-treated |
|---|---|---|
| Hulling rate (%) | 80.60 ± 0.11 a | 93.31 ± 0.12 b |
| Milling rate (%) | 52.62 ± 0.11 a | 63.95 ± 0.58 b |
| Head rice recovery (%) | 44.05 ± 0.51 a | 52.06 ± 0.43 b |
| Gelatinization temperature (ºC) | 72.00 ± 2.00 a | 72.00 ± 2.00 a |
| Gel consistency (mm) | 75.33 ± 1.11 a | 52.50 ± 0.83 b |
| Amylose content (%) | 20.49 ± 2.19 a | 29.69 ± 0.03 b |
| Total phosphate content (mg/g) | 34.62 ± 0.77 a | 45.07 ± 0.94 b |
| Total soluble sugar content (mg/g) | 58.28 ± 0.34 a | 65.32 ± 0.35 b |
| Starch content (mg/g) | 75.66 ± 0.58 a | 80.47 ± 0.58 b |
| Grain area (mm2) | 0.10 ± 0.00 a | 0.10 ± 0.01 a |
| Grain length/width | 2.15 ± 0.06 a | 2.28 ± 0.09 b |
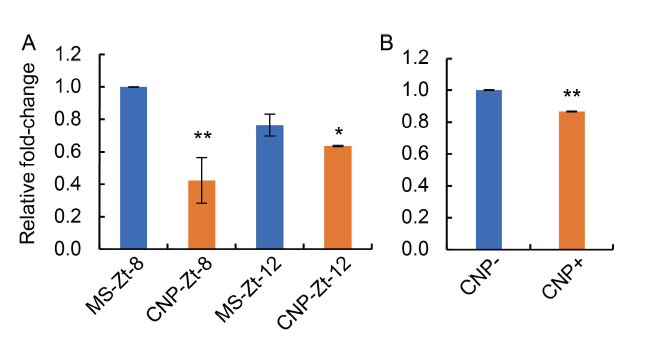
Fig. 7. Analysis of phytochrome B (PHYB) transcripts after carbon nanoparticle (CNP) treatment.A, RNAs isolated from the seedlings grown under white light and sampled of Zeitgeber at 8 h and 12 h after onset of light in the long-day cycle were named as Zt-8 and Zt-12, respectively. Relative transcript levels of PHYB were analyzed using semi-quantitative RT-PCR. Transcript levels of Actin at Zt-8 and Zt-12 were used for normalization and calculation of intensities of PHYB-Zt-8 and PHYB-Zt-12. MS-Zt-8 and MS-Zt-12 indicated control samples, whereas CNP-Zt-8 and CNP-Zt-12 indicated CNP-treated samples, respectively. Relative expression level was calculated using an Image lab software (Version 6.0.0, 2017, Bio-rad Laboratories Inc, USA). B, Real-time expression analysis of PHYB was done from flag leaf samples of CNP-treated or untreated plants. Data were representative images of experiments repeated three times. Statistical significances were confirmed using one-way ANOVA with the Turkey’s multiple comparison in the Prism version 7.0 software, and were represented as *, P ≤ 0.05 and **, P ≤ 0.01.
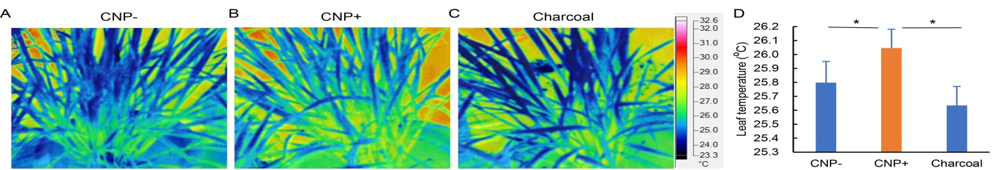
Fig. 8. Leaf internal temperature analysis using thermal imaging. Leaf temperature was studied from plants without carbon nanoparticle (CNP) treatment (A), with CNP treatment (B) or with charcoal treatment (C). The pictures were taken with the help of a FLUKE Infra-red Camera, and analyzed using the SMART VIEW software. Mostly leaf portions were selectively chosen to get the temperature data (D). Graph containing leaf temperature data from pictures of minimum of 15 plants from each CNP/charcoal treatment. Statistical significances were confirmed using one-way ANOVA with the Turkey’s multiple comparison in the Prism version 7.0 software, and were represented as * P ≤ 0.05.
| [1] | Arnon D I. 1949. Copper enzymes in isolated chloroplasts: Polyphenol oxidase in Beta vulgaris. Plant Physiol, 24: 1-15. |
| [2] | Begum P, Ikhtiari R, Fugetsu B. 2014. Potential impact of multiwalled carbon nanotubes exposure to the seedling stage of selected plant species. Nanomaterials, 4: 203-221. |
| [3] | Buysse J, Merckx R. 1993. An improved colorimetric method to quantify sugar content of plant tissue. J Exp Bot, 44: 1627-1629. |
| [4] | Casal J J. 2012. Shade avoidance. Arabidopsis Book, 10: e0157. |
| [5] | Cruz N D, Khush G S. 2000. Rice grain quality evaluation procedures. In: Singh R K, Singh U S, Khush G S. Aromatic Rices. New Delhi, India: Oxford and IBH Publishing Co. Pvt. Ltd: 15-28. |
| [6] | Dubois M, Gilles K A, Hamilton J K, Rebers P A, Smith F. 1956. Colorimetric method for the determination of sugars and related substances. Anal Chem, 28(3): 350-356. |
| [7] | Dusenge M E, Duarte A G, Way D A. 2019. Plant carbon metabolism and climate change: Elevated CO2 and temperature impacts on photosynthesis, photorespiration and respiration. New Phytol, 221: 32-49. |
| [8] | Elanchezhian R, Kumar S, Singh S S, Dwivedi S K, Shivani S, Bhatt B P. 2013. Plant survival, growth and yield attributing traits of rice ( Oryza sativa L.) genotypes under submergence stress in rainfed lowland ecosystem. Ind J Plant Physiol, 18(4): 326-332. |
| [9] | FAOSTAT. 2013. FAOSTAT Commodities: Ranking by country. Top 10 commodities. [2016-04-15]. . |
| [10] | Hahm J, Kim K, Qiu Y J, Chen M. 2020. Increasing ambient temperature progressively disassemble Arabidopsis phytochrome B from individual photobodies with distinct thermostabilities. Nat Commun, 11: 1660. |
| [11] | Hao Y, Xu B L, Mac C X, Shang J Y, Gu W Q, Li W, Hou T Q, Xiang Y X, Cao W D, Xing B S, Rui Y K. 2018a. Synthesis of novel mesoporous carbon nanoparticles and their phytotoxicity to rice ( Oryza sativa L.). J Saudi Chem Soc, 23: 75-82. |
| [12] | Hao Y, Yuan W, Ma C X, White J, Zhang Z, Adeel M, Zohu T, Rui Y K, Xing B S. 2018b. Engineered nanomaterials suppress turnip mosaic virus infection in tobacco ( Nicotiana benthamiana). Environ Sci: Nano, 5(7): 1685-1693. |
| [13] | Hao Y, Fang P H, Ma C X, White J C, Xiang Z Q, Wang H T, Zhang Z, Rui Y K, Xing B S. 2019. Engineered nanomaterials inhibit Podosphaera pannosa infection on rose leaves by regulating phytohormones. Environ Res, 170: 1-6. |
| [14] | Juliano B O. 1971. A simplified assay for milled rice amylase. Cereal Sci Today, 16: 334-340. |
| [15] | Kumar A, Singh A, Panigrahy M, Sahoo P K, Panigrahi K C S. 2018. Carbon nanoparticles influence photomorphogenesis and flowering time in Arabidopsis thaliana. Plant Cell Rep, 37(6): 901-912. |
| [16] | Kumar A A, Mishra P, Kumari K, Panigrahi K C S. 2012. Environmental stress influencing plant development and flowering. Front Biosci, S4: 1315-1324. |
| [17] | Kumari S, Yadav S, Patra D, Singh S, Sarkar A K, Panigrahi K C S. 2019. Uncovering the molecular signature underlying the light intensity-dependent root development in Arabidopsis thaliana. BMC Genom, 20: 596. |
| [18] | Legris M, Klose C, Burgie E S, Costigliolo C, Neme M, Hiltbrunner A, Wigge P A, Schäfer E, Vierstra R D, Casal J J. 2016. Phytochrome B integrates light and temperature signals in Arabidopsis. Science, 354: 897-900. |
| [19] | Li H, Huang J, Lu F, Liu Y, Song Y X, Sun Y H, Zhong J, Huang H, Wang Y, Li S M, Lifshitz Y, Lee S T, Kang Z H. 2018. Impacts of carbon dots on rice plant: Boost the growth and improve the disease resistance. ACS Appl Bio Mater, 1(3): 663-672. |
| [20] | Liu S J, Wei H M, Li Z Y, Li S, Yan H, He Y, Tian Z H. 2015. Effects of graphene on germination and seedling morphology in rice. J Nanosci Nanotechnol, 15: 2695-2710. |
| [21] | Ma L, Li G. 2019. Auxin-dependent cell elongation during the shade avoidance response. Front Plant Sci, 10: 914. |
| [22] | Majeed N, Panigrahi K C S, Sukla L B, John R, Panigrahy M. 2020. Application of carbon nanomaterials in plant biotechnology. Mater Today: Proc, 30(2): 340‒345. |
| [23] | Mitchell R A C, Gibbard C L, Mitchell V, Lawlor D W. 1996. Effects of shading in different developmental phases on biomass and grain yield of winter wheat at ambient and elevated CO2. Plant Cell Environ, 19: 615-621. |
| [24] | Nair R, Mohamed M S, Gao W, Maekawa T, Yoshida Y, Ajayan P M, Kumar D S. 2012. Effect of carbon nanomaterials on the germination and growth of rice plants. J Nanosci Nanotechnol, 12(3): 2212-2220. |
| [25] | Ndlovu N, Mayaya T, Muitire C, Munyengwa N. 2020. Nanotechnology applications in crop production and food systems. Int J Plant Breeding, 7(1): 624-634. |
| [26] | Oswald A, Alkäumper J, Midmore D J. 1994. The effect of different shade levels on growth and tuber yield of sweet potato: I. Plant development. J Agron Crop Sci, 173: 41-52. |
| [27] | Panigrahi S, Panigrahy M, Kariali E, Dash S K, Sahu B B, Sahu S K, Mohapatra P K, Panigrahi K C S. 2021. MicroRNA modulate ethylene induced retrograde signal for rice endosperm starch biosynthesis by default expression of transcriptome. Sci Rep, 11: 5573-5590. |
| [28] | Panigrahy M. 2011. Intact cytoskeleton organization plays a role in nuclear import and speckle formation of phytochrome A and B in Arabidopsis seedlings. J Phytol, 3(1): 59-67. |
| [29] | Panigrahy M, Rao D N, Yugandhar P, Raju N S, Krishnamurthy P, Voleti S R, Reddy G A, Mohapatra T, Robin S, Singh A K, Singh K, Sheshshayee M, Sharma R P, Sarla N. 2014. Hydroponic experiment for identification of tolerance traits developed by rice Nagina 22 mutants to low-phosphorus in field condition. Arch Agron Soil Sci, 60(4): 565‒576. |
| [30] | Panigrahy M, Sarla N, Panigrahi K C S. 2018. Phenotypic, physiological and biochemical characterization of rice introgression lines and mutants under prolonged shade condition. RJLBPCS, 4(3): 115-130. |
| [31] | Panigrahy M, Ranga A, Das J, Panigrahi K C S. 2019. Shade tolerance in Swarnaprabha rice is associated with higher rate of panicle emergence and positively regulated by genes of ethylene and cytokinin pathway. Sci Rep, 9: 6817-6834. |
| [32] | Pfaffl M W. 2001. A new mathematical model for relative quantification in real-time RT-PCR. Nucl Acids Res, 29(9): e45. |
| [33] | Qiao X, Sai L H, Chen X W, Xue L H, Lei J J. 2019. Impact of fruit-tree shade intensity on the growth, yield, and quality of intercropped wheat. PLoS One, 14(4): e0203238. |
| [34] | Qiu Y J, Li M N, Kim R J, Moore C M, Chen M. 2019. Daytime temperature is sensed by phytochrome B in Arabidopsis through a transcriptional activator HEMERA. Nat Commun, 10: 140. |
| [35] | Sessa G, Carabelli M, Possenti M, Morelli G, Ruberti I. 2018. Multiple pathways in the control of the shade avoidance response. Plants (Basel), 7(4): 102. |
| [36] | Shrestha R, Gómez-Ariza J, Brambilla V, Fornara F. 2014. Molecular control of seasonal flowering in rice, Arabidopsis and temperate cereals. Ann Bot, 114(7): 1445-1458. |
| [37] | Silva C S, Nayak A, Lai X, Hutin S, Hugouvieux V, Jung J H, López-Vidriero I, Jose M,. Franco-Zorrilla J M, Panigrahi K C S, Nanao M H, Wigge P A, Zubieta C. 2020. Molecular mechanisms of evening complex activity in Arabidopsis. Proc Natl Acad Sci USA, 117(12): 6901-6909. |
| [38] | Tang Y, Liesche J. 2017. The molecular mechanism of shade avoidance in crops: How data from Arabidopsis can help to identify targets for increasing yield and biomass production. J Integr Agric, 16(6): 1244-1255. |
| [39] | Yan S H, Zhang H, Huang Y, Tan J J, Wang P, Wang Y P, Hou H L, Huang J, Li L J. 2016. Single-wall and multi-wall carbon nanotubes promote rice root growth by eliciting the similar molecular pathways and epigenetic regulation. IET Nanobiotechnol, 10: 222-229. |
| [40] | Yang C W, Li L. 2017. Hormonal regulation in shade avoidance. Front Plant Sci, 8: 1527. |
| [41] | Yi H, Yu F F, Lv R T, Ma C X, Zhang Z T, Rui Y K, Liu L M, Cao W D, Xing B S. 2016. Carbon nanotubes filled with different ferromagnetic alloys affect the growth and development of rice seedlings by changing the C:N ratio and plant hormones concentrations. PLoS One, 11: e0157264. |
| [42] | Yoshida S, Forno D A, Cock J H, Gomez K A. 1976. Laboratory Manual for Physiological Studies of Rice. Los Banos, the Philippines: International Rice Research Institute: 46‒49. |
| [43] | Zaytseva O, Neumann G. 2016. Carbon nanomaterials: Production, impact on plant development, agricultural and environmental applications. Chem Biol Technol Agric, 3: 17. |
| [44] | Zhang H, Yue M X, Zheng X K, Xie C S, Zhou H, Li L J. 2017. Physiological effects of single- and multi-walled carbon nanotubes on rice seedlings. IEEE Trans Nanobiosci, 16(7): 563-570. |
| [45] | Zhao Q, Ma C X, White J C, Dhankher O P, Zhang X J, Zhang S Y, Xing B S. 2017. Quantitative evaluation of multi-wall carbon nanotube uptake by terrestrial plants. Carbon, 114: 661-670. |
| [1] | Prathap V, Suresh KUMAR, Nand Lal MEENA, Chirag MAHESHWARI, Monika DALAL, Aruna TYAGI. Phosphorus Starvation Tolerance in Rice Through a Combined Physiological, Biochemical and Proteome Analysis [J]. Rice Science, 2023, 30(6): 8-. |
| [2] | Serena REGGI, Elisabetta ONELLI, Alessandra MOSCATELLI, Nadia STROPPA, Matteo Dell’ANNO, Kiril PERFANOV, Luciana ROSSI. Seed-Specific Expression of Apolipoprotein A-IMilano Dimer in Rice Engineered Lines [J]. Rice Science, 2023, 30(6): 6-. |
| [3] | Sundus ZAFAR, XU Jianlong. Recent Advances to Enhance Nutritional Quality of Rice [J]. Rice Science, 2023, 30(6): 4-. |
| [4] | Kankunlanach KHAMPUANG, Nanthana CHAIWONG, Atilla YAZICI, Baris DEMIRER, Ismail CAKMAK, Chanakan PROM-U-THAI. Effect of Sulfur Fertilization on Productivity and Grain Zinc Yield of Rice Grown under Low and Adequate Soil Zinc Applications [J]. Rice Science, 2023, 30(6): 9-. |
| [5] | FAN Fengfeng, CAI Meng, LUO Xiong, LIU Manman, YUAN Huanran, CHENG Mingxing, Ayaz AHMAD, LI Nengwu, LI Shaoqing. Novel QTLs from Wild Rice Oryza longistaminata Confer Rice Strong Tolerance to High Temperature at Seedling Stage [J]. Rice Science, 2023, 30(6): 14-. |
| [6] | LIN Shaodan, YAO Yue, LI Jiayi, LI Xiaobin, MA Jie, WENG Haiyong, CHENG Zuxin, YE Dapeng. Application of UAV-Based Imaging and Deep Learning in Assessment of Rice Blast Resistance [J]. Rice Science, 2023, 30(6): 10-. |
| [7] | Md. Forshed DEWAN, Md. AHIDUZZAMAN, Md. Nahidul ISLAM, Habibul Bari SHOZIB. Potential Benefits of Bioactive Compounds of Traditional Rice Grown in South and South-East Asia: A Review [J]. Rice Science, 2023, 30(6): 5-. |
| [8] | Raja CHAKRABORTY, Pratap KALITA, Saikat SEN. Phenolic Profile, Antioxidant, Antihyperlipidemic and Cardiac Risk Preventive Effect of Chakhao Poireiton (A Pigmented Black Rice) in High-Fat High-Sugar induced Rats [J]. Rice Science, 2023, 30(6): 11-. |
| [9] | LI Qianlong, FENG Qi, WANG Heqin, KANG Yunhai, ZHANG Conghe, DU Ming, ZHANG Yunhu, WANG Hui, CHEN Jinjie, HAN Bin, FANG Yu, WANG Ahong. Genome-Wide Dissection of Quan 9311A Breeding Process and Application Advantages [J]. Rice Science, 2023, 30(6): 7-. |
| [10] | JI Dongling, XIAO Wenhui, SUN Zhiwei, LIU Lijun, GU Junfei, ZHANG Hao, Tom Matthew HARRISON, LIU Ke, WANG Zhiqin, WANG Weilu, YANG Jianchang. Translocation and Distribution of Carbon-Nitrogen in Relation to Rice Yield and Grain Quality as Affected by High Temperature at Early Panicle Initiation Stage [J]. Rice Science, 2023, 30(6): 12-. |
| [11] | Nazaratul Ashifa Abdullah Salim, Norlida Mat Daud, Julieta Griboff, Abdul Rahim Harun. Elemental Assessments in Paddy Soil for Geographical Traceability of Rice from Peninsular Malaysia [J]. Rice Science, 2023, 30(5): 486-498. |
| [12] | Ammara Latif, Sun Ying, Pu Cuixia, Noman Ali. Rice Curled Its Leaves Either Adaxially or Abaxially to Combat Drought Stress [J]. Rice Science, 2023, 30(5): 405-416. |
| [13] | Liu Qiao, Qiu Linlin, Hua Yangguang, Li Jing, Pang Bo, Zhai Yufeng, Wang Dekai. LHD3 Encoding a J-Domain Protein Controls Heading Date in Rice [J]. Rice Science, 2023, 30(5): 437-448. |
| [14] | Lu Xuedan, Li Fan, Xiao Yunhua, Wang Feng, Zhang Guilian, Deng Huabing, Tang Wenbang. Grain Shape Genes: Shaping the Future of Rice Breeding [J]. Rice Science, 2023, 30(5): 379-404. |
| [15] | Zhang Guomei, Li Han, Liu Shanshan, Zhou Xuming, Lu Mingyang, Tang Liang, Sun Lihua. Water Extract of Rice False Smut Balls Activates Nrf2/HO-1 and Apoptosis Pathways, Causing Liver Injury [J]. Rice Science, 2023, 30(5): 473-485. |
| Viewed | ||||||
|
Full text |
|
|||||
|
Abstract |
|
|||||