Rice Science ›› 2023, Vol. 30 ›› Issue (4): 306-320.DOI: 10.1016/j.rsci.2023.02.001
• Research Papers • Previous Articles Next Articles
B. M. Lokeshkumar1, S. L. Krishnamurthy1( ), Suman Rathor1, Arvinder Singh Warriach1, N. M. Vinaykumar2, B. M. Dushyanthakumar3, Parbodh Chander Sharma1()
Received:2022-12-08
Accepted:2023-02-28
Online:2023-07-28
Published:2023-05-26
Contact:
S. L. Krishnamurthy (krishnagene@gmail.com);Parbodh Chander Sharma (pcsharma.knl@gmail.com)B. M. Lokeshkumar, S. L. Krishnamurthy, Suman Rathor, Arvinder Singh Warriach, N. M. Vinaykumar, B. M. Dushyanthakumar, Parbodh Chander Sharma. Morphophysiological Diversity and Haplotype Analysis of Saltol QTL Region in Diverse Rice Landraces for Salinity Tolerance[J]. Rice Science, 2023, 30(4): 306-320.
Add to citation manager EndNote|Ris|BibTeX
| Source of variation | df | Sum of square | |||||||
|---|---|---|---|---|---|---|---|---|---|
| Vigor score (SES) | Shoot length | Root length | Shoot Na+ content | Shoot K+ content | Shoot Ca2+ content | Shoot Mg2+ content | Shoot Na+/K+ ratio | ||
| Environment | 2 | 8 426.36** | 246 369.37** | 15 964.71** | 1 503.53** | 61.55** | 56.11** | 10.07* | 6 252.26** |
| Replication | 3 | 1.39 | 1 108.71** | 65.91** | 4.57** | 0.12** | 0.12 | 7.93** | 0.05 |
| Genotype | 146 | 297.45** | 14 339.42** | 2 490.72** | 181.23** | 16.40** | 155.21** | 796.19** | 965.85** |
| Environment × Genotype | 292 | 390.58** | 11 683.47** | 2 273.56** | 324.62** | 34.18** | 310.46** | 1 612.54** | 1 288.44** |
| Pooled error | 438 | 92.71 | 1 343.08 | 200.08 | 34.71 | 3.31 | 47.19 | 207.20 | 152.71 |
| Total | 881 | 9 208.51 | 274 844.00 | 20 995.00 | 2 048.68 | 115.57 | 569.10 | 2 633.95 | 8 659.32 |
Table 1. Analysis of variance of different traits in rice genotypes under normal, stress and relative stress conditions.
| Source of variation | df | Sum of square | |||||||
|---|---|---|---|---|---|---|---|---|---|
| Vigor score (SES) | Shoot length | Root length | Shoot Na+ content | Shoot K+ content | Shoot Ca2+ content | Shoot Mg2+ content | Shoot Na+/K+ ratio | ||
| Environment | 2 | 8 426.36** | 246 369.37** | 15 964.71** | 1 503.53** | 61.55** | 56.11** | 10.07* | 6 252.26** |
| Replication | 3 | 1.39 | 1 108.71** | 65.91** | 4.57** | 0.12** | 0.12 | 7.93** | 0.05 |
| Genotype | 146 | 297.45** | 14 339.42** | 2 490.72** | 181.23** | 16.40** | 155.21** | 796.19** | 965.85** |
| Environment × Genotype | 292 | 390.58** | 11 683.47** | 2 273.56** | 324.62** | 34.18** | 310.46** | 1 612.54** | 1 288.44** |
| Pooled error | 438 | 92.71 | 1 343.08 | 200.08 | 34.71 | 3.31 | 47.19 | 207.20 | 152.71 |
| Total | 881 | 9 208.51 | 274 844.00 | 20 995.00 | 2 048.68 | 115.57 | 569.10 | 2 633.95 | 8 659.32 |
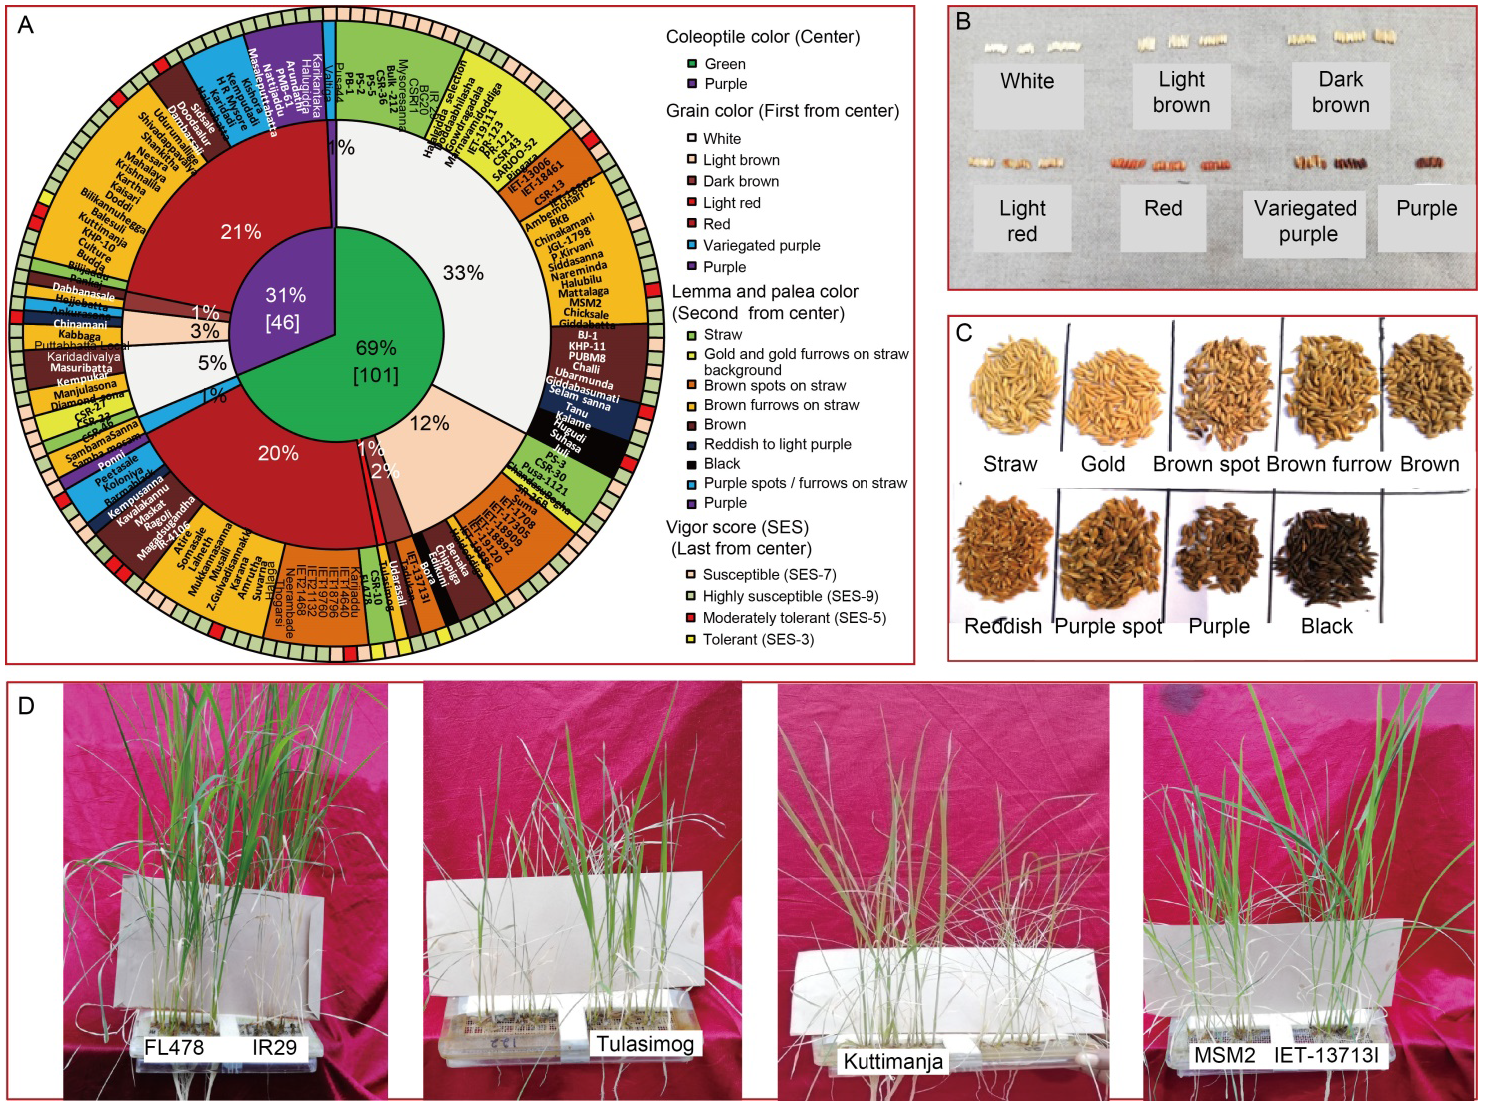
Fig. 1. Graphical representation of diversity in rice genotypes for coleoptile, grain, lemma and palea color and salinity tolerance in rice. A, Doughnut chart representing morphological variations of coleoptile color (center), grain color (first circle from center), lemma and palea color (second circle from center) along with vigor scores (last circle from center) of 147 genotypes used for screening of seedling stage salinity tolerance. B?D, Diverse phenotypic expression of different genotypes for grain color (B), lemma and palea color (C) and response to salinity stress (D). SES, Standard evaluation system.
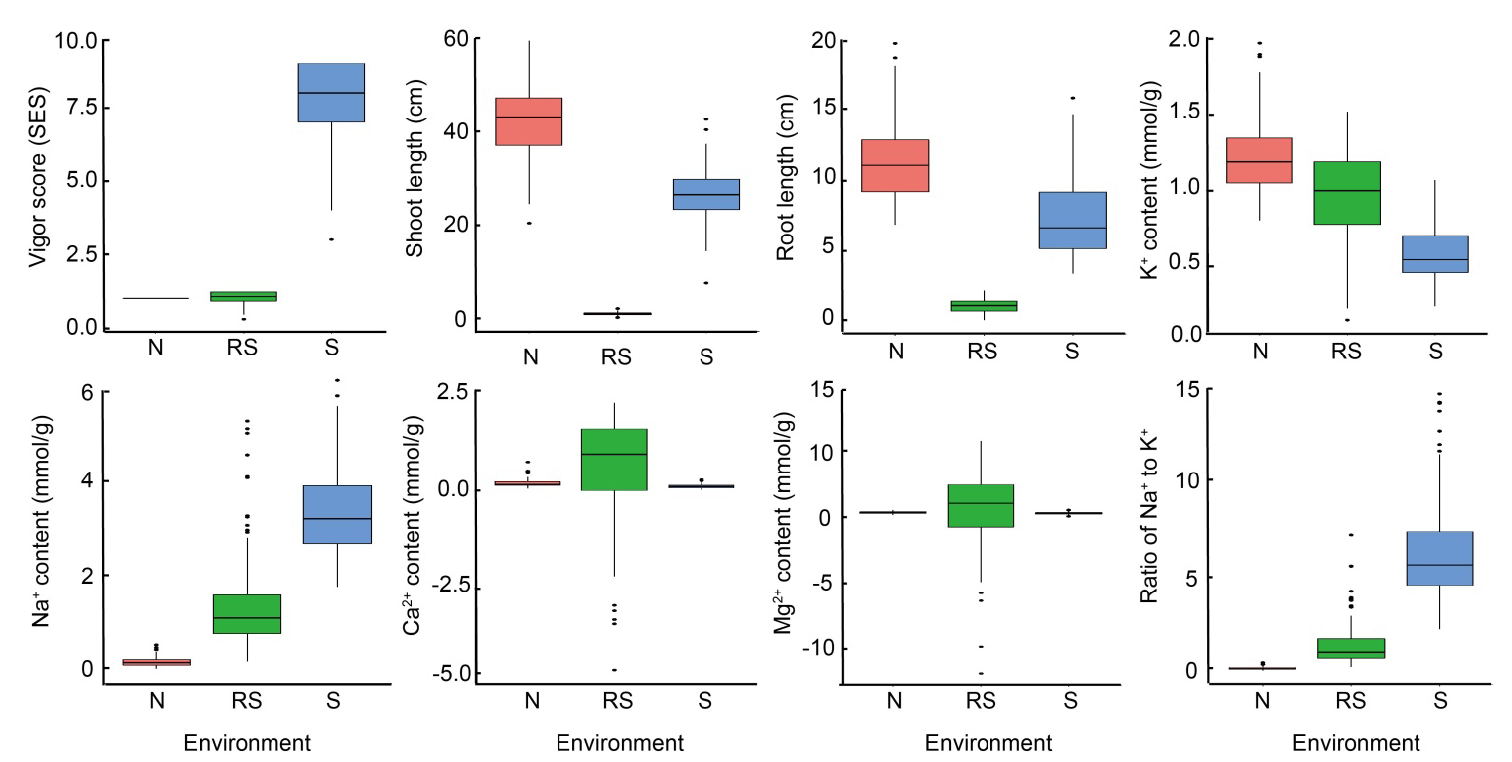
Fig. 2. Box plot distributions of trait values under normal (N), stress (S) and relative stress (RS) conditions. SES, Standard evaluation system.

Fig. 3. Graphical representation of correlation coefficients and principal component biplots for normal (A and E), salinity stress (B and F) and relative stress (C and G) conditions along with combined data (D and H). SL, Shoot length; RL, Root length; Na, Shoot Na+ content; K, Shoot K+ content; Ca, Shoot Ca2+ content; Mg, Shoot Mg2+ content; Na/K, Ratio of Na+ to K+; SES, Standard evaluation system; HS, Highly susceptible; MT, Moderately tolerant; S, Susceptible. FL478, Tulasimog, Kuttimanja and IET-13713I are tolerant genotypes with SES score of 3, and IR29 is a highly susceptible genotype with SES score of 9.
| Parameter | Cluster I | Cluster II | Cluster III | Cluster IV | Cluster V |
|---|---|---|---|---|---|
| Variable | 28 | 31 | 26 | 18 | 44 |
| Normal | |||||
| SES score | 1.00 | 1.00 | 1.00 | 1.00 | 1.00 |
| Shoot length (cm) | 48.77 | 47.57 | 29.00 | 37.37 | 41.53 |
| Root length (cm) | 10.55 | 13.75 | 10.83 | 13.35 | 9.65 |
| Na+ content (mmol/g) | 0.13 | 0.15 | 0.21 | 0.15 | 0.22 |
| K+ content (mmol/g) | 1.24 | 1.31 | 1.09 | 1.24 | 1.20 |
| Ca2+ content (mmol/g) | 0.15 | 0.19 | 0.16 | 0.18 | 0.21 |
| Mg2+ content (mmol/g) | 0.31 | 0.30 | 0.29 | 0.24 | 0.34 |
| Na+/K+ ratio | 0.11 | 0.12 | 0.19 | 0.13 | 0.19 |
| Stress | |||||
| SES score | 8.00 | 6.06 | 7.54 | 7.44 | 8.39 |
| Shoot length (cm) | 29.23 | 32.67 | 20.62 | 24.86 | 24.58 |
| Root length (cm) | 5.74 | 10.52 | 7.78 | 8.33 | 5.48 |
| Na+ content (mmol/g) | 3.73 | 2.89 | 3.44 | 3.69 | 3.21 |
| K+ content (mmol/g) | 0.65 | 0.54 | 0.54 | 0.39 | 0.65 |
| Ca2+ content (mmol/g) | 0.10 | 0.07 | 0.12 | 0.14 | 0.10 |
| Mg2+ content (mmol/g) | 0.27 | 0.21 | 0.26 | 0.31 | 0.25 |
| Na+/K+ ratio | 6.20 | 5.84 | 6.79 | 9.63 | 5.09 |
| Relative stress | |||||
| SES score | 1.07 | 0.77 | 1.00 | 0.98 | 1.13 |
| Shoot length (cm) | 1.10 | 0.85 | 0.78 | 0.92 | 1.13 |
| Root length (cm) | 1.28 | 0.65 | 0.80 | 1.08 | 1.19 |
| Na+ content (mmol/g) | 2.03 | 1.41 | 1.01 | 1.59 | 0.95 |
| K+ content (mmol/g) | 0.87 | 1.91 | 0.95 | 1.27 | 0.82 |
| Ca2+ content (mmol/g) | 0.50 | 1.26 | -0.01 | 0.24 | 0.94 |
| Mg2+ content (mmol/g) | 0.43 | 1.26 | 0.23 | -2.09 | 1.20 |
| Na+/K+ ratio | 1.81 | 1.60 | 1.01 | 2.37 | 0.79 |
Table 2. Cluster mean values for different traits of rice genotypes evaluated under normal, stress and relative stress conditions.
| Parameter | Cluster I | Cluster II | Cluster III | Cluster IV | Cluster V |
|---|---|---|---|---|---|
| Variable | 28 | 31 | 26 | 18 | 44 |
| Normal | |||||
| SES score | 1.00 | 1.00 | 1.00 | 1.00 | 1.00 |
| Shoot length (cm) | 48.77 | 47.57 | 29.00 | 37.37 | 41.53 |
| Root length (cm) | 10.55 | 13.75 | 10.83 | 13.35 | 9.65 |
| Na+ content (mmol/g) | 0.13 | 0.15 | 0.21 | 0.15 | 0.22 |
| K+ content (mmol/g) | 1.24 | 1.31 | 1.09 | 1.24 | 1.20 |
| Ca2+ content (mmol/g) | 0.15 | 0.19 | 0.16 | 0.18 | 0.21 |
| Mg2+ content (mmol/g) | 0.31 | 0.30 | 0.29 | 0.24 | 0.34 |
| Na+/K+ ratio | 0.11 | 0.12 | 0.19 | 0.13 | 0.19 |
| Stress | |||||
| SES score | 8.00 | 6.06 | 7.54 | 7.44 | 8.39 |
| Shoot length (cm) | 29.23 | 32.67 | 20.62 | 24.86 | 24.58 |
| Root length (cm) | 5.74 | 10.52 | 7.78 | 8.33 | 5.48 |
| Na+ content (mmol/g) | 3.73 | 2.89 | 3.44 | 3.69 | 3.21 |
| K+ content (mmol/g) | 0.65 | 0.54 | 0.54 | 0.39 | 0.65 |
| Ca2+ content (mmol/g) | 0.10 | 0.07 | 0.12 | 0.14 | 0.10 |
| Mg2+ content (mmol/g) | 0.27 | 0.21 | 0.26 | 0.31 | 0.25 |
| Na+/K+ ratio | 6.20 | 5.84 | 6.79 | 9.63 | 5.09 |
| Relative stress | |||||
| SES score | 1.07 | 0.77 | 1.00 | 0.98 | 1.13 |
| Shoot length (cm) | 1.10 | 0.85 | 0.78 | 0.92 | 1.13 |
| Root length (cm) | 1.28 | 0.65 | 0.80 | 1.08 | 1.19 |
| Na+ content (mmol/g) | 2.03 | 1.41 | 1.01 | 1.59 | 0.95 |
| K+ content (mmol/g) | 0.87 | 1.91 | 0.95 | 1.27 | 0.82 |
| Ca2+ content (mmol/g) | 0.50 | 1.26 | -0.01 | 0.24 | 0.94 |
| Mg2+ content (mmol/g) | 0.43 | 1.26 | 0.23 | -2.09 | 1.20 |
| Na+/K+ ratio | 1.81 | 1.60 | 1.01 | 2.37 | 0.79 |

Fig. 4. Graphical genotypes for 11 Saltol linked markers over 17 tolerant and moderately tolerant genotypes constructed using GGT version 2.0. The colors indicate different alleles obtained in each genotype for different markers and gray color indicated unamplified region. SES, Standard evaluation system.
| Saltol linked marker | No. of genotypes with FL478 type allele a | No. of genotypes with IR29 type allele a | No. of genotypes with other alleles a |
|---|---|---|---|
| RM10655 | 4 (23.53) | 12 (70.59) | 1 (5.88) |
| RM10694 | 10 (58.82) | 7 (41.18) | 0 (0.00) |
| RM10711 | 8 (47.06) | 7 (41.18) | 2 (11.76) |
| AP3206F | 0 (0.00) | 1 (5.88) | 16 (94.12) |
| RM3412b | 5 (29.41) | 8 (47.06) | 4 (23.53) |
| RM10793 | 7 (41.18) | 5 (29.41) | 4 (23.53) |
| RM10800 | 1 (5.88) | 16 (94.12) | 0 (0.00) |
| RM10825 | 1 (5.88) | 13 (76.47) | 3 (17.65) |
| RM10843 | 9 (56.25) | 7 (43.75) | 0 (0.00) |
| RM10864 | 3 (17.65) | 13 (76.47) | 1 (5.88) |
| RM10927 | 5 (29.41) | 12 (70.59) | 0 (0.00) |
Table 3. Allelic variations in 11 Saltol linked simple sequence repeat markers used in haplotype analysis of 17 tolerant and moderately tolerant genotypes.
| Saltol linked marker | No. of genotypes with FL478 type allele a | No. of genotypes with IR29 type allele a | No. of genotypes with other alleles a |
|---|---|---|---|
| RM10655 | 4 (23.53) | 12 (70.59) | 1 (5.88) |
| RM10694 | 10 (58.82) | 7 (41.18) | 0 (0.00) |
| RM10711 | 8 (47.06) | 7 (41.18) | 2 (11.76) |
| AP3206F | 0 (0.00) | 1 (5.88) | 16 (94.12) |
| RM3412b | 5 (29.41) | 8 (47.06) | 4 (23.53) |
| RM10793 | 7 (41.18) | 5 (29.41) | 4 (23.53) |
| RM10800 | 1 (5.88) | 16 (94.12) | 0 (0.00) |
| RM10825 | 1 (5.88) | 13 (76.47) | 3 (17.65) |
| RM10843 | 9 (56.25) | 7 (43.75) | 0 (0.00) |
| RM10864 | 3 (17.65) | 13 (76.47) | 1 (5.88) |
| RM10927 | 5 (29.41) | 12 (70.59) | 0 (0.00) |
| Genotype (SES score) | No. of markers with tolerant type allele a | No. of markers with susceptible type allele a | No. of markers with diverse allele a |
|---|---|---|---|
| Kuttimanja (SES-3) | 4 (36.36) | 5 (45.45) | 2 (18.18) |
| IET-13713I (SES-3) | 2 (20.00) | 6 (60.00) | 2 (20.00) |
| Tulasimog (SES-3) | 2 (18.18) | 5 (45.45) | 4 (36.36) |
| Culture (SES-5) | 3 (27.27) | 6 (54.55) | 2 (18.18) |
| KHP-10 (SES-5) | 3 (27.27) | 6 (54.55) | 2 (18.18) |
| Magadsugandha (SES-5) | 4 (36.36) | 6 (54.55) | 1 (9.09) |
| Doodaalur (SES-5) | 3 (27.27) | 6 (54.55) | 2 (18.18) |
| Karana (SES-5) | 2 (18.18) | 8 (72.73) | 1 (9.09) |
| Ragoli (SES-5) | 5 (45.45) | 5 (45.45) | 1 (9.09) |
| Shankitha (SES-5) | 3 (27.27) | 7 (63.64) | 1 (9.09) |
| Suhasa (SES-5) | 3 (27.27) | 4 (36.36) | 4 (36.36) |
| IET-18461 (SES-5) | 7 (63.64) | 3 (27.27) | 1 (9.09) |
| Peetasale (SES-5) | 1 (9.09) | 8 (72.73) | 2 (18.18) |
| Selamsanna (SES-5) | 3 (27.27) | 6 (54.55) | 2 (18.18) |
| Chinamani (SES-4) | 2 (18.18) | 8 (72.73) | 1 (9.09) |
| IET-14640 (SES-5) | 3 (27.27) | 6 (54.55) | 1 (9.09) |
| MSM2 (SES-5) | 3 (27.27) | 8 (72.73) | 0 (0.00) |
Table 4. Distributions of tolerant (FL478 type), susceptible (IR29 type) and diverse (other than FL478 and IR29) allelic contents in 17 tolerant and moderately tolerant genotypes used in haplotype analysis with 11 Saltol linked simple sequence repeat markers.
| Genotype (SES score) | No. of markers with tolerant type allele a | No. of markers with susceptible type allele a | No. of markers with diverse allele a |
|---|---|---|---|
| Kuttimanja (SES-3) | 4 (36.36) | 5 (45.45) | 2 (18.18) |
| IET-13713I (SES-3) | 2 (20.00) | 6 (60.00) | 2 (20.00) |
| Tulasimog (SES-3) | 2 (18.18) | 5 (45.45) | 4 (36.36) |
| Culture (SES-5) | 3 (27.27) | 6 (54.55) | 2 (18.18) |
| KHP-10 (SES-5) | 3 (27.27) | 6 (54.55) | 2 (18.18) |
| Magadsugandha (SES-5) | 4 (36.36) | 6 (54.55) | 1 (9.09) |
| Doodaalur (SES-5) | 3 (27.27) | 6 (54.55) | 2 (18.18) |
| Karana (SES-5) | 2 (18.18) | 8 (72.73) | 1 (9.09) |
| Ragoli (SES-5) | 5 (45.45) | 5 (45.45) | 1 (9.09) |
| Shankitha (SES-5) | 3 (27.27) | 7 (63.64) | 1 (9.09) |
| Suhasa (SES-5) | 3 (27.27) | 4 (36.36) | 4 (36.36) |
| IET-18461 (SES-5) | 7 (63.64) | 3 (27.27) | 1 (9.09) |
| Peetasale (SES-5) | 1 (9.09) | 8 (72.73) | 2 (18.18) |
| Selamsanna (SES-5) | 3 (27.27) | 6 (54.55) | 2 (18.18) |
| Chinamani (SES-4) | 2 (18.18) | 8 (72.73) | 1 (9.09) |
| IET-14640 (SES-5) | 3 (27.27) | 6 (54.55) | 1 (9.09) |
| MSM2 (SES-5) | 3 (27.27) | 8 (72.73) | 0 (0.00) |
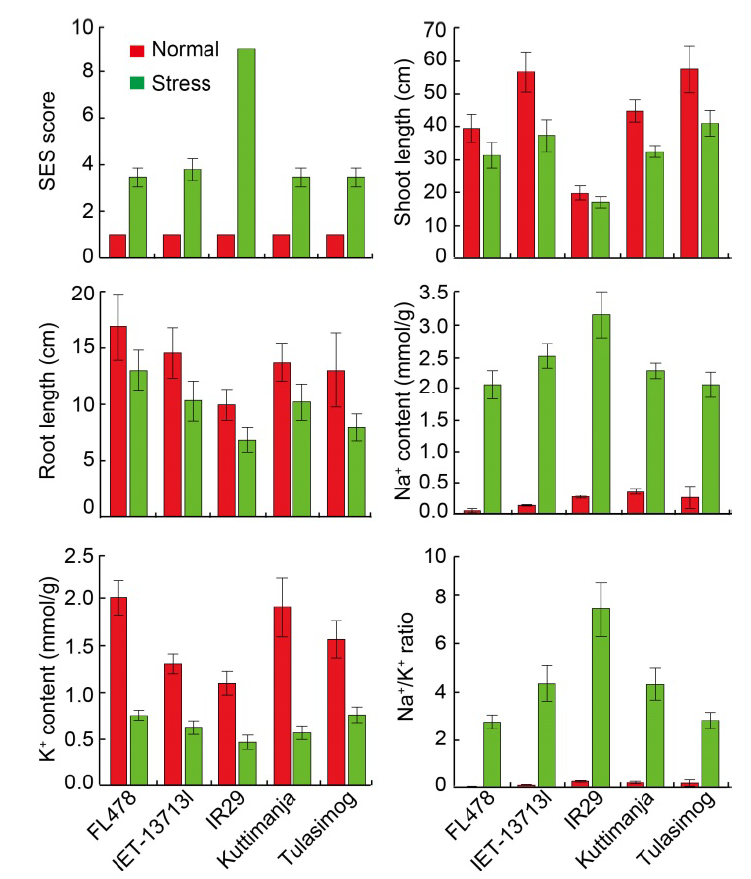
Fig. 5. Performances of tolerant (FL478, Tulasimog, Kuttimanja and IET-13713I) and susceptible (IR29) genotypes for morpho- physiological characters under normal and salinity stress conditions. SES, Standard evaluation system. Data are Mean ± SD (n = 9).
| [1] | Akbar M, Yabuno T, Nakao S. 1972. Breeding for saline-resistant varieties of rice: I. Variability for salt tolerance among some rice varieties. Jpn J Breed, 22(5): 277-284. |
| [2] | Alam R, Sazzadur Rahman M, Seraj Z I, Thomson M J, Ismail A M, Tumimbang-Raiz E, Gregorio G B. 2011. Investigation of seedling-stage salinity tolerance QTLs using backcross lines derived from Oryza sativa L. Pokkali. Plant Breed, 130(4): 430-437. |
| [3] | Ali M N, Yeasmin L, Gantait S, Goswami R, Chakraborty S. 2014. Screening of rice landraces for salinity tolerance at seedling stage through morphological and molecular markers. Physiol Mol Biol Plants, 20(4): 411-423. |
| [4] | Babu N N, Vinod K K, Krishnan S G, Bhowmick P K, Vanaja T, Krishnamurthy S L, Nagarajan M, Singh N K, Prabhu K V, Singh A K. 2014. Marker based haplotype diversity of Saltol QTL in relation to seedling stage salinity tolerance in selected genotypes of rice. Ind J Genet Plant Breed, 74(1): 16-25. |
| [5] | Babu N N, Vinod K K, Krishnamurthy S L, Gopala Krishnan S, Yadav A, Bhowmick P K, Nagarajan M, Singh N K, Prabhu K V, Singh A K. 2017. Microsatellite based linkage disequilibrium analyses reveal Saltol haplotype fragmentation and identify novel QTLs for seedling stage salinity tolerance in rice (Oryza sativa L.). J Plant Biochem Biotechnol, 26(3): 310-320. |
| [6] | Bohnert H J, Su H, Shen B. 1999. Molecular mechanisms of salinity tolerance. In: Shinozaki K, Yamaguchi-Shinozaki K. Molecular Responses to Cold, Drought, Heat and Salt Stress in Higher Plants. Austin: R. G. Landes Company: 29-60. |
| [7] | Bonilla P, Dvorak J, MacKill D, Deal K, Gregorio G. 2002. RFLP and SSLP mapping of salinity tolerance genes in chromosome 1 of rice (Oryza sativa L.) using recombinant inbred lines. Philipp Agric Sci, 85: 68-76. |
| [8] | Cha-um S, Chuencharoen S, Mongkolsiriwatana C, Ashraf M, Kirdmanee C. 2012. Screening sugarcane (Saccharum sp.) genotypes for salt tolerance using multivariate cluster analysis. Plant Cell Tiss Organ Cult, 110(1): 23-33. |
| [9] |
Chunthaburee S, Dongsansuk A, Sanitchon J, Pattanagul W, Theerakulpisut P. 2016. Physiological and biochemical parameters for evaluation and clustering of rice cultivars differing in salt tolerance at seedling stage. Saudi J Biol Sci, 23(4): 467-477.
PMID |
| [10] |
De Leon T B, Linscombe S, Gregorio G, Subudhi P K. 2015. Genetic variation in Southern USA rice genotypes for seedling salinity tolerance. Front Plant Sci, 6: 374.
PMID |
| [11] | De Leon T B, Linscombe S, Subudhi P K. 2017. Identification and validation of QTLs for seedling salinity tolerance in introgression lines of a salt tolerant rice landrace ‘Pokkali’. PLoS One, 12(4): e0175361. |
| [12] | Dionisio-Sese M L, Tobita S. 2000. Effects of salinity on sodium content and photosynthetic responses of rice seedlings differing in salt tolerance. J Plant Physiol, 157(1): 54-58. |
| [13] | El-Hendawy S E, Hu Y C, Yakout G M, Awad A M, Hafiz S E, Schmidhalter U. 2005. Evaluating salt tolerance of wheat genotypes using multiple parameters. Eur J Agron, 22(3): 243-253. |
| [14] | FAOSTAT. 2021. Food and Agriculture Data. Rome: Food and Agriculture Organization of the United Nations. |
| [15] | Fernandez C G J. 1993. Effective selection criteria for assessing plant stress tolerance. In: Kuo C G. Adaptation of Food Crops to Temperature and Water Stress: Proceedings of an International Symposium. 13-18 August, 1992, Taiwan, China. |
| [16] | Flowers T J, Yeo A R. 1981. Variability in the resistance of sodium chloride salinity within rice (Oryza sativa L.) varieties. New Phytol, 88(2): 363-373. |
| [17] | Ganapati R K, Naveed S A, Zafar S, Wang W S, Xu J L. 2022. Saline-alkali tolerance in rice: Physiological response, molecular mechanism, and QTL identification and application to breeding. Rice Sci, 29(5): 412-434. |
| [18] | Gregorio G B. 1997. Tagging salinity tolerance genes in rice using amplified fragment length polymorphism (AFLP). Los Baños, Laguna, the Philippines: University of the Philippines. |
| [19] | Gregorio G B, Senadhira D. 1993. Genetic analysis of salinity tolerance in rice (Oryza sativa L.). Theor Appl Genet, 86(2/3): 333-338. |
| [20] | Gregorio G B, Senadhira D, Mendoza R D, Manigbas N L, Roxas J P, Guerta C Q. 2002. Progress in breeding for salinity tolerance and associated abiotic stresses in rice. Field Crops Res, 76(2/3): 91-101. |
| [21] | Hakim M A, Juraimi A S, Hanafi M M, Ismail M R, Rafii M Y, Islam M I, Selamat A. 2014. The effect of salinity on growth, ion accumulation and yield of rice varieties. J Anim Plant Sci, 24: 874-885. |
| [22] | Hopmans J W, Qureshi A S, Kisekka I, Munns R, Grattan S R, Rengasamy P, Ben-Gal A, Assouline S, Javaux M, Minhas P S, Raats P A C, Skaggs T H, Wang G, De Jong van Lier Q, Jiao H, Lavado R S, Lazarovitch N, Li B, Taleisnik E. 2021. Chapter one: Critical knowledge gaps and research priorities in global soil salinity. Adv Agron, 169: 1-191. |
| [23] | Hossain H, Rahman M A, Alam M S, Singh R K. 2015. Mapping of quantitative trait loci associated with reproductive-stage salt tolerance in rice. J Agron Crop Sci, 201(1): 17-31. |
| [24] | IRRI. 2013. Standard Evaluation System (SES) for Rice. 3rd edn. Manila, the Philippines: International Rice Research Institute. |
| [25] | Islam M R, Gregorio G B, Salam M A, Collard B C Y, Singh R K, Hassan L. 2012. Validation of Saltol linked markers and haplotype diversity on chromosome 1 of rice. Mol Plant Breed, 3(10): 103-114. |
| [26] |
Ismail A M, Heuer S, Thomson M J, Wissuwa M. 2007. Genetic and genomic approaches to develop rice germplasm for problem soils. Plant Mol Biol, 65(4): 547-570.
PMID |
| [27] |
Johnson S C. 1967. Hierarchical clustering schemes. Psychometrika, 32(3): 241-254.
PMID |
| [28] | Kim J K, Park S Y, Lim S H, Yeo Y, Cho H S, Ha S H. 2013. Comparative metabolic profiling of pigmented rice (Oryza sativa L.) cultivars reveals primary metabolites are correlated with secondary metabolites. J Cereal Sci, 57(1): 14-20. |
| [29] | Kim S H, Bhat P R, Cui X P, Walia H, Xu J, Wanamaker S, Ismail A M, Wilson C, Close T J. 2009. Detection and validation of single feature polymorphisms using RNA expression data from a rice genome array. BMC Plant Biol, 9: 65. |
| [30] | Koksal N, Alkan-Torun A, Kulahlioglu I, Ertargin E, Karalar E. 2016. Ion uptake of marigold under saline growth conditions. Springer Plus, 5: 139. |
| [31] | Kordrostami M, Rabiei B, Hassani Kumleh H. 2016. Association analysis, genetic diversity and haplotyping of rice plants under salt stress using SSR markers linked to Saltol and morpho- physiological characteristics. Plant Syst Evol, 302(7): 871-890. |
| [32] | Krishnamurthy S L, Sharma S K, Gautam R K, Kumar V. 2014. Path and association analysis and stress indices for salinity tolerance traits in promising rice (Oryza sativa L.) genotypes. Cereal Res Commun, 42(3): 474-483. |
| [33] | Krishnamurthy S L, Gautam R K, Sharma P C, Sharma D K. 2016a. Effect of different salt stresses on agro-morphological traits and utilisation of salt stress indices for reproductive stage salt tolerance in rice. Field Crops Res, 190: 26-33. |
| [34] | Krishnamurthy S L, Sharma S K, Kumar V, Tiwari S, Singh N K. 2016b. Analysis of genomic region spanning Saltol using SSR markers in rice genotypes showing differential seedlings stage salt tolerance. J Plant Biochem Biotechnol, 25(3): 331-336. |
| [35] | Krishnamurthy S L, Sharma P C, Batra V, Kumar V, Rao L S. 2016c. Effect of salinity and use of stress indices of morphological and physiological traits at the seedling stage in rice. Ind J Exp Biol, 54(12): 843-850. |
| [36] |
Krishnamurthy S L, Pundir P, Warraich A S, Rathor S, Lokeshkumar B M, Singh N K, Sharma P C. 2020. Introgressed Saltol QTL lines improves the salinity tolerance in rice at seedling stage. Front Plant Sci, 11: 833.
PMID |
| [37] | Krishnamurthy S L, Sharma P C, Dewan D, Lokeshkumar B M, Rathor S, Warraich A S, Vinaykumar N M, Leung H, Singh R K. 2022. Genome wide association study of MAGIC population reveals a novel QTL for salinity and sodicity tolerance in rice. Physiol Mol Biol Plants, 28(4): 819-835. |
| [38] | Latif R, Imran M, Khalid R. 2009. Effect of NaCl salinity on ionic composition of rice. Pak J Agric Res, 22(4): 161-164. |
| [39] | Lee K S, Choi W Y, Ko J C, Kim T S, Gregorio G B. 2003. Salinity tolerance of japonica and indica rice (Oryza sativa L.) at the seedling stage. Planta, 216(6): 1043-1046. |
| [40] | Levent Tuna A, Kaya C, Ashraf M, Altunlu H, Yokas I, Yagmur B. 2007. The effects of calcium sulphate on growth, membrane stability and nutrient uptake of tomato plants grown under salt stress. Environ Exp Bot, 59(2): 173-178. |
| [41] | Liu Z Y, Shi J J, Zhang L W, Huang J F. 2010. Discrimination of rice panicles by hyperspectral reflectance data based on principal component analysis and support vector classification. J Zhejiang Univ Sci B, 11(1): 71-78. |
| [42] | Lutts S, Kinet J M, Bouharmont J. 1995. Changes in plant response to NaCl during development of rice (Oryza sativa L.) varieties differing in salinity resistance. J Exp Bot, 46(12): 1843-1852. |
| [43] | Ma Q, Bao A K, Chai W W, Wang W Y, Zhang J L, Li Y X, Wang S M. 2016. Transcriptomic analysis of the succulent xerophyte Zygophyllum xanthoxylum in response to salt treatment and osmotic stress. Plant Soil, 402(1/2): 343-361. |
| [44] | Machado R M A, Serralheiro R P. 2017. Soil salinity: Effect on vegetable crop growth. Management practices to prevent and mitigate soil salinization. Horticulturae, 3(2): 30. |
| [45] | Mahmood-ur-Rahman, Ijaz M, Qamar S, Bukhari S A, Malik K. 2019. Abiotic stress signaling in rice crop. In: Hasanuzzaman M, Fujita M, Nahar K, Biswas J K. Advances in Rice Research for Abiotic Stress Tolerance. Amsterdam: Elsevier: 551-569. |
| [46] |
Mazid M S, Rafii M Y, Hanafi M M, Rahim H A, Latif M A. 2013. Genetic variation, heritability, divergence and biomass accumulation of rice genotypes resistant to bacterial blight revealed by quantitative traits and ISSR markers. Physiol Plant, 149(3): 432-447.
PMID |
| [47] | Mazumder A, Rohilla M, Bisht D S, Krishnamurthy S L, Barman M, Sarma R N, Sharma T R, Mondal T K. 2020. Identification and mapping of quantitative trait loci (QTL) and epistatic QTL for salinity tolerance at seedling stage in traditional aromatic short grain rice landrace Kolajoha (Oryza sativa L.) of Assam, India. Euphytica, 216(5): 75. |
| [48] |
McCartney C A, Somers D J, Fedak G, Cao W. 2004. Haplotype diversity at fusarium head blight resistance QTLs in wheat. Theor Appl Genet, 109(2): 261-271.
PMID |
| [49] | Mohammadi-Nejad G, Singh R K, Arzani A, Rezaie A M, Sabouri H, Gregorio G B. 2010. Evaluation of salinity tolerance in rice genotypes. Int J Plant Prod, 4: 199-208. |
| [50] | Moradi F, Ismail A M. 2007. Responses of photosynthesis, chlorophyll fluorescence and ROS-scavenging systems to salt stress during seedling and reproductive stages in rice. Ann Bot, 99(6): 1161-1173. |
| [51] |
Munns R, Tester M. 2008. Mechanisms of salinity tolerance. Annu Rev Plant Biol, 59: 651-681.
PMID |
| [52] | Negrão S, Schmöckel S M, Tester M. 2017. Evaluating physiological responses of plants to salinity stress. Ann Bot, 119(1): 1-11. |
| [53] | Niones J M. 2004. Fine mapping of the salinity tolerance gene on chromosome 1 of rice (Oryza sativa L.) using near isogenic lines. Los Baños, Laguna, the Philippines: University of the Philippines. |
| [54] |
Pires I S, Negrão S, Oliveira M M, Purugganan M D. 2015. Comprehensive phenotypic analysis of rice (Oryza sativa) response to salinity stress. Physiol Plant, 155(1): 43-54.
PMID |
| [55] | Pundir P, Devi A, Krishnamurthy S L, Sharma P C, Vinaykumar N M. 2021. QTLs in salt rice variety CSR10 reveals salinity tolerance at reproductive stage. Acta Physiol Plant, 43(2): 1-15. |
| [56] | Rahman M A, Thomson M J, Shah-E-Alam M, de Ocampo M, Egdane J, Ismail A M. 2016. Exploring novel genetic sources of salinity tolerance in rice through molecular and physiological characterization. Ann Bot, 117(6): 1083-1097. |
| [57] | Ravikiran K T, Krishnamurthy S L, Warraich A S, Sharma P C. 2018. Diversity and haplotypes of rice genotypes for seedling stage salinity tolerance analyzed through morpho-physiological and SSR markers. Field Crops Res, 220: 10-18. |
| [58] | Reddy I N B L, Kim B K, Yoon I S, Kim K H, Kwon T R. 2017. Salt tolerance in rice: Focus on mechanisms and approaches. Rice Sci, 24(3): 123-144. |
| [59] | Ren Z H, Gao J P, Li L G, Cai X L, Huang W, Chao D Y, Zhu M Z, Wang Z Y, Luan S, Lin H X. 2005. A rice quantitative trait locus for salt tolerance encodes a sodium transporter. Nat Genet, 37(10): 1141-1146. |
| [60] | Samal R, Roy P S, Dash A K, Rao G J N, Bharathkumar S, Subudhi H N, Reddy J N. 2016. Genetic diversity in the rice landraces (Oryza sativa L.) of coastal Sundarbans (India) and their adaptation to the local saline condition investigated both at molecular and physiological level. Acta Physiol Plant, 38(2): 56. |
| [61] |
Shabala S, Pottosin I. 2014. Regulation of potassium transport in plants under hostile conditions: Implications for abiotic and biotic stress tolerance. Physiol Plant, 151(3): 257-279.
PMID |
| [62] | Singh R K, Flowers T J. 2010. The physiology and molecular biology of the effects of salinity on rice. In: Pessarakli M. Handbook of Plant and Crop Stress. 3rd edn. Florida, USA: Taylor and Francis: 901-942. |
| [63] | Singh S K, Kakani V G, Brand D, Baldwin B, Reddy K R. 2008. Assessment of cold and heat tolerance of winter-grown canola (Brassica napus L.) cultivars by pollen-based parameters. J Agron Crop Sci, 194(3): 225-236. |
| [64] |
Suzuki R, Shimodaira H. 2006. Pvclust: An R package for assessing the uncertainty in hierarchical clustering. Bioinformatics, 22(12): 1540-1542.
PMID |
| [65] | Tahjib-Ul-Arif M, Abu Sayed M, Islam M M, Siddiqui M N, Begum S N, Hossain M A. 2018. Screening of rice landraces (Oryza sativa L.) for seedling stage salinity tolerance using morpho-physiological and molecular markers. Acta Physiol Plant, 40(4): 70. |
| [66] | Tatar Ö, Brueck H, Gevrek M N, Asch F. 2010. Physiological responses of two Turkish rice (Oryza sativa L.) varieties to salinity. Turk J Agric For, 34(6): 451-459. |
| [67] | Tiwari S, Krishnamurthy SL, Kumar V, Singh B, Rao A R, Amitha Mithra S, Rai V, Singh A K, Singh N K. 2015. Mapping QTLs for salt tolerance in rice (Oryza sativa L.) by bulked segregant analysis of recombinant inbred lines using 50K SNP chip. PLoS One, 11(4): e0153610. |
| [68] |
Tyczewska A, Wozniak E, Gracz J, Kuczynski J, Twardowski T. 2018. Towards food security: Current state and future prospects of agrobiotechnology. Trends Biotechnol, 36: 1219-1229.
PMID |
| [69] | Ward J H. 1963. Hierarchical grouping to optimize an objective function. J Am Stat Assoc, 58: 236-244. |
| [70] | Warriach A S, Krishnamurthy S L, Sooch B S, Vinaykumar N M, Dushyanthkumar B M, Bose J, Sharma P C. 2020. Rice GWAS reveals key genomic regions essential for salinity tolerance at reproductive stage. Acta Physiol Plant, 42: 1-15. |
| [71] | Warraich A S, Krishnamurthy S L, Sooch B S, Lokeshkumar B M, Vinaykumar N M, Dushyanthkumar B M, Rai V, Singh N K, Sharma P C. 2021. Population structure and association studies for reproductive stage salinity tolerance in rice (Oryza sativa L.). Ind J Exp Biol, 59(5): 328-338. |
| [72] | Yadav A K, Kumar A, Grover N, Ellur R K, Krishnan S G, Bollinedi H, Bhowmick P K, Vinod K K, Nagarajan M, Krishnamurthy S L, Singh A K. 2020. Marker aided introgression of ‘Saltol’, a major QTL for seedling stage salinity tolerance into an elite Basmati rice variety ‘Pusa Basmati 1509’. Sci Rep, 10(1): 13877. |
| [73] | Yeo A R, Flowers T J. 1986. Salinity resistance in rice (Oryza sativa L.) and a pyramiding approach to breeding varieties for saline soils. Aust J Plant Physiol, 13: 161-173. |
| [74] | Yoshida S, Forno D A, Cock J H, Gomez K A. 1976. Laboratory Manual for Physiological Studies of Rice. Manila, the Philippines: International Rice Research Institute. |
| [75] | Zheng K L, Subudhi P K, Domingo J, Magpantay G, Huang N. 1995. Rapid DNA isolation for marker assisted selection in rice breeding. Rice Genet Newsl, 12: 255-258. |
| [1] | Prathap V, Suresh KUMAR, Nand Lal MEENA, Chirag MAHESHWARI, Monika DALAL, Aruna TYAGI. Phosphorus Starvation Tolerance in Rice Through a Combined Physiological, Biochemical and Proteome Analysis [J]. Rice Science, 2023, 30(6): 8-. |
| [2] | Serena REGGI, Elisabetta ONELLI, Alessandra MOSCATELLI, Nadia STROPPA, Matteo Dell’ANNO, Kiril PERFANOV, Luciana ROSSI. Seed-Specific Expression of Apolipoprotein A-IMilano Dimer in Rice Engineered Lines [J]. Rice Science, 2023, 30(6): 6-. |
| [3] | Sundus ZAFAR, XU Jianlong. Recent Advances to Enhance Nutritional Quality of Rice [J]. Rice Science, 2023, 30(6): 4-. |
| [4] | Kankunlanach KHAMPUANG, Nanthana CHAIWONG, Atilla YAZICI, Baris DEMIRER, Ismail CAKMAK, Chanakan PROM-U-THAI. Effect of Sulfur Fertilization on Productivity and Grain Zinc Yield of Rice Grown under Low and Adequate Soil Zinc Applications [J]. Rice Science, 2023, 30(6): 9-. |
| [5] | FAN Fengfeng, CAI Meng, LUO Xiong, LIU Manman, YUAN Huanran, CHENG Mingxing, Ayaz AHMAD, LI Nengwu, LI Shaoqing. Novel QTLs from Wild Rice Oryza longistaminata Confer Rice Strong Tolerance to High Temperature at Seedling Stage [J]. Rice Science, 2023, 30(6): 14-. |
| [6] | LIN Shaodan, YAO Yue, LI Jiayi, LI Xiaobin, MA Jie, WENG Haiyong, CHENG Zuxin, YE Dapeng. Application of UAV-Based Imaging and Deep Learning in Assessment of Rice Blast Resistance [J]. Rice Science, 2023, 30(6): 10-. |
| [7] | Md. Forshed DEWAN, Md. AHIDUZZAMAN, Md. Nahidul ISLAM, Habibul Bari SHOZIB. Potential Benefits of Bioactive Compounds of Traditional Rice Grown in South and South-East Asia: A Review [J]. Rice Science, 2023, 30(6): 5-. |
| [8] | Raja CHAKRABORTY, Pratap KALITA, Saikat SEN. Phenolic Profile, Antioxidant, Antihyperlipidemic and Cardiac Risk Preventive Effect of Chakhao Poireiton (A Pigmented Black Rice) in High-Fat High-Sugar induced Rats [J]. Rice Science, 2023, 30(6): 11-. |
| [9] | LI Qianlong, FENG Qi, WANG Heqin, KANG Yunhai, ZHANG Conghe, DU Ming, ZHANG Yunhu, WANG Hui, CHEN Jinjie, HAN Bin, FANG Yu, WANG Ahong. Genome-Wide Dissection of Quan 9311A Breeding Process and Application Advantages [J]. Rice Science, 2023, 30(6): 7-. |
| [10] | JI Dongling, XIAO Wenhui, SUN Zhiwei, LIU Lijun, GU Junfei, ZHANG Hao, Tom Matthew HARRISON, LIU Ke, WANG Zhiqin, WANG Weilu, YANG Jianchang. Translocation and Distribution of Carbon-Nitrogen in Relation to Rice Yield and Grain Quality as Affected by High Temperature at Early Panicle Initiation Stage [J]. Rice Science, 2023, 30(6): 12-. |
| [11] | Nazaratul Ashifa Abdullah Salim, Norlida Mat Daud, Julieta Griboff, Abdul Rahim Harun. Elemental Assessments in Paddy Soil for Geographical Traceability of Rice from Peninsular Malaysia [J]. Rice Science, 2023, 30(5): 486-498. |
| [12] | Ammara Latif, Sun Ying, Pu Cuixia, Noman Ali. Rice Curled Its Leaves Either Adaxially or Abaxially to Combat Drought Stress [J]. Rice Science, 2023, 30(5): 405-416. |
| [13] | Liu Qiao, Qiu Linlin, Hua Yangguang, Li Jing, Pang Bo, Zhai Yufeng, Wang Dekai. LHD3 Encoding a J-Domain Protein Controls Heading Date in Rice [J]. Rice Science, 2023, 30(5): 437-448. |
| [14] | Lu Xuedan, Li Fan, Xiao Yunhua, Wang Feng, Zhang Guilian, Deng Huabing, Tang Wenbang. Grain Shape Genes: Shaping the Future of Rice Breeding [J]. Rice Science, 2023, 30(5): 379-404. |
| [15] | Zhang Guomei, Li Han, Liu Shanshan, Zhou Xuming, Lu Mingyang, Tang Liang, Sun Lihua. Water Extract of Rice False Smut Balls Activates Nrf2/HO-1 and Apoptosis Pathways, Causing Liver Injury [J]. Rice Science, 2023, 30(5): 473-485. |
| Viewed | ||||||
|
Full text |
|
|||||
|
Abstract |
|
|||||