Rice Science ›› 2024, Vol. 31 ›› Issue (5): 617-628.DOI: 10.1016/j.rsci.2024.04.007
• Research Papers • Previous Articles
Hong Weiyuan1,#, Li Ziqiu2,#, Feng Xiangqian1,3, Qin Jinhua1,3, Wang Aidong1, Jin Shichao4, Wang Danying1, Chen Song1( )
)
Received:2024-01-08
Accepted:2024-04-07
Online:2024-09-28
Published:2024-10-11
Contact:
Chen Song (chensong02@caas.cn)
About author:#These authors contributed equally to this study
Hong Weiyuan, Li Ziqiu, Feng Xiangqian, Qin Jinhua, Wang Aidong, Jin Shichao, Wang Danying, Chen Song. Estimating Key Phenological Dates of Multiple Rice Accessions Using Unmanned Aerial Vehicle-Based Plant Height Dynamics for Breeding[J]. Rice Science, 2024, 31(5): 617-628.
Add to citation manager EndNote|Ris|BibTeX
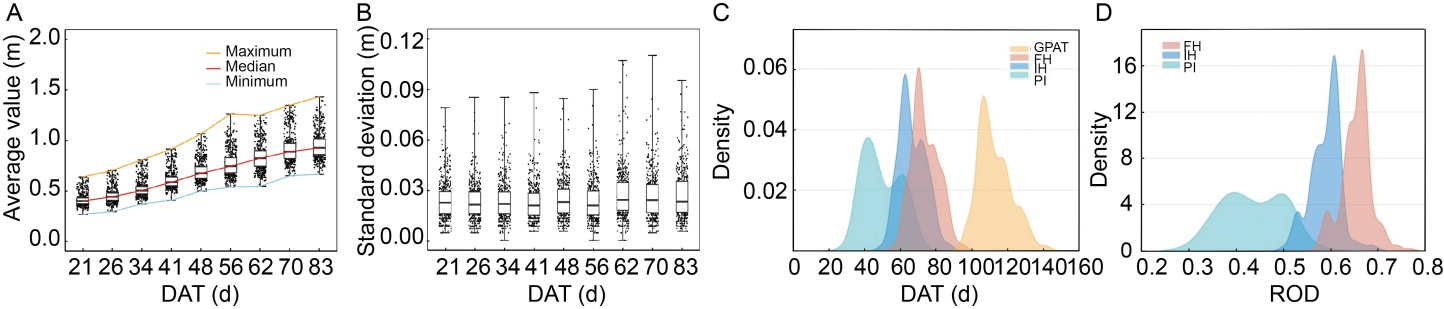
Fig. 1. Average value (A) and standard deviation (B) of measured plant height, and distribution of phenological dates (C) and ROD (D) in rice across 435 plots. GPAT, Growth period after transplanting; FH, Full heading; IH, Initial heading; PI, Panicle initiation; DAT, Days after transplanting; ROD, Relative occurrence date.
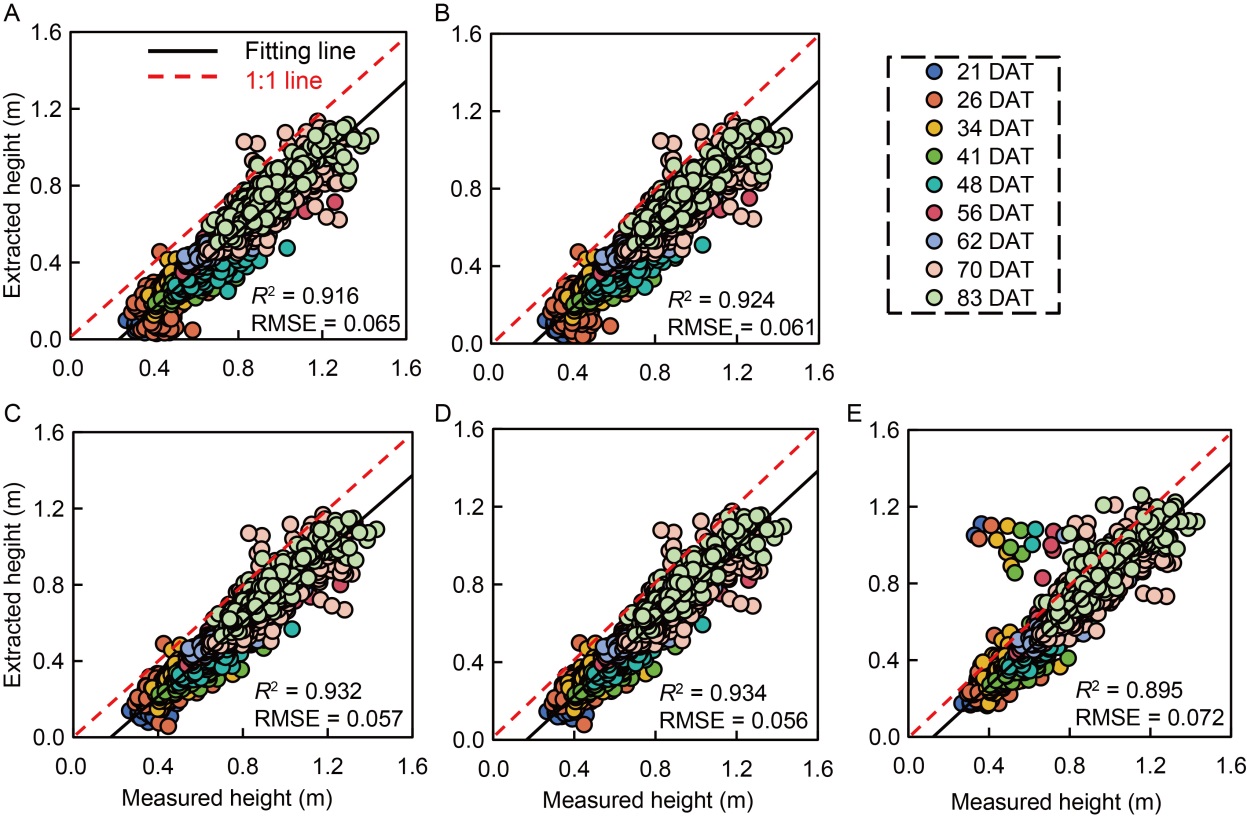
Fig. 2. Comparison of extracted and measured rice plant height using D-value in digital surface model based on the 50th (A), 70th (B), 90th (C), 95th (D), and the maximum (E) percentiles. DAT, Day after transplanting.
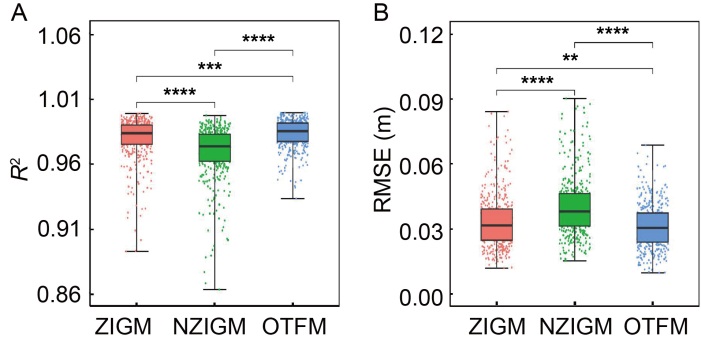
Fig. 3. Coefficient of determination (R2, A) and root mean square error (RMSE, B) of plant height curve fitted using zero initial growth rate (ZIGM), non-zero initial growth rate (NZIGM), and one-term Fourier model (OTFM) for 435 plots. **, P < 0.01; ***, P < 0.001; ****, P < 0.0001 (t-test).
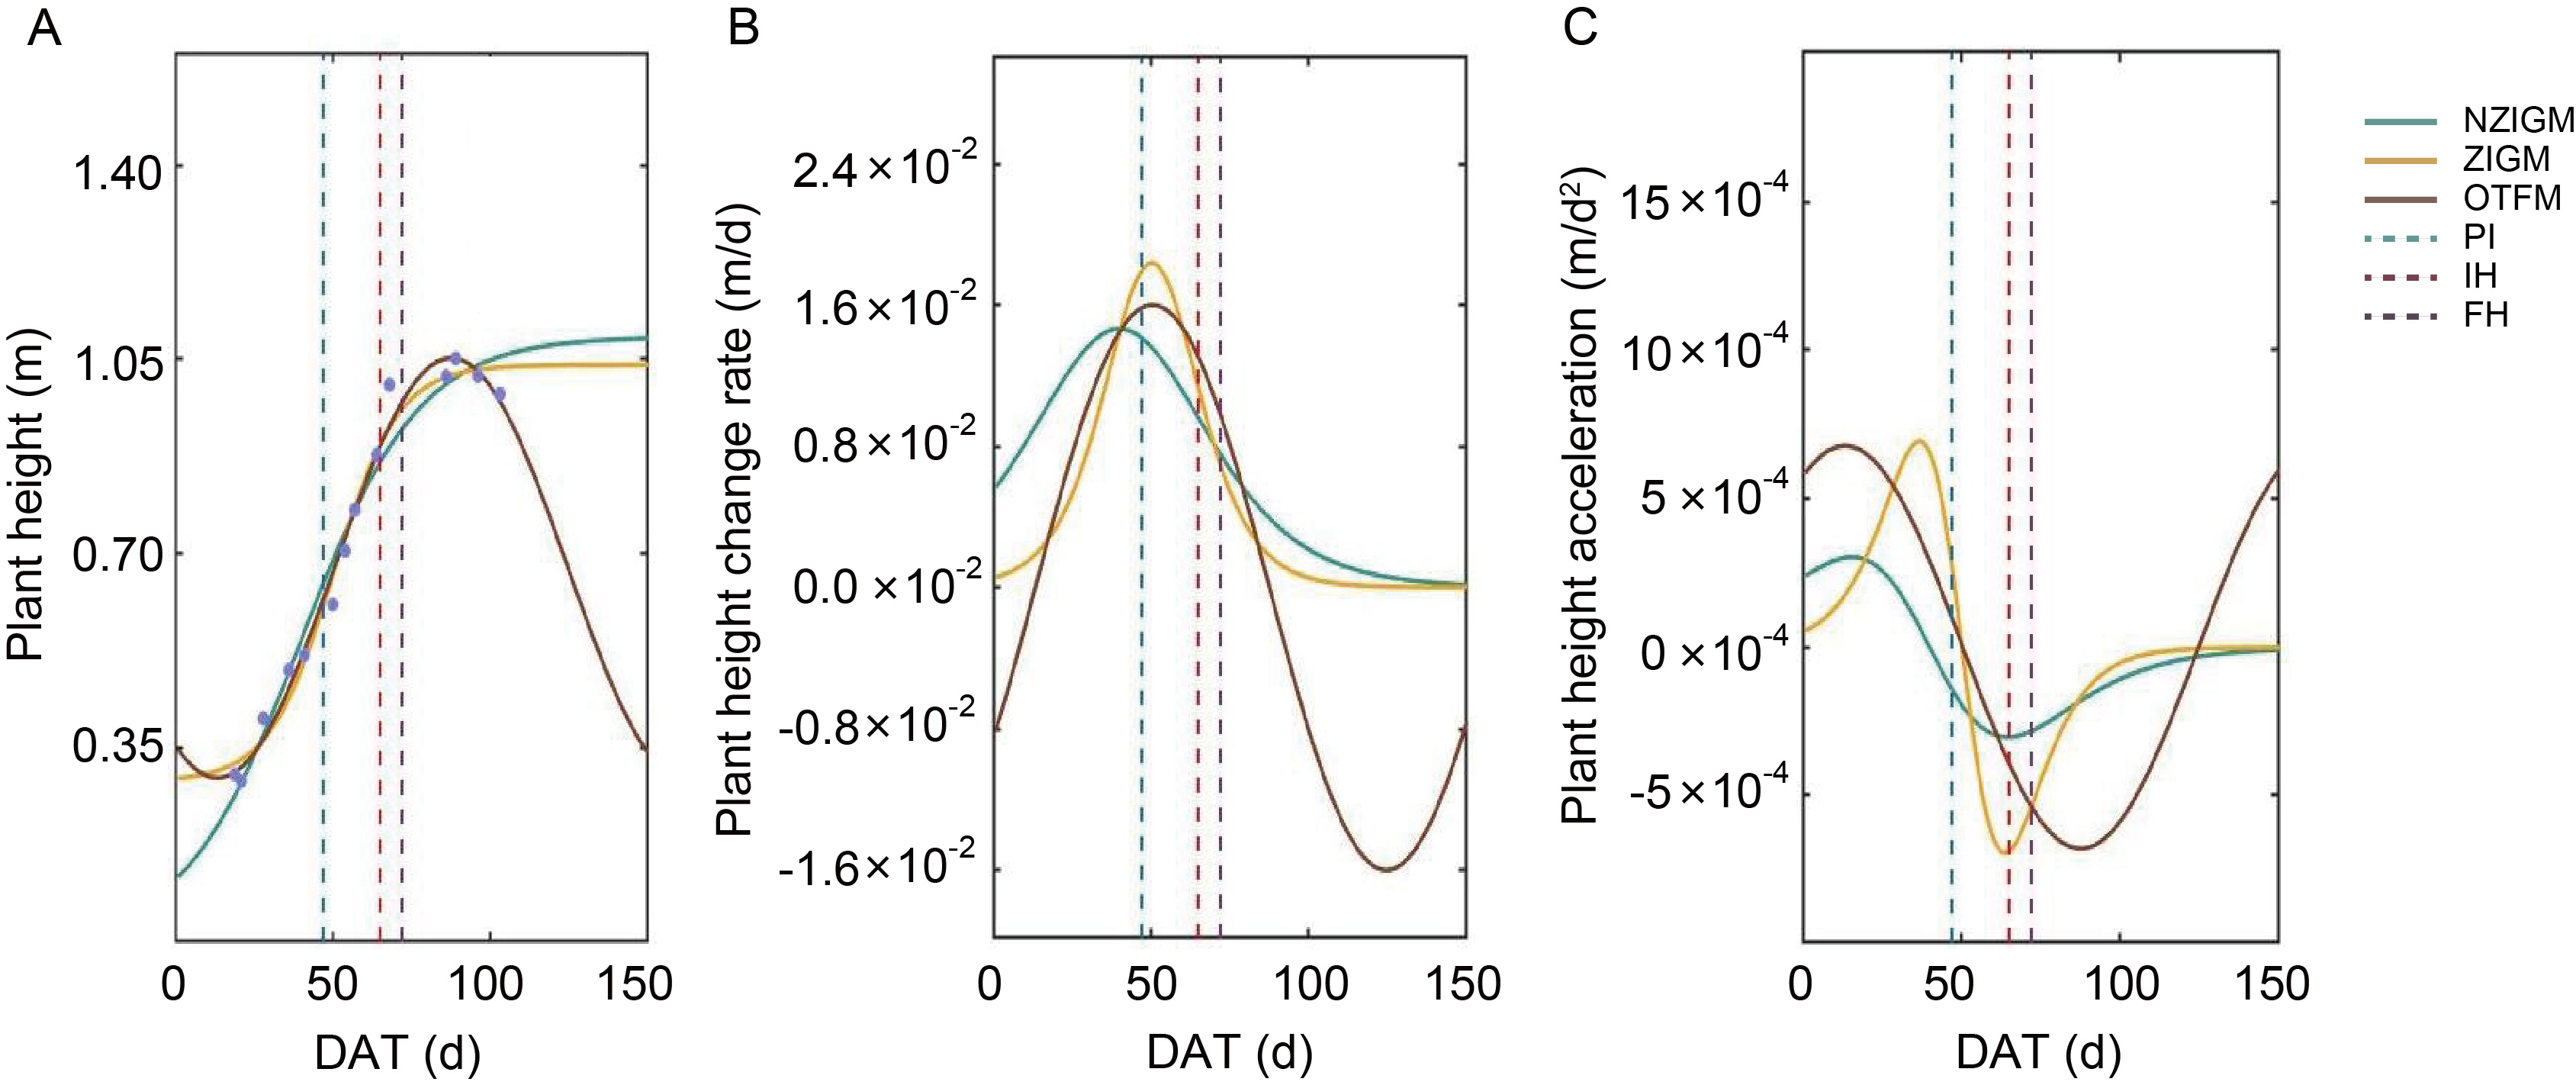
Fig. 4. Example of rice plant height curve (A) and its first (B) and second (C) derivative curves for zero initial growth rate (ZIGM), non-zero initial growth rate (NZIGM), and one-term Fourier model (OTFM). DAT, Day after transplanting; PI, Panicle initiation; IH, Initial heading; FH, Full heading.

Fig. 5. Correlation between phenological dates and agronomic traits, and extracted features. SDmax, The maximum value of the second derivative; FDmax, The maximum value of the first derivative; SDmin, The minimum value of the second derivative; ZIGM, Zero initial growth rate; NZIGM, Non-zero initial growth rate; OTFM, One-term Fourier model; GPAT, Growth period after transplanting; PH, Plant height; PI, Panicle initiation; IH, Initial heading; FH, Full heading. PI, IH, and FH were related to agronomic traits and extracted features by the Mantel test. Pairwise comparisons of agronomic traits and extracted features are shown with a color gradient denoting correlation coefficients. *, **, and *** represent significant correlations at the 0.05, 0.01, and 0.001 levels, respectively.
| Phenology | Feature combination | MLR | RF | SVR | LASSO | ENR | |||||||||
|---|---|---|---|---|---|---|---|---|---|---|---|---|---|---|---|
| R2 | RMSE (d) | R2 | RMSE (d) | R2 | RMSE (d) | R2 | RMSE (d) | R2 | RMSE (d) | ||||||
| PI | CFZIGM + GPAT | 0.777 | 5.031 | 0.830 | 4.385 | 0.786 | 4.932 | 0.763 | 5.187 | 0.752 | 5.300 | ||||
| CFNZIGM + GPAT | 0.777 | 5.026 | 0.834 | 4.344 | 0.780 | 4.990 | 0.762 | 5.192 | 0.748 | 5.348 | |||||
| CFOTFM + GPAT | 0.735 | 5.482 | 0.824 | 4.464 | 0.738 | 5.454 | 0.727 | 5.564 | 0.710 | 5.734 | |||||
| CFZIGM | 0.713 | 5.708 | 0.719 | 5.647 | 0.701 | 5.822 | 0.690 | 5.931 | 0.656 | 6.248 | |||||
| CFNZIGM | 0.671 | 6.106 | 0.692 | 5.913 | 0.665 | 6.163 | 0.651 | 6.293 | 0.629 | 6.485 | |||||
| CFOTFM | 0.598 | 6.750 | 0.682 | 6.009 | 0.595 | 6.779 | 0.614 | 6.615 | 0.582 | 6.884 | |||||
| IH | CFZIGM + GPAT | 0.838 | 3.127 | 0.877 | 2.721 | 0.837 | 3.139 | 0.802 | 3.454 | 0.776 | 3.681 | ||||
| CFNZIGM + GPAT | 0.845 | 3.062 | 0.877 | 2.727 | 0.845 | 3.062 | 0.806 | 3.425 | 0.776 | 3.677 | |||||
| CFOTFM + GPAT | 0.818 | 3.318 | 0.863 | 2.872 | 0.813 | 3.356 | 0.788 | 3.579 | 0.753 | 3.861 | |||||
| CFZIGM | 0.713 | 4.162 | 0.728 | 4.053 | 0.695 | 4.293 | 0.669 | 4.469 | 0.637 | 4.683 | |||||
| CFNZIGM | 0.680 | 4.396 | 0.704 | 4.224 | 0.665 | 4.495 | 0.642 | 4.649 | 0.620 | 4.790 | |||||
| CFOTFM | 0.628 | 4.742 | 0.721 | 4.105 | 0.629 | 4.734 | 0.630 | 4.726 | 0.595 | 4.942 | |||||
| FH | CFZIGM + GPAT | 0.843 | 3.116 | 0.883 | 2.694 | 0.845 | 3.101 | 0.809 | 3.438 | 0.774 | 3.738 | ||||
| CFNZIGM + GPAT | 0.851 | 3.034 | 0.882 | 2.702 | 0.848 | 3.067 | 0.811 | 3.416 | 0.776 | 3.719 | |||||
| CFOTFM + GPAT | 0.829 | 3.251 | 0.869 | 2.846 | 0.827 | 3.273 | 0.798 | 3.535 | 0.758 | 3.871 | |||||
| CFZIGM | 0.700 | 4.310 | 0.719 | 4.170 | 0.682 | 4.433 | 0.656 | 4.612 | 0.624 | 4.825 | |||||
| CFNZIGM | 0.672 | 4.504 | 0.694 | 4.353 | 0.654 | 4.628 | 0.632 | 4.772 | 0.609 | 4.916 | |||||
| CFOTFM | 0.629 | 4.790 | 0.716 | 4.190 | 0.623 | 4.833 | 0.627 | 4.804 | 0.592 | 5.022 | |||||
Table 1. Coefficient of determination (R2) and root mean square error (RMSE) for estimation of PI, IH, and FH using different combinations and machine learning algorithms.
| Phenology | Feature combination | MLR | RF | SVR | LASSO | ENR | |||||||||
|---|---|---|---|---|---|---|---|---|---|---|---|---|---|---|---|
| R2 | RMSE (d) | R2 | RMSE (d) | R2 | RMSE (d) | R2 | RMSE (d) | R2 | RMSE (d) | ||||||
| PI | CFZIGM + GPAT | 0.777 | 5.031 | 0.830 | 4.385 | 0.786 | 4.932 | 0.763 | 5.187 | 0.752 | 5.300 | ||||
| CFNZIGM + GPAT | 0.777 | 5.026 | 0.834 | 4.344 | 0.780 | 4.990 | 0.762 | 5.192 | 0.748 | 5.348 | |||||
| CFOTFM + GPAT | 0.735 | 5.482 | 0.824 | 4.464 | 0.738 | 5.454 | 0.727 | 5.564 | 0.710 | 5.734 | |||||
| CFZIGM | 0.713 | 5.708 | 0.719 | 5.647 | 0.701 | 5.822 | 0.690 | 5.931 | 0.656 | 6.248 | |||||
| CFNZIGM | 0.671 | 6.106 | 0.692 | 5.913 | 0.665 | 6.163 | 0.651 | 6.293 | 0.629 | 6.485 | |||||
| CFOTFM | 0.598 | 6.750 | 0.682 | 6.009 | 0.595 | 6.779 | 0.614 | 6.615 | 0.582 | 6.884 | |||||
| IH | CFZIGM + GPAT | 0.838 | 3.127 | 0.877 | 2.721 | 0.837 | 3.139 | 0.802 | 3.454 | 0.776 | 3.681 | ||||
| CFNZIGM + GPAT | 0.845 | 3.062 | 0.877 | 2.727 | 0.845 | 3.062 | 0.806 | 3.425 | 0.776 | 3.677 | |||||
| CFOTFM + GPAT | 0.818 | 3.318 | 0.863 | 2.872 | 0.813 | 3.356 | 0.788 | 3.579 | 0.753 | 3.861 | |||||
| CFZIGM | 0.713 | 4.162 | 0.728 | 4.053 | 0.695 | 4.293 | 0.669 | 4.469 | 0.637 | 4.683 | |||||
| CFNZIGM | 0.680 | 4.396 | 0.704 | 4.224 | 0.665 | 4.495 | 0.642 | 4.649 | 0.620 | 4.790 | |||||
| CFOTFM | 0.628 | 4.742 | 0.721 | 4.105 | 0.629 | 4.734 | 0.630 | 4.726 | 0.595 | 4.942 | |||||
| FH | CFZIGM + GPAT | 0.843 | 3.116 | 0.883 | 2.694 | 0.845 | 3.101 | 0.809 | 3.438 | 0.774 | 3.738 | ||||
| CFNZIGM + GPAT | 0.851 | 3.034 | 0.882 | 2.702 | 0.848 | 3.067 | 0.811 | 3.416 | 0.776 | 3.719 | |||||
| CFOTFM + GPAT | 0.829 | 3.251 | 0.869 | 2.846 | 0.827 | 3.273 | 0.798 | 3.535 | 0.758 | 3.871 | |||||
| CFZIGM | 0.700 | 4.310 | 0.719 | 4.170 | 0.682 | 4.433 | 0.656 | 4.612 | 0.624 | 4.825 | |||||
| CFNZIGM | 0.672 | 4.504 | 0.694 | 4.353 | 0.654 | 4.628 | 0.632 | 4.772 | 0.609 | 4.916 | |||||
| CFOTFM | 0.629 | 4.790 | 0.716 | 4.190 | 0.623 | 4.833 | 0.627 | 4.804 | 0.592 | 5.022 | |||||
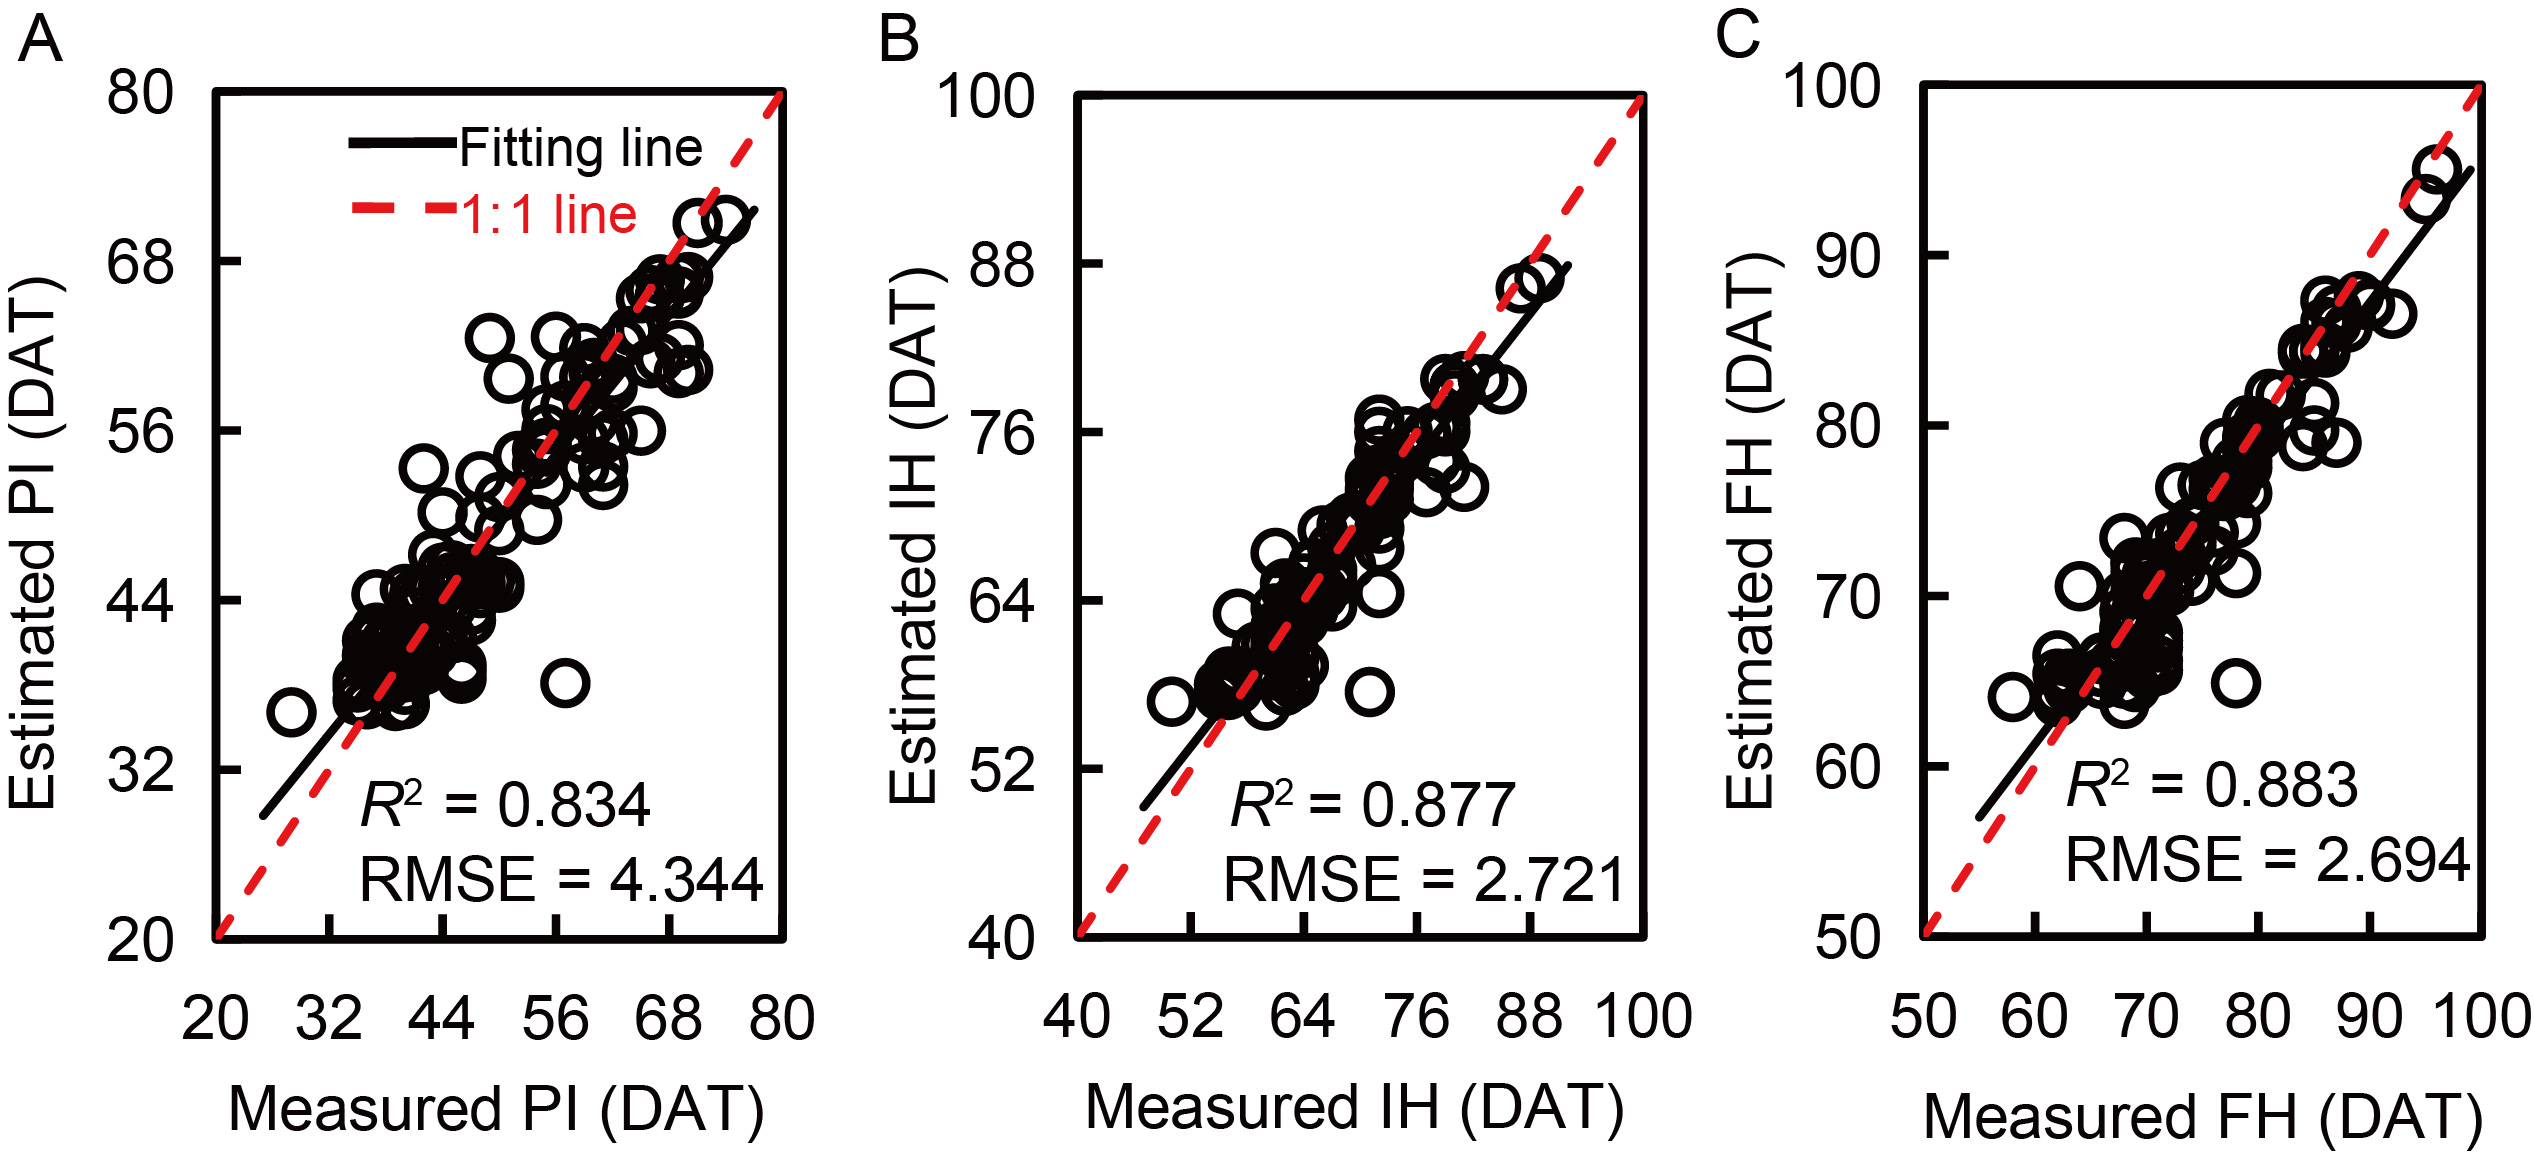
Fig. 6. Scatterplots of measured phenological date vs estimated phenological date for PI (A), IH (B), and FH (C) based on best feature combination with random forest. PI, Panicle initiation; IH, Initial heading; FH, Full heading; DAT, Days after transplanting (d).
| [1] | Awan T H, Chauhan B S, Cruz P C S. 2014. Physiological and morphological responses of Ischaemum rugosum salisb. (wrinkled grass) to different nitrogen rates and rice seeding rates. PLoS One, 9(6): e98255. |
| [2] | Awan T H, Sta Cruz P C, Chauhan B S. 2015. Ecological significance of rice (Oryza sativa) planting density and nitrogen rates in managing the growth and competitive ability of itchgrass (Rottboellia cochinchinensis) in direct-seeded rice systems. J Pest Sci, 88(2): 427-438. |
| [3] |
Bai H Z, Xiao D P, Zhang H, Tao F L, Hu Y H. 2019. Impact of warming climate, sowing date, and cultivar shift on rice phenology across China during 1981-2010. Int J Biometeorol, 63(8): 1077-1089.
DOI PMID |
| [4] | Bendig J, Yu K, Aasen H, Bolten A, Bennertz S, Broscheit J, Gnyp M L, Bareth G. 2015. Combining UAV-based plant height from crop surface models, visible, and near infrared vegetation indices for biomass monitoring in barley. Int J Appl Earth Obs Geoinf, 39: 79-87. |
| [5] | Bhardwaj A, Devi P, Chaudhary S, Rani A, Jha U C, Kumar S, Bindumadhava H, Prasad P V V, Sharma K D, Siddique K H M, Nayyar H. 2022. ‘Omics’ approaches in developing combined drought and heat tolerance in food crops. Plant Cell Rep, 41(3): 699-739. |
| [6] | Bouman B, Kropff M, Tuong T P, Wopereis M C S, Berge H, Laar H H. 2003. ORYZA2000: Modeling Lowland Rice. Los Baños, the Philippines: International Rice Research Institute. |
| [7] | Cao J, Jing Q, Zhu Y, Liu X J, Zhuang S, Chen Q C, Cao W X. 2009. A knowledge-based model for nitrogen management in rice and wheat. Plant Prod Sci, 12(1): 100-108. |
| [8] | Cao R Y, Chen J, Shen M G, Tang Y H. 2015. An improved logistic method for detecting spring vegetation phenology in grasslands from MODIS EVI time-series data. Agric For Meteorol, 200: 9-20. |
| [9] | Chen W G, Sun D Z, Li R Z, Wang S G, Shi Y G, Zhang W J, Jing R L. 2020. Mining the stable quantitative trait loci for agronomic traits in wheat (Triticum aestivum L.) based on an introgression line population. BMC Plant Biol, 20(1): 275. |
| [10] | Deng X S, Tang G, Wang Q Y, Luo L X, Long S C. 2022. A method for forest vegetation height modeling based on aerial digital orthophoto map and digital surface model. IEEE Trans Geosci Remote Sens, 60: 4404307. |
| [11] | Dou Z, Tang S, Li G H, Liu Z H, Ding C Q, Chen L, Wang S H, Ding Y F. 2017. Application of nitrogen fertilizer at heading stage improves rice quality under elevated temperature during grain-filling stage. Crop Sci, 57(4): 2183-2192. |
| [12] | Du G Z, Qi W. 2010. Trade-offs between flowering time, plant height, and seed size within and across 11 communities of a QingHai-Tibetan flora. Plant Ecol, 209(2): 321-333. |
| [13] | Ge H X, Ma F, Li Z W, Tan Z Z, Du C W. 2021. Improved accuracy of phenological detection in rice breeding by using ensemble models of machine learning based on UAV-RGB imagery. Remote Sens-Basel, 13(14): 2678. |
| [14] | Gong Y, Yang K L, Lin Z H, Fang S H, Wu X T, Zhu R S, Peng Y. 2021. Remote estimation of leaf area index (LAI) with unmanned aerial vehicle (UAV) imaging for different rice cultivars throughout the entire growing season. Plant Methods, 17(1): 88. |
| [15] | Guo Y H, Xiao Y, Li M W, Hao F H, Zhang X, Sun H Y, de Beurs K, Fu Y H, He Y H. 2022. Identifying crop phenology using maize height constructed from multi-sources images. Int J Appl Earth Obs Geoinf, 115: 103121. |
| [16] |
Han L, Yang G J, Dai H Y, Xu B, Yang H, Feng H K, Li Z H, Yang X D. 2019. Modeling maize above-ground biomass based on machine learning approaches using UAV remote-sensing data. Plant Methods, 15: 10.
DOI PMID |
| [17] | Hayes M J, Decker W L. 1998. Using satellite and real-time weather data to predict maize production. Int J Biometeorol, 42(1): 10-15. |
| [18] |
Hein N T, Ciampitti I A, Jagadish S V K. 2021. Bottlenecks and opportunities in field-based high-throughput phenotyping for heat and drought stress. J Exp Bot, 72(14): 5102-5116.
DOI PMID |
| [19] | Hmimina G, Dufrêne E, Pontailler J Y, Delpierre N, Aubinet M, Caquet B, de Grandcourt A, Burban B, Flechard C, Granier A, Gross P, Heinesch B, Longdoz B, Moureaux C, Ourcival J M, Rambal S, Saint André L, Soudani K. 2013. Evaluation of the potential of MODIS satellite data to predict vegetation phenology in different biomes: An investigation using ground-based NDVI measurements. Remote Sens Environ, 132: 145-158. |
| [20] | Inoue Y, Sakaiya E, Wang C Z. 2014. Capability of C-band back- scattering coefficients from high-resolution satellite SAR sensors to assess biophysical variables in paddy rice. Remote Sens Environ, 140: 257-266. |
| [21] | Iqbal F, Lucieer A, Barry K, Wells R. 2017. Poppy crop height and capsule volume estimation from a single UAS flight. Remote Sens, 9(7): 647. |
| [22] | Jeyaraj P R, Asokan S P, Samuel Nadar E R. 2022. Computer-assisted real-time rice variety learning using deep learning network. Rice Sci, 29(5): 489-498. |
| [23] | Jiang S, Jiang C, Jiang W S. 2020. Efficient structure from motion for large-scale UAV images: A review and a comparison of SfM tools. ISPRS J Photogramm Remote Sens, 167: 230-251. |
| [24] | Jin S C, Su Y J, Zhang Y G, Song S L, Li Q, Liu Z H, Ma Q, Ge Y, Liu L L, Ding Y F, Baret F, Guo Q H. 2021. Exploring seasonal and circadian rhythms in structural traits of field maize from LiDAR time series. Plant Phenomics, 2021: 9895241. |
| [25] | Kubišta J, Surový P. 2021. Spatial resolution of unmanned aerial vehicles acquired imagery as a result of different processing conditions. Cent Eur For J, 67(3): 148-154. |
| [26] | Lee H, Hwang W, Jeong J, Yang S, Jeong N, Lee C, Choi M. 2021. Physiological causes of transplantation shock on rice growth inhibition and delayed heading. Sci Rep, 11(1): 16818. |
| [27] | Liang H, Li S, Zhang L, Xu C X, Lv Y H, Gao S J, Cao W D. 2022. Long-term green manuring enhances crop N uptake and reduces N losses in rice production system. Soil Tillage Res, 220: 105369. |
| [28] | Lin S D, Yao Y, Li J Y, Li X B, Ma J, Weng H Y, Cheng Z X, Ye D P. 2023. Application of UAV-based imaging and deep learning in assessment of rice blast resistance. Rice Sci, 30(6): 652-660. |
| [29] | Liu R G, Shang R, Liu Y, Lu X L. 2017. Global evaluation of gap-filling approaches for seasonal NDVI with considering vegetation growth trajectory, protection of key point, noise resistance and curve stability. Remote Sens Environ, 189: 164-179. |
| [30] | Lyu M Q, Lu X Q, Shen Y T, Tan Y Y, Wan L, Shu Q Y, He Y H, He Y, Cen H Y. 2023. UAV time-series imagery with novel machine learning to estimate heading dates of rice accessions for breeding. Agric For Meteorol, 341: 109646. |
| [31] | Madsen D N, Hansen J P. 2019. Outlook of solar energy in Europe based on economic growth characteristics. Renew Sustain Energy Rev, 114: 109306. |
| [32] |
Malosetti M, Visser R G F, Celis-Gamboa C, van Eeuwijk F A. 2006. QTL methodology for response curves on the basis of non- linear mixed models, with an illustration to senescence in potato. Theor Appl Genet, 113(2): 288-300.
DOI PMID |
| [33] |
Montesano P M, Neigh C S R, Wagner W, Wooten M, Cook B D. 2019. Boreal canopy surfaces from spaceborne stereogrammetry. Remote Sens Environ, 225: 148-159.
DOI |
| [34] | Palacios-Orueta A, Huesca M, Whiting M L, Litago J, Khanna S, Garcia M, Ustin S L. 2012. Derivation of phenological metrics by function fitting to time-series of Spectral Shape Indexes AS1 and AS2: Mapping cotton phenological stages using MODIS time series. Remote Sens Environ, 126: 148-159. |
| [35] | Rashid M, Bari B S, Yusup Y, Kamaruddin M A, Khan N. 2021. A comprehensive review of crop yield prediction using machine learning approaches with special emphasis on palm oil yield prediction. IEEE Access, 9: 63406-63439. |
| [36] | Rezaei E E, Siebert S, Hüging H, Ewert F. 2018. Climate change effect on wheat phenology depends on cultivar change. Sci Rep, 8(1): 4891. |
| [37] | Richards T J, Karacic A, Apuli R P, Weih M, Ingvarsson P K, Rönnberg-Wästljung A C. 2020. Quantitative genetic architecture of adaptive phenology traits in the deciduous tree, Populus trichocarpa (Torr. and Gray). Heredity, 125: 449-458. |
| [38] | Sangjan W, McGee R J, Sankaran S. 2022. Optimization of UAV- based imaging and image processing orthomosaic and point cloud approaches for estimating biomass in a forage crop. Remote Sens, 14(10): 2396. |
| [39] | Schober T, Präger A, Hartung J, Hensmann F, Graeff-Hönninger S. 2023. Growth dynamics and yield formation of Cannabis (Cannabis sativa) cultivated in differing growing media under semi-controlled greenhouse conditions. Ind Crops Prod, 203: 117172. |
| [40] | Shang R, Liu R G, Xu M Z, Liu Y, Zuo L, Ge Q S. 2017. The relationship between threshold-based and inflexion-based approaches for extraction of land surface phenology. Remote Sens Environ, 199: 167-170. |
| [41] | Shi P H, Tang L, Wang L H, Sun T, Liu L L, Cao W X, Zhu Y. 2015. Post-heading heat stress in rice of South China during 1981-2010. PLoS One, 10(6): e0130642. |
| [42] | Shi Z, Chang T G, Chen G Y, Song Q F, Wang Y J, Zhou Z W, Wang M Y, Qu M N, Wang B S, Zhu X G. 2019. Dissection of mechanisms for high yield in two elite rice cultivars. Field Crops Res, 241: 107563. |
| [43] | Sisheber B, Marshall M, Mengistu D, Nelson A. 2023. Detecting the long-term spatiotemporal crop phenology changes in a highly fragmented agricultural landscape. Agric For Meteorol, 340: 109601. |
| [44] | Stone L F, Heinemann A B. 2012. Simulation of nitrogen management in upland rice with ORYZA/APSIM 2000 model. Rev Bras Eng Agric Ambient, 16(6): 611-617. |
| [45] | Sujariya S, Jongdee B, Shu F K. 2023. Estimation of flowering time and its effect on grain yield of photoperiod sensitive varieties in rainfed lowland rice in Northeast Thailand. Field Crops Res, 302: 109075. |
| [46] | Sun S C, Frelich L E. 2011. Flowering phenology and height growth pattern are associated with maximum plant height, relative growth rate and stem tissue mass density in herbaceous grassland species. J Ecol, 99(4): 991-1000. |
| [47] | Toktarova A, Gruber L, Hlusiak M, Bogdanov D, Breyer C. 2019. Long term load projection in high resolution for all countries globally. Int J Electr Power Energy Syst, 111: 160-181. |
| [48] | Tonnang H E, Salifu D, Mudereri B T, Tanui J, Espira A, Dubois T, Abdel-Rahman E M. 2022. Advances in data-collection tools and analytics for crop pest and disease management. Curr Opin Insect Sci, 54: 100964. |
| [49] | Wang H F, Ghosh A, Linquist B A, Hijmans R J. 2020. Satellite- based observations reveal effects of weather variation on rice phenology. Remote Sens, 12(9): 1522. |
| [50] |
Wang Y, Yang X D, Ali A, Lv G H, Long Y X, Wang Y Y, Ma Y G, Xu C C. 2020. Flowering phenology shifts in response to functional traits, growth form, and phylogeny of woody species in a desert area. Front. Plant Sci, 11: 536.
DOI PMID |
| [51] | Wei W J, Sivanantham S, Malingre L, Ramalho O, Mandin C. 2020. Predicting the rate constants of semivolatile organic compounds with hydroxyl radicals and ozone in indoor air. Environ Pollut, 266: 115050. |
| [52] | Wu D H, Chen C T, Yang M D, Wu Y C, Lin C Y, Lai M H, Yang C Y. 2022. Controlling the lodging risk of rice based on a plant height dynamic model. Bot Stud, 63(1): 25. |
| [53] | Xu F F, Tang F F, Shao Y F, Chen Y L, Tong C, Bao J S. 2014. Genotype × environment interactions for agronomic traits of rice revealed by association mapping. Rice Sci, 21(3): 133-141. |
| [54] | Xu Z Z, Shin B S, Klette R. 2015. Accurate and robust line segment extraction using minimum entropy with Hough transform. IEEE Trans Image Process, 24(3): 813-822. |
| [55] | Yang Z, Shao Y, Li K, Liu Q B, Liu L, Brisco B. 2017. An improved scheme for rice phenology estimation based on time-series multispectral HJ-1A/B and polarimetric RADARSAT-2 data. Remote Sens Environ, 195: 184-201. |
| [56] | Ye T, Zong S, Kleidon A, Yuan W P, Wang Y, Shi P J. 2019. Impacts of climate warming, cultivar shifts, and phenological dates on rice growth period length in China after correction for seasonal shift effects. Clim Change, 155(1): 127-143. |
| [57] | Zhang N, Xie Y D, Guo H J, Zhao L S, Xiong H C, Gu J Y, Li J H, Kong F Q, Sui L, Zhao Z W, Zhao S R, Liu L X. 2016. Gibberellins regulate the stem elongation rate without affecting the mature plant height of a quick development mutant of winter wheat (Triticum aestivum L.). Plant Physiol Biochem, 107: 228-236. |
| [58] | Zhang S, Tao F L, Zhang Z. 2017. Uncertainty from model structure is larger than that from model parameters in simulating rice phenology in China. Eur J Agron, 87: 30-39. |
| [59] | Zhao L C, Guo W, Wang J, Wang H Z, Duan Y L, Wang C, Wu W B, Shi Y. 2021. An efficient method for estimating wheat heading dates using UAV images. Remote Sens, 13(16): 3067. |
| [60] | Zheng C W, Abd-Elrahman A, Whitaker V. 2021. Remote sensing and machine learning in crop phenotyping and management, with an emphasis on applications in strawberry farming. Remote Sens, 13(3): 531. |
| [61] |
Zhong X H, Liang K M, Peng B L, Tian K, Li X J, Huang N R, Liu Y Z, Pan J F. 2020. Basal internode elongation of rice as affected by light intensity and leaf area. Crop J, 8(1): 62-70.
DOI |
| [62] | Zhou C M, Huang B D, Fränti P. 2022. A review of motion planning algorithms for intelligent robots. J Intell Manuf, 33(2): 387-424. |
| [1] | Sujeevan Rajendran, Hyeonseo Park, Jiyoung Kim, Soon Ju Park, Dongjin Shin, Jong-Hee Lee, Young Hun Song, Nam-Chon Paek, Chul Min Kim. Methane Emission from Rice Fields: Necessity for Molecular Approach for Mitigation [J]. Rice Science, 2024, 31(2): 159-178. |
| [2] | Lin Shaodan, Yao Yue, Li Jiayi, Li Xiaobin, Ma Jie, Weng Haiyong, Cheng Zuxin, Ye Dapeng. Application of UAV-Based Imaging and Deep Learning in Assessment of Rice Blast Resistance [J]. Rice Science, 2023, 30(6): 652-660. |
| [3] | Zhou Longfei, Meng Ran, Yu Xing, Liao Yigui, Huang Zehua, Lü Zhengang, Xu Binyuan, Yang Guodong, Peng Shaobing, Xu Le. Improved Yield Prediction of Ratoon Rice Using Unmanned Aerial Vehicle-Based Multi-Temporal Feature Method [J]. Rice Science, 2023, 30(3): 247-256. |
| [4] | Zongxiang Chen, Zhiming Feng, Houxiang Kang, Jianhua Zhao, Tianxiao Chen, Qianqian Li, Hongbing Gong, Yafang Zhang, Xijun Chen, Xuebiao Pan, Wende Liu, Guoliang Wang, Shimin Zuo. Identification of New Resistance Loci Against Sheath Blight Disease in Rice Through Genome-Wide Association Study [J]. Rice Science, 2019, 26(1): 21-31. |
| [5] | JIANG Jian-hua1, 2, CHEN Lan1, LIU Qiang-ming1, HE Ying-jun1, HONG De-lin1. Mining Elite Alleles of Growth Duration and Productive Panicle Number per Plant by Association Mapping with Conditional Phenotypic Value in Japonica Rice [J]. RICE SCIENCE, 2013, 20(3): 200-206. |
| [6] | LIANG Yong-shu, GAO Zhi-qiang, SHEN Xi-hong, ZHAN Xiao-deng, ZHANG Ying-xin, WU Wei-ming, CAO Li-yong, CHENG Shi-hua. Mapping and Comparative Analysis of QTL for Rice Plant Height Based on Different Sample Sizes within a Single Line in a RIL Population [J]. RICE SCIENCE, 2011, 18(4): 265-272. |
| [7] | JIANG Jian-hua, ZHAO Qi-bing, LIU Qiang-ming, CHEN Lan, CHEN Fu-long, QIAO Bao-jian, HONG De-lin. Mining Applicable Elite Alleles of Growing Duration, Plant Height and Panicle Number per Plant by Conditional QTL Mapping in Japonica Rice [J]. RICE SCIENCE, 2011, 18(3): 196-203. |
| [8] | PENG Tao, ZHONG Bing-qiang, LING Ying-hua, YANG Zheng-lin, ZHA Ren-ming, XIE Rong, LIU Cheng-yuan, HE Guang-hua. Developmental Genetics Analysis for Plant Height in indica Hybrid Rice Across Environments [J]. RICE SCIENCE, 2009, 16(2): 111-116 . |
| [9] | LIU Bin-mei, CHENG Can, WU Yue-jin, TONG Ji-ping, WU Jin-hua, ZHANG Ying, YUAN Qin. Effect of Dominant Semi-Dwarf Gene on Plant Height and Its Related Traits and Sensitivity to Gibberellic Acid in Rice [J]. RICE SCIENCE, 2006, 13(3): 179-184 . |
| [10] | HE Feng-hua, XI Zhang-ying, ZENG Rui-zhen, Akshay TALUKDAR, ZHANG Gui-quan. Identification of QTLs for Plant Height and Its Components by Using Single Segment Substitution Lines in Rice (Oryza sativa) [J]. RICE SCIENCE, 2005, 12(3): 151-156 . |
| Viewed | ||||||
|
Full text |
|
|||||
|
Abstract |
|
|||||