Rice Science ›› 2020, Vol. 27 ›› Issue (1): 67-74.DOI: 10.1016/j.rsci.2019.12.007
• Short Communication • Previous Articles Next Articles
Kartika Kartika1, Sakagami Jun-Ichi2( ), Lakitan Benyamin3,4(), Yabuta Shin2, Wijaya Andi3, Kadir Sabaruddin5, Ilman Widuri Laily1, Siaga Erna1, Nakao Yoshihiro6
Received:2018-07-16
Accepted:2018-12-04
Online:2020-01-28
Published:2019-09-30
Kartika Kartika, Sakagami Jun-Ichi, Lakitan Benyamin, Yabuta Shin, Wijaya Andi, Kadir Sabaruddin, Ilman Widuri Laily, Siaga Erna, Nakao Yoshihiro. Morpho-Physiological Response of Oryza glaberrima to Gradual Soil Drying[J]. Rice Science, 2020, 27(1): 67-74.
Add to citation manager EndNote|Ris|BibTeX
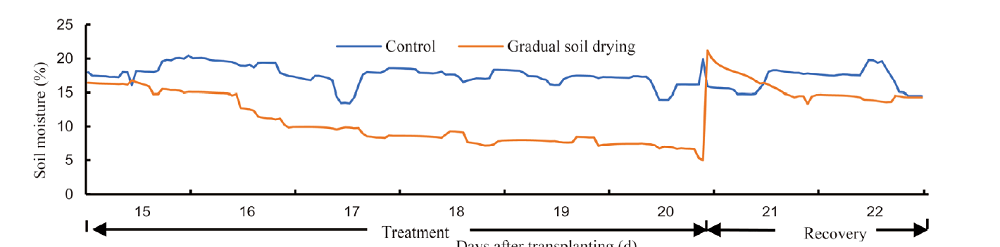
Fig. 1. Soil moisture records during experiment.
| Genotype | Start of treatment | End of treatment | Recovery | ||||||||
|---|---|---|---|---|---|---|---|---|---|---|---|
| Control (C) | Drought (D) | D/C ratio | Control (C) | Drought (D) | D/C ratio | Control (C) | Drought (D) | D/C ratio | |||
| RAM12 | 22.4 ± 2.0 | 27.1 ± 1.6 | 1.2 ns | 30.4 ± 0.4 | 34.3 ± 0.9 | 1.1 ** | 33.2 ± 0.4 | 35.9 ± 0.9 | 1.1 * | ||
| RAM14 | 25.2 ± 3.8 | 32.6 ± 0.8 | 1.3 ns | 33.9 ± 2.5 | 36.9 ± 1.3 | 1.1 ns | 34.3 ± 2.5 | 36.7 ± 2.1 | 1.1 ns | ||
| RAM59 | 26.8 ± 2.7 | 32.8 ± 0.9 | 1.2 ns | 37.4 ± 1.6 | 37.2 ± 1.0 | 1.0 ns | 37.1 ± 1.6 | 38.3 ± 0.9 | 1.0 ns | ||
| RAM97 | 32.7 ± 2.8 | 30.0 ± 0.6 | 0.9 ns | 36.3 ± 0.5 | 36.6 ± 0.9 | 1.0 ns | 37.5 ± 0.5 | 37.4 ± 0.3 | 1.0 ns | ||
| RAM101 | 34.0 ± 0.8 | 34.6 ± 0.6 | 1.0 ns | 37.1 ± 4.7 | 37.7 ± 0.8 | 1.0 ns | 30.9 ± 4.7 | 37.7 ± 1.1 | 1.2 ns | ||
| Average of O. glaberrima | 28.2 ± 2.4 | 31.4 ± 0.9 | 1.1 ns | 35.0 ± 1.1 | 36.5 ± 1.0 | 1.0 ns | 34.6 ± 1.9 | 37.2 ± 1.0 | 1.1 ns | ||
| Koshihikari | 9.9 ± 3.1 | 16.1 ± 5.5 | 1.6 ns | 26.4 ± 3.2 | 24.3 ± 1.6 | 0.9 ns | 26.8 ± 3.2 | 30.5 ± 1.8 | 1.1 ns | ||
| Minamihatamochi | 30.2 ± 1.7 | 30.7 ± 3.0 | 1.8 ns | 41.7 ± 0.4 | 32.7 ± 2.2 | 0.8 * | 39.1 ± 0.4 | 37.3 ± 0.4 | 1.0 ns | ||
| Average of O. sativa | 20.0 ± 2.4 | 23.4 ± 4.2 | 1.3 ns | 34.1 ± 2.2 | 28.5 ± 1.9 | 0.9 ns | 33.0 ± 1.8 | 33.9 ± 1.5 | 1.0 ns | ||
Table 1 Effects of gradual soil drying on soil and plant analyzer development (SPAD) value of seven rice genotypes at different measurement times.
| Genotype | Start of treatment | End of treatment | Recovery | ||||||||
|---|---|---|---|---|---|---|---|---|---|---|---|
| Control (C) | Drought (D) | D/C ratio | Control (C) | Drought (D) | D/C ratio | Control (C) | Drought (D) | D/C ratio | |||
| RAM12 | 22.4 ± 2.0 | 27.1 ± 1.6 | 1.2 ns | 30.4 ± 0.4 | 34.3 ± 0.9 | 1.1 ** | 33.2 ± 0.4 | 35.9 ± 0.9 | 1.1 * | ||
| RAM14 | 25.2 ± 3.8 | 32.6 ± 0.8 | 1.3 ns | 33.9 ± 2.5 | 36.9 ± 1.3 | 1.1 ns | 34.3 ± 2.5 | 36.7 ± 2.1 | 1.1 ns | ||
| RAM59 | 26.8 ± 2.7 | 32.8 ± 0.9 | 1.2 ns | 37.4 ± 1.6 | 37.2 ± 1.0 | 1.0 ns | 37.1 ± 1.6 | 38.3 ± 0.9 | 1.0 ns | ||
| RAM97 | 32.7 ± 2.8 | 30.0 ± 0.6 | 0.9 ns | 36.3 ± 0.5 | 36.6 ± 0.9 | 1.0 ns | 37.5 ± 0.5 | 37.4 ± 0.3 | 1.0 ns | ||
| RAM101 | 34.0 ± 0.8 | 34.6 ± 0.6 | 1.0 ns | 37.1 ± 4.7 | 37.7 ± 0.8 | 1.0 ns | 30.9 ± 4.7 | 37.7 ± 1.1 | 1.2 ns | ||
| Average of O. glaberrima | 28.2 ± 2.4 | 31.4 ± 0.9 | 1.1 ns | 35.0 ± 1.1 | 36.5 ± 1.0 | 1.0 ns | 34.6 ± 1.9 | 37.2 ± 1.0 | 1.1 ns | ||
| Koshihikari | 9.9 ± 3.1 | 16.1 ± 5.5 | 1.6 ns | 26.4 ± 3.2 | 24.3 ± 1.6 | 0.9 ns | 26.8 ± 3.2 | 30.5 ± 1.8 | 1.1 ns | ||
| Minamihatamochi | 30.2 ± 1.7 | 30.7 ± 3.0 | 1.8 ns | 41.7 ± 0.4 | 32.7 ± 2.2 | 0.8 * | 39.1 ± 0.4 | 37.3 ± 0.4 | 1.0 ns | ||
| Average of O. sativa | 20.0 ± 2.4 | 23.4 ± 4.2 | 1.3 ns | 34.1 ± 2.2 | 28.5 ± 1.9 | 0.9 ns | 33.0 ± 1.8 | 33.9 ± 1.5 | 1.0 ns | ||
| Genotype | TLA (cm2) | SLA (mm2/mg) | SLW (mg/mm2) | ||||||||
|---|---|---|---|---|---|---|---|---|---|---|---|
| Control (C) | Drought (D) | D/C ratio | Control (C) | Drought (D) | D/C ratio | Control (C) | Drought (D) | D/C ratio | |||
| RAM12 | 23.2 ± 1.0 | 23.3 ± 4.6 | 1.0 ns | 33.2 ± 0.03 | 38.8 ± 0.03 | 1.1 * | 0.03 ± 0.000 | 0.03 ± 0.002 | 0.9 ns | ||
| RAM14 | 20.3 ± 3.5 | 23.2 ± 4.7 | 1.1 ns | 30.7 ± 0.03 | 29.0 ± 0.02 | 0.9 ns | 0.03 ± 0.003 | 0.03 ± 0.002 | 0.3 ns | ||
| RAM59 | 25.3 ± 0.6 | 32.7 ± 1.9 | 1.2 * | 32.0 ± 0.03 | 31.3 ± 0.02 | 0.9 ns | 0.03 ± 0.001 | 0.03 ± 0.000 | 1.0 ns | ||
| RAM97 | 28.9 ± 2.5 | 25.5 ± 5.5 | 0.8 ns | 31.1 ± 0.02 | 32.1 ± 0.04 | 1.0 ns | 0.03 ± 0.000 | 0.03 ± 0.004 | 0.9 ns | ||
| RAM101 | 24.4 ± 4.3 | 27.3 ± 1.1 | 1.1 ns | 32.1 ± 0.03 | 30.1 ± 0.03 | 0.9 ns | 0.03 ± 0.000 | 0.03 ± 0.003 | 1.0 ns | ||
| Average of O. glaberrima | 24.4 ± 2.4 | 26.4 ± 3.6 | 1.0 ns | 31.8 ± 0.03 | 32.3 ± 0.03 | 1.0 ns | 0.03 ± 0.001 | 0.03 ± 0.002 | 0.9 ns | ||
| Koshihikari | 5.0 ± 1.1 | 3.7 ± 0.2 | 0.7 ns | 31.9 ± 0.03 | 24.2 ± 0.00 | 0.7 * | 0.03 ± 0.001 | 0.05 ± 0.003 | 1.5 ** | ||
| Minamihatamochi | 24.7 ± 2.7 | 12.3 ± 1.8 | 0.5 ** | 32.7 ± 0.03 | 23.9 ± 0.02 | 0.7 * | 0.03 ± 0.002 | 0.04 ± 0.005 | 1.4 * | ||
| Average of O. sativa | 14.9 ± 1.9 | 8.0 ± 1.0 | 0.5 * | 32.3 ± 0.03 | 24.0 ± 0.01 | 0.7 * | 0.03 ± 0.001 | 0.04 ± 0.004 | 1.5 * | ||
Table 2 Effects of gradual soil drying on total leaf area (TLA), specific leaf area (SLA), and specific leaf weight (SLW) of seven rice genotypes after recovery.
| Genotype | TLA (cm2) | SLA (mm2/mg) | SLW (mg/mm2) | ||||||||
|---|---|---|---|---|---|---|---|---|---|---|---|
| Control (C) | Drought (D) | D/C ratio | Control (C) | Drought (D) | D/C ratio | Control (C) | Drought (D) | D/C ratio | |||
| RAM12 | 23.2 ± 1.0 | 23.3 ± 4.6 | 1.0 ns | 33.2 ± 0.03 | 38.8 ± 0.03 | 1.1 * | 0.03 ± 0.000 | 0.03 ± 0.002 | 0.9 ns | ||
| RAM14 | 20.3 ± 3.5 | 23.2 ± 4.7 | 1.1 ns | 30.7 ± 0.03 | 29.0 ± 0.02 | 0.9 ns | 0.03 ± 0.003 | 0.03 ± 0.002 | 0.3 ns | ||
| RAM59 | 25.3 ± 0.6 | 32.7 ± 1.9 | 1.2 * | 32.0 ± 0.03 | 31.3 ± 0.02 | 0.9 ns | 0.03 ± 0.001 | 0.03 ± 0.000 | 1.0 ns | ||
| RAM97 | 28.9 ± 2.5 | 25.5 ± 5.5 | 0.8 ns | 31.1 ± 0.02 | 32.1 ± 0.04 | 1.0 ns | 0.03 ± 0.000 | 0.03 ± 0.004 | 0.9 ns | ||
| RAM101 | 24.4 ± 4.3 | 27.3 ± 1.1 | 1.1 ns | 32.1 ± 0.03 | 30.1 ± 0.03 | 0.9 ns | 0.03 ± 0.000 | 0.03 ± 0.003 | 1.0 ns | ||
| Average of O. glaberrima | 24.4 ± 2.4 | 26.4 ± 3.6 | 1.0 ns | 31.8 ± 0.03 | 32.3 ± 0.03 | 1.0 ns | 0.03 ± 0.001 | 0.03 ± 0.002 | 0.9 ns | ||
| Koshihikari | 5.0 ± 1.1 | 3.7 ± 0.2 | 0.7 ns | 31.9 ± 0.03 | 24.2 ± 0.00 | 0.7 * | 0.03 ± 0.001 | 0.05 ± 0.003 | 1.5 ** | ||
| Minamihatamochi | 24.7 ± 2.7 | 12.3 ± 1.8 | 0.5 ** | 32.7 ± 0.03 | 23.9 ± 0.02 | 0.7 * | 0.03 ± 0.002 | 0.04 ± 0.005 | 1.4 * | ||
| Average of O. sativa | 14.9 ± 1.9 | 8.0 ± 1.0 | 0.5 * | 32.3 ± 0.03 | 24.0 ± 0.01 | 0.7 * | 0.03 ± 0.001 | 0.04 ± 0.004 | 1.5 * | ||
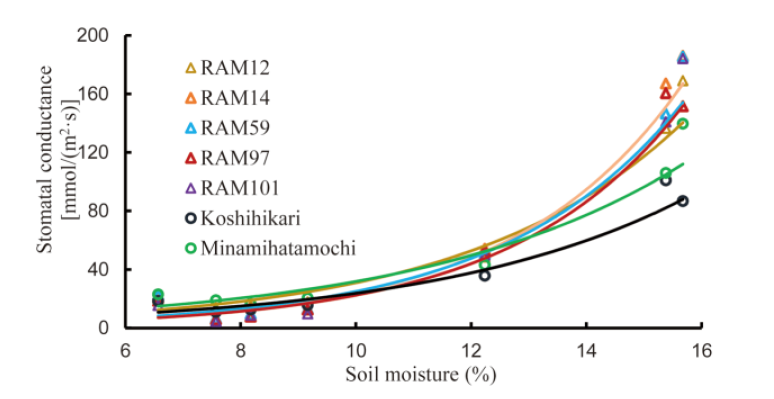
Fig. 3. Trend of relationship between soil moisture content and stomatal conductance in seven rice genotypes.
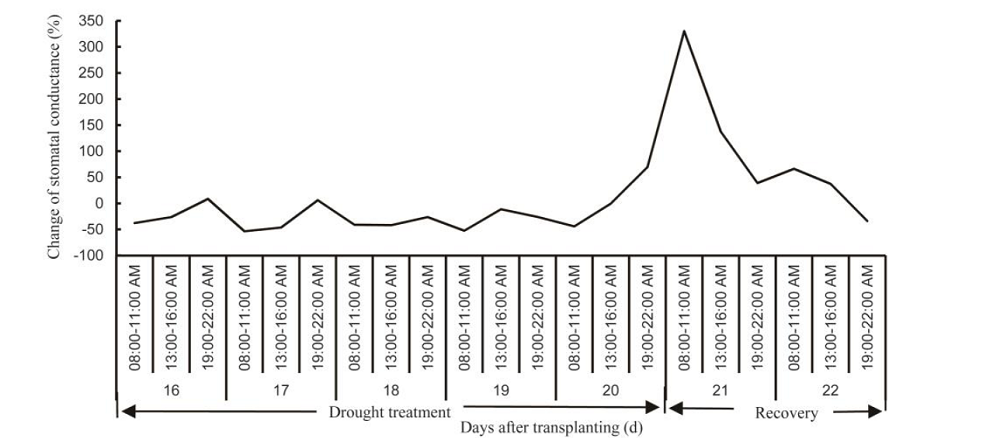
Fig. 2. Stomatal conductance reduction during gradual soil drying conditions and its increment at recovery stage compared to control. ===Re-irrigation after stress was conducted at night of 20 d after transplanting.
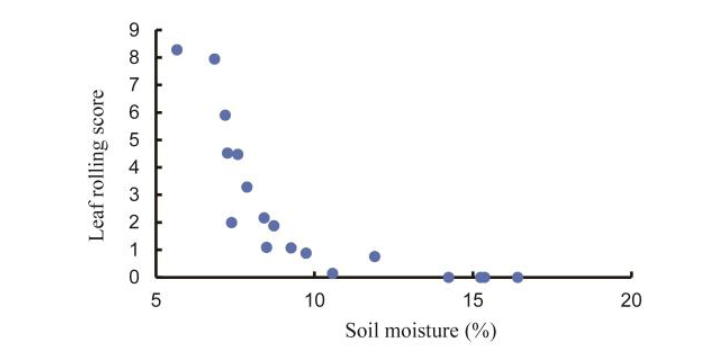
Fig. 4. Trend of relationship between soil moisture content and leaf rolling score in seven rice genotypes.
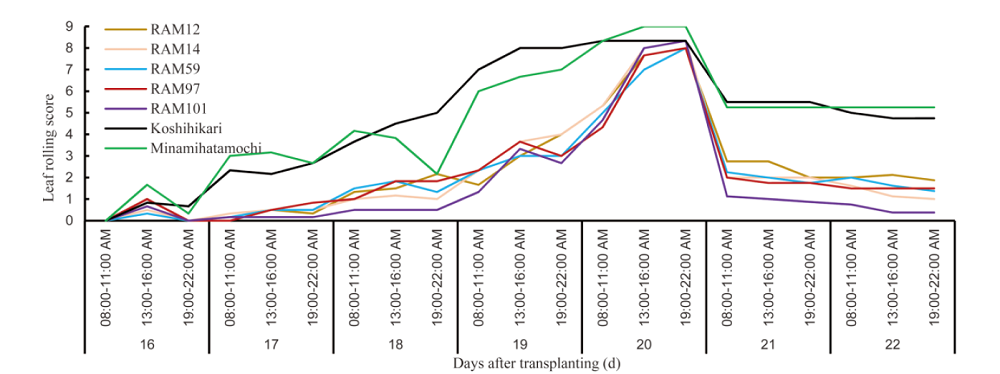
Fig. 5. Leaf rolling score of seven rice genotypes at gradual soil drying and recovery conditions.
| Genotype | Coarse root length (cm) | Fine root length (cm) | Surface area (cm2) | Volume (cm3) | |||||||||||
|---|---|---|---|---|---|---|---|---|---|---|---|---|---|---|---|
| Control | Drought | D/C ratio | Control | Drought | D/C ratio | Control | Drought | D/C ratio | Control | Drought | D/C ratio | ||||
| RAM12 | 98.7 ± 6.3 | 104.3 ± 33.0 | 1.1 ns | 290.0 ± 14.9 | 228.9 ± 68.8 | 0.8 ns | 54.7 ± 4.3 | 34.2 ± 1.5 | 0.6 * | 0.6 ± 0.07 | 0.3 ± 0.12 | 0.5 * | |||
| RAM14 | 63.3 ± 2.0 | 50.0 ± 2.1 | 0.8 ** | 241.2 ± 48.9 | 174.3 ± 30.4 | 0.7 ns | 38.0 ± 3.5 | 26.1 ± 1.9 | 0.7 ** | 0.4 ± 0.04 | 0.2 ± 0.00 | 0.6 * | |||
| RAM59 | 88.5 ± 9.3 | 73.9 ± 11.9 | 0.8 ns | 361.7 ± 32.3 | 268.2 ± 55.4 | 0.7 ns | 54.1 ± 5.4 | 40.7 ± 7.9 | 0.8 ns | 0.5 ± 0.05 | 0.4 ± 0.07 | 0.7 ns | |||
| RAM97 | 151.4 ± 31.5 | 69.1 ± 9.5 | 0.5 * | 520.1 ± 73.8 | 231.1 ± 53.1 | 0.4 ** | 83.5 ± 14.2 | 36.3 ± 6.8 | 0.4 ** | 0.8 ± 0.01 | 0.4 ± 0.06 | 0.4 * | |||
| RAM101 | 77.7 ± 8.2 | 72.1 ± 20.2 | 0.9 ns | 353.6 ± 22.9 | 253.0 ± 73.0 | 0.7 ns | 51.4 ± 5.1 | 37.6 ± 1.5 | 0.7 ns | 0.5 ± 0.00 | 0.3 ± 0.09 | 0.7 * | |||
| OG | 95.9 ± 11.5 | 73.9 ± 15.3 | 0.8 ns | 353.3 ± 38.5 | 231.1 ± 56.2 | 0.7 ns | 56.3 ± 6.5 | 35.0 ± 3.9 | 0.6 * | 0.6 ± 0.07 | 0.3 ± 0.07 | 0.6 * | |||
| Koshihikari | 25.8 ± 3.3 | 8.9 ± 0.4 | 0.3 ** | 164.1 ± 39.9 | 87.9 ± 16.0 | 0.5 * | 20.5 ± 3.1 | 10.0 ± 1.5 | 0.5 ** | 0.2 ± 0.02 | 0.1 ± 0.01 | 0.5 * | |||
| MH | 203.4 ± 9.8 | 61.6 ± 6.4 | 0.3 ns | 271.4 ± 91.0 | 318.0 ± 57.0 | 1.2 ns | 57.0 ± 2.2 | 42.1 ± 7.6 | 0.7 * | 0.5 ± 0.03 | 0.4 ± 0.07 | 0.7 * | |||
| OS | 114.6 ± 6.5 | 35.2 ± 3.4 | 0.3 * | 217.8 ± 65.9 | 202.9 ± 36.7 | 0.9 ns | 38.8 ± 2.6 | 26.1 ± 4.6 | 0.7 * | 0.4 ± 0.02 | 0.2 ± 0.04 | 0.6 * | |||
Table 3 Effects of gradual soil drying on length, surface area and volume of roots in seven rice genotypes.
| Genotype | Coarse root length (cm) | Fine root length (cm) | Surface area (cm2) | Volume (cm3) | |||||||||||
|---|---|---|---|---|---|---|---|---|---|---|---|---|---|---|---|
| Control | Drought | D/C ratio | Control | Drought | D/C ratio | Control | Drought | D/C ratio | Control | Drought | D/C ratio | ||||
| RAM12 | 98.7 ± 6.3 | 104.3 ± 33.0 | 1.1 ns | 290.0 ± 14.9 | 228.9 ± 68.8 | 0.8 ns | 54.7 ± 4.3 | 34.2 ± 1.5 | 0.6 * | 0.6 ± 0.07 | 0.3 ± 0.12 | 0.5 * | |||
| RAM14 | 63.3 ± 2.0 | 50.0 ± 2.1 | 0.8 ** | 241.2 ± 48.9 | 174.3 ± 30.4 | 0.7 ns | 38.0 ± 3.5 | 26.1 ± 1.9 | 0.7 ** | 0.4 ± 0.04 | 0.2 ± 0.00 | 0.6 * | |||
| RAM59 | 88.5 ± 9.3 | 73.9 ± 11.9 | 0.8 ns | 361.7 ± 32.3 | 268.2 ± 55.4 | 0.7 ns | 54.1 ± 5.4 | 40.7 ± 7.9 | 0.8 ns | 0.5 ± 0.05 | 0.4 ± 0.07 | 0.7 ns | |||
| RAM97 | 151.4 ± 31.5 | 69.1 ± 9.5 | 0.5 * | 520.1 ± 73.8 | 231.1 ± 53.1 | 0.4 ** | 83.5 ± 14.2 | 36.3 ± 6.8 | 0.4 ** | 0.8 ± 0.01 | 0.4 ± 0.06 | 0.4 * | |||
| RAM101 | 77.7 ± 8.2 | 72.1 ± 20.2 | 0.9 ns | 353.6 ± 22.9 | 253.0 ± 73.0 | 0.7 ns | 51.4 ± 5.1 | 37.6 ± 1.5 | 0.7 ns | 0.5 ± 0.00 | 0.3 ± 0.09 | 0.7 * | |||
| OG | 95.9 ± 11.5 | 73.9 ± 15.3 | 0.8 ns | 353.3 ± 38.5 | 231.1 ± 56.2 | 0.7 ns | 56.3 ± 6.5 | 35.0 ± 3.9 | 0.6 * | 0.6 ± 0.07 | 0.3 ± 0.07 | 0.6 * | |||
| Koshihikari | 25.8 ± 3.3 | 8.9 ± 0.4 | 0.3 ** | 164.1 ± 39.9 | 87.9 ± 16.0 | 0.5 * | 20.5 ± 3.1 | 10.0 ± 1.5 | 0.5 ** | 0.2 ± 0.02 | 0.1 ± 0.01 | 0.5 * | |||
| MH | 203.4 ± 9.8 | 61.6 ± 6.4 | 0.3 ns | 271.4 ± 91.0 | 318.0 ± 57.0 | 1.2 ns | 57.0 ± 2.2 | 42.1 ± 7.6 | 0.7 * | 0.5 ± 0.03 | 0.4 ± 0.07 | 0.7 * | |||
| OS | 114.6 ± 6.5 | 35.2 ± 3.4 | 0.3 * | 217.8 ± 65.9 | 202.9 ± 36.7 | 0.9 ns | 38.8 ± 2.6 | 26.1 ± 4.6 | 0.7 * | 0.4 ± 0.02 | 0.2 ± 0.04 | 0.6 * | |||
| Genotype | Total dry weight (mg) | Shoot dry weight (mg) | Root dry weight (mg) | ||||||||
|---|---|---|---|---|---|---|---|---|---|---|---|
| Control (C) | Drought (D) | D/C ratio | Control (C) | Drought (D) | D/C ratio | Control (C) | Drought (D) | D/C ratio | |||
| RAM12 | 149.5 ± 9.0 | 126.1 ± 19.2 | 0.8 ns | 112.9 ± 7.1 | 96.3 ± 22.9 | 0.9 ns | 39.1 ± 5.8 | 27.0 ± 5.8 | 0.7 ns | ||
| RAM14 | 141.6 ± 10.8 | 134.4 ± 11.6 | 1.0 ns | 112.7 ± 10.8 | 117.0 ± 11.6 | 1.0 ns | 28.0 ± 0.6 | 20.2 ± 0.6 | 0.7 * | ||
| RAM59 | 152.1 ± 4.5 | 202.6 ± 4.5 | 1.3 ns | 117.7 ± 1.2 | 161.3 ± 4.3 | 1.4 ** | 32.5 ± 2.4 | 41.3 ± 2.4 | 1.3 ns | ||
| RAM97 | 217.1 ± 24.8 | 170.0 ± 18.4 | 0.8 * | 152.9 ± 17.4 | 132.6 ± 18.8 | 0.9 ns | 72.4 ± 2.3 | 33.2 ± 2.3 | 0.5 ** | ||
| RAM101 | 161.3 ± 18.3 | 173.2 ± 31.9 | 1.1 ns | 121.3 ± 16.1 | 137.3 ± 21.7 | 1.1 ns | 43.9 ± 0.3 | 25.0 ± 0.3 | 0.6 ns | ||
| Mean of O. glaberrima | 164.3 ± 13.5 | 161.3 ± 17.1 | 1.0 ns | 123.5 ± 10.5 | 128.9 ± 15.9 | 1.0 ns | 43.2 ± 2.3 | 29.4 ± 3.9 | 0.7 ns | ||
| Koshihikari | 51.1 ± 6.1 | 37.2 ± 3.2 | 0.7 * | 35.7 ± 6.4 | 31.6 ± 3.1 | 0.9 ns | 14.6 ± 0.8 | 5.4 ± 0.8 | 0.4 ** | ||
| Minamihatamochi | 184.2 ± 1.8 | 122.2 ± 11.8 | 0.7 ** | 130.1 ± 7.5 | 80.7 ± 5.6 | 0.6 ** | 49.6 ± 3.3 | 42.6 ± 3.3 | 0.9 ns | ||
| Mean of O. sativa | 117.7 ± 4.0 | 79.7 ± 7.5 | 0.7 * | 82.9 ± 6.9 | 56.2 ± 4.38 | 0.7 * | 32.1 ± 2.0 | 24.0 ± 2.7 | 0.8 * | ||
Table 4 Effects of gradual soil drying on dry weight of seven rice genotypes.
| Genotype | Total dry weight (mg) | Shoot dry weight (mg) | Root dry weight (mg) | ||||||||
|---|---|---|---|---|---|---|---|---|---|---|---|
| Control (C) | Drought (D) | D/C ratio | Control (C) | Drought (D) | D/C ratio | Control (C) | Drought (D) | D/C ratio | |||
| RAM12 | 149.5 ± 9.0 | 126.1 ± 19.2 | 0.8 ns | 112.9 ± 7.1 | 96.3 ± 22.9 | 0.9 ns | 39.1 ± 5.8 | 27.0 ± 5.8 | 0.7 ns | ||
| RAM14 | 141.6 ± 10.8 | 134.4 ± 11.6 | 1.0 ns | 112.7 ± 10.8 | 117.0 ± 11.6 | 1.0 ns | 28.0 ± 0.6 | 20.2 ± 0.6 | 0.7 * | ||
| RAM59 | 152.1 ± 4.5 | 202.6 ± 4.5 | 1.3 ns | 117.7 ± 1.2 | 161.3 ± 4.3 | 1.4 ** | 32.5 ± 2.4 | 41.3 ± 2.4 | 1.3 ns | ||
| RAM97 | 217.1 ± 24.8 | 170.0 ± 18.4 | 0.8 * | 152.9 ± 17.4 | 132.6 ± 18.8 | 0.9 ns | 72.4 ± 2.3 | 33.2 ± 2.3 | 0.5 ** | ||
| RAM101 | 161.3 ± 18.3 | 173.2 ± 31.9 | 1.1 ns | 121.3 ± 16.1 | 137.3 ± 21.7 | 1.1 ns | 43.9 ± 0.3 | 25.0 ± 0.3 | 0.6 ns | ||
| Mean of O. glaberrima | 164.3 ± 13.5 | 161.3 ± 17.1 | 1.0 ns | 123.5 ± 10.5 | 128.9 ± 15.9 | 1.0 ns | 43.2 ± 2.3 | 29.4 ± 3.9 | 0.7 ns | ||
| Koshihikari | 51.1 ± 6.1 | 37.2 ± 3.2 | 0.7 * | 35.7 ± 6.4 | 31.6 ± 3.1 | 0.9 ns | 14.6 ± 0.8 | 5.4 ± 0.8 | 0.4 ** | ||
| Minamihatamochi | 184.2 ± 1.8 | 122.2 ± 11.8 | 0.7 ** | 130.1 ± 7.5 | 80.7 ± 5.6 | 0.6 ** | 49.6 ± 3.3 | 42.6 ± 3.3 | 0.9 ns | ||
| Mean of O. sativa | 117.7 ± 4.0 | 79.7 ± 7.5 | 0.7 * | 82.9 ± 6.9 | 56.2 ± 4.38 | 0.7 * | 32.1 ± 2.0 | 24.0 ± 2.7 | 0.8 * | ||
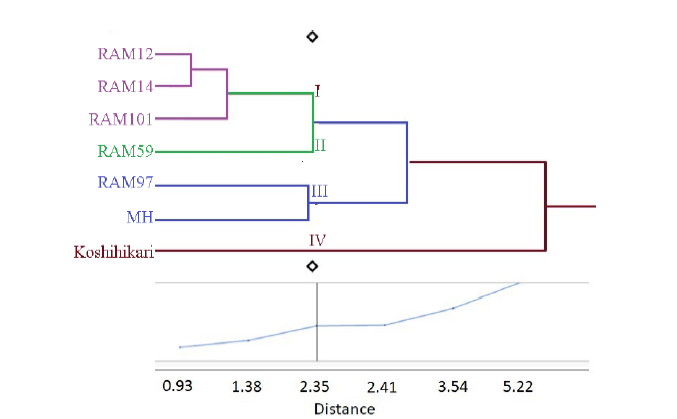
Fig. 6. Hierarchical cluster analysis of the seven rice genotypes based on SPAD value, dry matter accumulation, leaf and root traits in gradual soil drying conditions.===MH, Minamihatamochi.
| [1] | Agnoun Y, Biaou S S H, Sié M, Vodouhè R S, Ahanchédé A.2012. The African riceOryza glaberrima Steud: Knowledge distribution and prospects. Int J Biol, 4(3): 158-180. |
| [2] | Allah A A A.2009. Genetic studies on leaf rolling and some root traits under drought conditions in rice (Oryza sativa L.). Afr J Biotechnol, 8(22): 6241-6248. |
| [3] | Bouman B A M, Tuong T P.2001. Field water management to save water and increase its productivity in irrigated lowland rice.Agric Water Manage, 49: 11-30. |
| [4] | Chaves M M, Pereira J S, Maroco J, Rodrigues M L, Ricardo C P P, Osório M L, Carvalho I, Faria T, Pinheiro C.2002. How plants cope with water stress in the field? Photosynthesis and growth.Ann Bot, 89(7): 907-916. |
| [5] | Comas L H, Becker S R, Cruz V M, Byrne P F, Dierig D A.2013. Root traits contributing to plant productivity under drought.Front Plant Sci, 4: 442. |
| [6] | Dingkuhn M, Audebert A Y, Jones M P, Etienne K, Sow A.1999. Control of stomatal conductance and leaf rolling inO. sativa and O. glaberrima upland rice. Field Crops Res, 61(3): 223-236. |
| [7] | Djedatin G, Ndjiondjop M N, Mathieu T, Cruz C M V, Sanni A, Ghesquière A, Verdier V.2011. Evaluation of African cultivated riceOryza glaberrima for resistance to bacterial blight. Plant Dis, 95(4): 441-447. |
| [8] | Fahad S, Bajwa A A, Nazir U, Anjum S A, Farooq A, Zohaib A, Sadia S, Nasim W, Adkins S, Saud S, Ihsan M Z, Alharby H, Wu C, Wang D P, Huang J L.2017. Crop production under drought and heat stress: Plant responses and management options.Front Plant Sci, 8: 1-16. |
| [9] | Fang Y J, Xiong L Z.2015. General mechanisms of drought response and their application in drought resistance improvement in plants.Cell Mol Life Sci, 72(4): 673-689. |
| [10] | Feng F J, Xu X Y, Du X B, Tong H H, Luo L J, Mei H W.2012. Assessment of drought resistance among wild rice accessions using a protocol based on single-tiller propagation and PVC-tube cultivation.Aust J Crop Sci, 6(7): 1204-1211. |
| [11] | Gimenez C, Gallardo M, Thompson R B.2005. Plant-water relations. In: Hillel D. Encyclopedia of Soils in the Environment. Oxford: Elsevier: 231-238. |
| [12] | Guo Y Y, Yu H Y, Kong D S, Yan F, Liu D H, Zhang Y J.2015. Effects of gradual soil drought stress on the growth, biomass partitioning, and chlorophyll fluorescence ofPrunus mongolica seedlings. Turk J Biol, 39(4): 532-539. |
| [13] | Heinemann A B, Stone L F, Fageria N K.2011. Transpiration rate response to water deficit during vegetative and reproductive phases of upland rice cultivars.Sci Agric, 68(1): 24-30. |
| [14] | Huang M, Chen J N, Cao F B, Jiang L G, Zou Y B.2015. Root morphology was improved in a late-stage vigor super rice cultivar.PLoS One, 10(11): e0142977. |
| [15] | International Rice Research Institute (IRRI). 2002. Standard Evaluation System for Rice. Los Banos, the Philippines: IRRI. |
| [16] | Jaleel C A, Manivannan P, Wahid A, Farooq M, Al-Juburi H J, Somasundaram R, Panneerselvam R.2009. Drought stress in plants: A review on morphological characteristics and pigments composition.Int J Agric Biol, 11(1): 100-105. |
| [17] | Kadioglu A, Terzi R.2007. A dehydration avoidance mechanism: Leaf rolling.Bot Rev, 73(4): 290-302. |
| [18] | Kartika K, Lakitan B, Sanjaya N, Wijaya A, Kadir S, Kurnianingsih A, Widuri L I, Siaga E, Meihana M.2018a. Internal versus edge row comparison in jajar legowo 4:1 rice planting pattern at different frequency of fertilizer applications.Agrivita, 40(2): 222-232. |
| [19] | Kartika K, Lakitan B, Wijaya A, Kadir S, Widuri L I, Siaga E, Meihana M.2018b. Effects of particle size and application rate of rice-husk biochar on chemical properties of tropical wetland soil, rice growth and yield.Aust J Crop Sci, 12(5): 817-826. |
| [20] | Katsura K, Tsujimoto Y, Oda M, Matsushima K I, Inusah B, Dogbe W, Sakagami J I.2016. Genotype-by-environment interaction analysis of rice (Oryza spp.) yield in a floodplain ecosystem in West Africa. Eur J Agron, 73: 152-159. |
| [21] | Kijoji A A, Nchimbi-Msolla S, Kanyeka Z L, Klassen S P, Serraj R, Henry A.2013. Water extraction and root traits inOryza sativa × Oryza glaberrima introgression lines under different soil moisture regimes. Funct Plant Biol, 40(1): 54-66. |
| [22] | Koffler B E, Luschin-Ebengreuth N, Stabentheiner E, Müller M, Zechmann B.2014. Compartment specific response of antioxidants to drought stress inArabidopsis. Plant Sci, 227: 133-144. |
| [23] | Lakitan B, Alberto A, Lindiana L, Kartika K, Herlinda S, Kurnianingsih A.2018a. The benefits of bichar on growth and yield in tropical riparian wetland, South Sumatera, Indonesia.CMUJ Nat Sci, 17(2): 111-126. |
| [24] | Lakitan B, Hadi B, Herlinda S, Siaga E, Widuri L I, Kartika K, Lindiana L, Yunindyawati Y, Meihana M.2018b. Recognizing farmers’ practices and constraints for intensifying rice production at riparian wetlands in Indonesia.NJAS Wagen J Life Sci, 84: 10-20. |
| [25] | Lisar S Y S, Motafakkerazad R, Hossain M M, Rahman I M M.2012. Water Stress in Plants: Causes, Effects and Responses. Rijeka, Croatia: InTech: 1-14. |
| [26] | Ndjiondjop M N, Seck P A, Lorieux M, Futakuchi K, Yao K N, Djedatin G, Sow M E, Bocco R, Cisse F, Fatondji B.2012. Effect of drought onOryza glaberrima rice accessions and Oryza glaberrima derived-lines. Asian J Agric Res, 6(4): 144-157. |
| [27] | Ouyang W J, Struik P C, Yin X Y, Yang J C.2017. Stomatal conductance, mesophyll conductance, and transpiration efficiency in relation to leaf anatomy in rice and wheat genotypes under drought.J Exp Bot, 68(18): 5191-5205. |
| [28] | Pandey V, Shukla A.2015. Acclimation and tolerance strategies of rice under drought stress.Rice Sci, 22(4): 147-161. |
| [29] | Pantuwan G, Fukai S, Cooper M, Rajatasereekul S, O’Toole J C.2002. Yield response of rice (Oryza sativa L.) genotypes to drought under rainfed lowlands: 2. Selection of drought resistant genotypes. Field Crops Res, 73: 169-180. |
| [30] | Rodenburg J, Saito K, Kakaï R G, Touré A, Mariko M, Kiepe P.2009. Weed competitiveness of the lowland rice varieties of NERICA in the southern Guinea Savanna.Field Crops Res, 114(3): 411-418. |
| [31] | Sakagami J I, Joho Y, Ito O.2009. Contrasting physiological responses by cultivars ofOryza sativa and O. glaberrima to prolonged submergence. Ann Bot, 103(2): 171-180. |
| [32] | Sakagami J I, Joho Y, Sone C.2013. Complete submergence escape with shoot elongation ability by underwater photosynthesis in African rice,Oryza glaberrima Steud. Field Crops Res, 152: 17-26. |
| [33] | Sarla N, Swamy B P M.2005. Oryza glaberrima: A source for the improvement of Oryza sativa. Curr Sci, 89(6): 955-963. |
| [34] | Sarvestani Z T, Pirdashti H, Sanavy S A M M, Balouchi H.2008. Study of water stress effects in different growth stages on yield and yield components of different rice (Oryza sativa L.) cultivars. Pak J Biol Sci, 11(10): 1303-1309. |
| [35] | Siaga E, Lakitan B, Hasbi, Bernas S M, Wijaya A, Lisda R, Ramadhani F, Widuri L I, Kartika K, Meihana M.2018. Application of floating culture system in chili pepper (Capsicum annum L.) during prolonged flooding period at riparian wetland in Indonesia. Aust J Crop Sci, 12(5): 808-816. |
| [36] | Sikirou M, Shittu A, Konaté K A, Maji A T, Ngaujah A S, Sanni K A, Ogunbayo S A, Akintayo I, Saito K, Dramé K N, Ahanchédé A, Venuprasad R.2018. Screening African rice (Oryza glaberrima) for tolerance to abiotic stresses: I. Fe toxicity. Field Crops Res, 220: 3-9. |
| [37] | Timung B, Bharali B, Konwar M J.2017. Physiological parameters of some upland rice (Oryza sativa L.) genotypes under moisture stress condition. J Pharm Phytochem, 6(6): 1636-1640. |
| [38] | Wellstein C, Poschlod P, Gohlke A, Chelli S, Campetella G, Rosbakh S, Canullo R, Kreyling J, Jentsch A, Beierkuhnlein C.2017. Effects of extreme drought on specific leaf area of grassland species: A meta-analysis of experimental studies in temperate and sub-Mediterranean systems.Glob Change Biol, 23(6): 2473-2481. |
| [39] | Widuri L I, Lakitan B, Hasmeda M, Sodikin E, Wijaya A, Meihana M, Kartika K, Siaga E.2017. Relative leaf expansion rate and other leaf-related indicators for detection of drought stress in chili pepper (Capsicum annuum L.). Aust J Crop Sci, 11(12): 1617-1625. |
| [40] | Zhang Q F, Wing R A.2013. Genetics and genomics of rice.Plant Genet Genom: Crops Models, 5: 9-25. |
| [1] | Ammara Latif, Sun Ying, Pu Cuixia, Noman Ali. Rice Curled Its Leaves Either Adaxially or Abaxially to Combat Drought Stress [J]. Rice Science, 2023, 30(5): 405-416. |
| [2] | Gao Xiuying, Zhang Ye, Zhang Hongsheng, Huang Ji. A β-ketoacyl-CoA Synthase OsCUT1 Confers Increased Drought Tolerance in Rice [J]. Rice Science, 2022, 29(4): 353-362. |
| [3] | Silas Akos Ibrahim, Y. Rafii Mohd, Razi Ismail Mohd, Izan Ramlee Shairul, Abd Aziz Shamsudin Noraziyah, Ramli Asfaliza, Chibuike Chukwu Samuel, Swaray Senesie, Jalloh Momodu. Evaluation of Inherited Resistance Genes of Bacterial Leaf Blight, Blast and Drought Tolerance in Improved Rice Lines [J]. Rice Science, 2021, 28(3): 279-288. |
| [4] | Minghua Zhang, Zhaowen Mo, Juan Liao, Shenggang Pan, Xiongfei Chen, Le Zheng, Xiwen Luo, Zaiman Wang. Lodging Resistance Related to Root Traits for Mechanized Wet-Seeding of Two Super Rice Cultivars [J]. Rice Science, 2021, 28(2): 200-208. |
| [5] | Kamarul Zaman Nadzariah, Yusoff Abdullah Mohd, Othman Sariam, Kamarul Zaman Nadzirah. Growth and Physiological Performance of Aerobic and Lowland Rice as Affected by Water Stress at Selected Growth Stages [J]. Rice Science, 2018, 25(2): 82-93. |
| [6] | Saakre Manjesh, Meera Baburao Thirthikar, Puthenpeedikal Salim Abida, Mary Ffancies Rose, Poothecty Achuthan Valasala, Thomas George, Radha Sivarajan Sajeevan. Identification and Characterization of Genes Responsible for Drought Tolerance in Rice Mediated by Pseudomonas fluorescens [J]. Rice Science, 2017, 24(5): 291-298. |
| [7] | Vaiphot KANJOO1,2, Kanchana PUNYAWAEW3, Jonaliza L. SIANGLIW3, Suwat JEARAKONGMAN4, Apichart VANAVICHIT5,6, Theerayut TOOJINDA3. Evaluation of Agronomic Traits in Chromosome Segment Substitution Lines of KDML105 Containing Drought Tolerance QTL under Drought Stress [J]. RICE SCIENCE, 2012, 19(2): 117-124. |
| [8] | XU Qun, YUAN Xiao-ping, YU Han-yong, WANG Yi-ping, TANG Sheng-xiang, WEI Xing-hua. Mapping QTLs for Drought Tolerance at Seedling Stage in Rice Using Doubled Haploid Population [J]. RICE SCIENCE, 2011, 18(1): 23-28 . |
| [9] | GUO Yuan, CHENG Bao-shan, HONG De-lin. Construction of SSR Linkage Map and Analysis of QTLs for Rolled Leaf in Japonica Rice [J]. RICE SCIENCE, 2010, 17(1): 28-34 . |
| [10] | HU Ning, LU Chuan-gen, YAO Ke-min, ZOU Jiang-shi. Simulation on Distribution of Photosynthetically Active Radiation in Canopy and Optimum Leaf Rolling Index in Rice with Rolling Leaves [J]. RICE SCIENCE, 2009, 16(3): 217-225 . |
| Viewed | ||||||
|
Full text |
|
|||||
|
Abstract |
|
|||||